![[OLD FALL 2019] 15-104 • Introduction to Computing for Creative Practice](../../wp-content/uploads/2020/08/stop-banner.png)
//Yoshi Torralva
//yrt@andrew.cmu.edu
//Final Project
//Section E
//storefront mockup
var mockup;
//input of camera variable
var cameraData;
//points for the hypotrochoid
var pixelPoints = 1000;
//location of hypotrochoid x position array
var placeCurvesX = [];
//location of hypotrochoid y position array
var placeCurvesY = [];
// array to store list of colors at 16 points
var getColors = [];
// array to store brightness of pixels at 16 points
var getBrightness =[];
// varible to move the 16 hypotrochoid's in indivudal rotation
var hypotrochoidsRotate = -1;
// scaled canvas for the interaction in the mockup
var SquareW = 154;
//lading the storefront mockup image
//vector image created by me with Adobe Illustrator
function preload() {
mockup = loadImage("https://i.imgur.com/pTMuI2T.png");
}
//connecting cameraData variable to createCapture
function setup() {
createCanvas(600, 480);
cameraData = createCapture(VIDEO);
cameraData.hide();
noStroke();
}
function draw() {
background(172, 34, 104);
//loading pixels into the canvas
cameraData.loadPixels();
//reflecting and scaling the camera data
//when visitors move to the right/left, it properly reflects movements
push();
translate(150, 0);
scale(-1, 1);
//sizing cameraData to the screen
image(cameraData, 0,0, 154, 154);
pop();
//calling the hypotrochoids function to draw 16 hypotrochoids
hypotrochoids();
//scaling the image from imgur
//placing it above hypotrochoids so that hypotrochoids dont go over the screen
push();
scale(0.24);
image(mockup, 0, 0);
pop();
}
//creating a function to draw a singular hypotrochoid
//setting four parameters for x position, y position, the curves color at one of the 16 points
//and the brightness of one of the 16 points
function drawCurve(x,y, curveColor, curveBrightness) {
push();
//translating with x and y for call parameters
translate(x, y);
//using the brightness in the map() of h and a to adjust size based on camera
var h = map(curveBrightness - 100, 0, height, 0, curveBrightness + 100);
var a = map(curveBrightness - 50, 0 , width, 0, curveBrightness + 50);
//adding curveBrightness with 50 for more detail
curveBrightness = curveBrightness + 50;
var b = a / curveBrightness;
//a small strokeWeight for clarity between curveBrightness
strokeWeight(0.05);
noFill();
//using the curveColor parameter
//adding red and blue to display the hypotrochoids as pink/red
stroke(curveColor + 200, 0, curveColor + 30);
//calling all the variables in a nested for loop to draw the hypotrochoid
beginShape();
// adding 5 extra points to close the hypotrochoid
for(var i = 0; i < pixelPoints + 5; i++) {
var t = map(i, 0, pixelPoints, 0, TWO_PI); {
x = (a-b) * cos(t) + h * cos(((a-b)/ b) * t)
y = (a-b) * sin(t) - h * sin(((a-b) / b) * t)
rotate(hypotrochoidsRotate);
//slight rotation implemented
hypotrochoidsRotate = hypotrochoidsRotate + 0.0001;
//scale of hypotrochoids set to normal
vertex(x, y);
}
}
endShape();
pop();
}
// using nested for loops to place replicate hypotrochoid into 16 hypotrochoids
function hypotrochoids(){
//translating hypotrochoids function to fit into the square screen
push();
translate(302, 185);
//4 in the width of the screen
for(var i = 0; i < 4; i++) {
//4 in the height of the screen
for(var t = 0; t < 4; t++) {
//locationofLoopi and LocationofLoopt space out the hypotrochoids
var locationofLoopi = i * SquareW/4 + 10;
var locationofLoopt = t * SquareW/4 + 10;
//getting the color of locationofLoopi and LocationofLoop 2
var colorLoop = get(locationofLoopi, locationofLoopt);
//getting the brightness of the colors
var sizeLoop = brightness(colorLoop);
rectMode(CENTER);
//implementing spacing into 16 hypotrochoids
drawCurve(locationofLoopi, locationofLoopt, sizeLoop + 20, sizeLoop + 20);
//pushing list into the arrays of location, color, and brightness of hypotrochoids
placeCurvesX.push(locationofLoopi);
placeCurvesY.push(locationofLoopt);
getColors.push(colorLoop);
getBrightness.push(sizeLoop);
}
}
//loop to call the length of the 16 points and implement the parameters from draw curve
for(var a = 0; a < locationofLoopi.length; a++) {
drawCurve(locationofLoopi[a], locationofLoopt[a], getColors[a], getBrightness[a]);
}
pop();
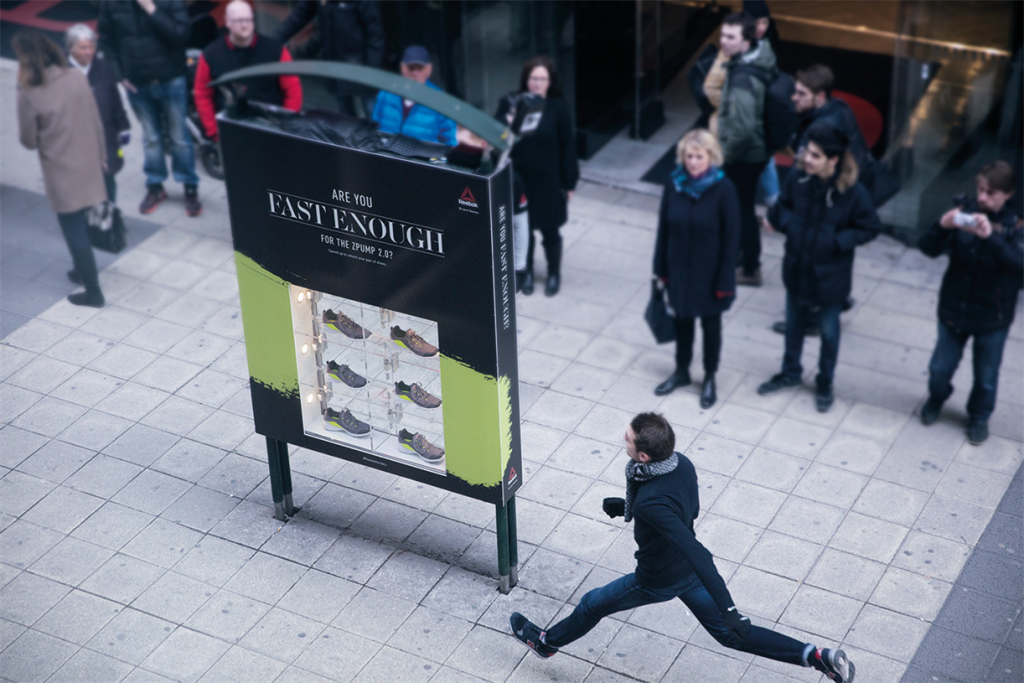
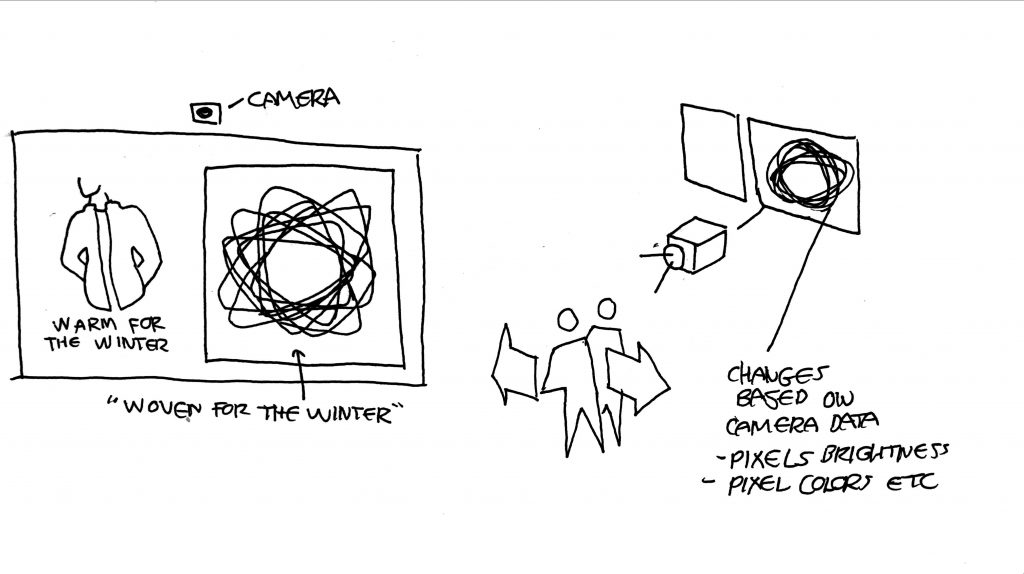
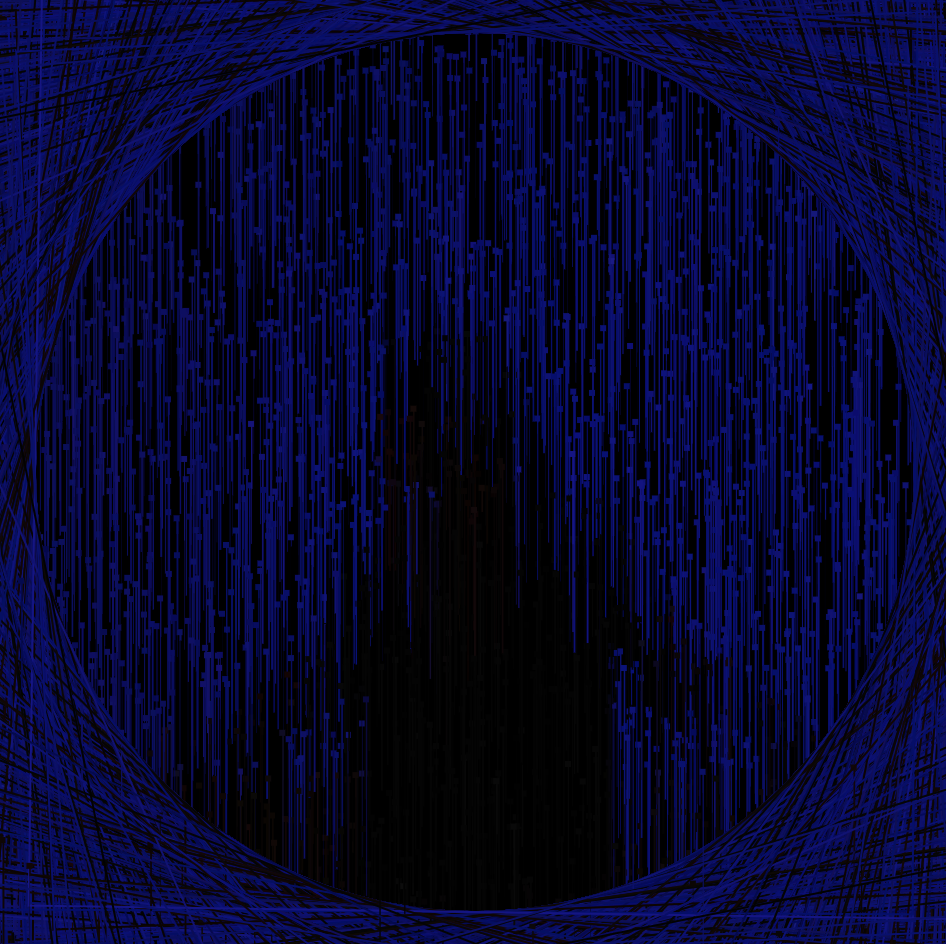
}For my final project, I wanted to explore the opportunities in which I can apply computational practices into a physical space. I decided to focus on creating a reactive storefront using a camera to show the movement of visitors in a visually intriguing way. To inspire a creative direction for the storefront, I created an Athletic Clothing brand called ové. Ové derives from the french word of l’oeuvre meaning work. Additionally, Ové is the shared characters of Move and Woven. To make the hypotrochoid curves reactive to the camera’s data, I used 16 specific points of pixel brightness and color. Through this, I create an interactive storefront that reacts to traffic and ultimately would entice people to enter the store.