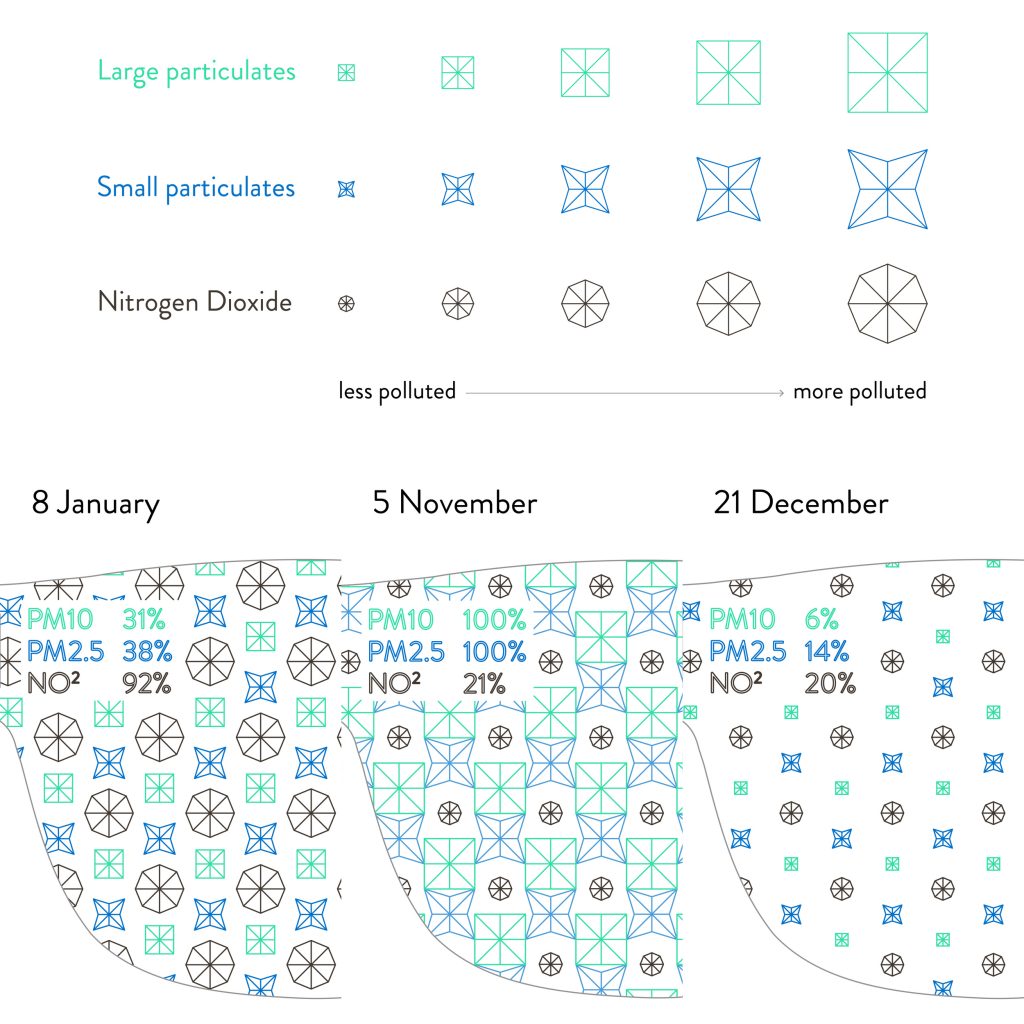
The glasses are the product to visualize the data on air quality. Pattern created through data provided by air quality sensors.
Air Transformed: Better with Data Society Commission is a project by Stefanie Posavec and Miriam Quick in 2015 to use data visualization techniques to communicate air quality. In this looking outwards post, I will be focusing on the aspect of this project called Seeing Air. These are physical acetate glasses that people wear to visualize large particles, small particles, and nitrogen dioxide in Sheffield, UK. These elements were assigned specific icons that are etched onto a layer of the lense. Data is provided through air quality sensors owned by the Sheffield City Council. Stefanie Posavec and Miriam Quick most likely created an algorithm that interprets the data and assigns the scale in which the patterned icons would be set. What I admire is how this data visualization piece is how immersive it is. One can view the designs when not worn but truly experience what it’s like to see out of metaphorical air quality. People may not understand how severe air quality is. Through visualizing this data, people can see the world through a lens that makes people aware of the importance of taking action on climate change.
// Yoshi Torralva
// yrt@andrew.cmu.edu
// Section E
// Project-07-Curves

// rotation variable speeds
var angle = -1;
var angle1 = -1;
var angle2 = -1;
function setup() {
    createCanvas(480, 480);
}
function draw() {
    // calling five hypotrochoids
    // from the same drawhypotrochoid function
    //upper left hypotrochoid
    background(210);
    push();
    rotate(angle2);
    angle2 = angle2 + 0.01;
    drawHypotrochoid();
    pop();
    //center hypotrochoid
    push();
    translate(width/2, height/2);
    rotate(angle1);
    angle1 = angle1 + 0.01;
    drawHypotrochoid();
    pop();
    //right hypotrochoid
    push();
    translate(480, 0);
    rotate(angle2);
    angle2 = angle2 + 0.01;
    drawHypotrochoid();
    pop();
    //bottom right hypotrochoid
    push();
    translate(480, 480);
    rotate(angle2);
    angle2 = angle2 - 0.02;
    drawHypotrochoid();
    pop();
    //bottom left hypotrochoid
    push();
    translate(0, 480);
    rotate(angle2);
    angle2 = angle2 - 0.02;
    drawHypotrochoid();
    pop();
}
// Hypotrochoid
function drawHypotrochoid(x, y) {
    //setting a, b, and h variables
    // radius
    a = map(mouseX, 0, width/6, 0, 50);
    // radius of rotating circle
    b = a / constrain(mouseY, 0, height);
    // starting height
    h = 100;
    points = 10000;
    push();
    beginShape();
    translate(0, 0);
    noFill();
    // variables to create shifting greyscale
    // depending on mouseX and mouseY positions
    var limitto255 = mouseX - 500;
    var limitto255y = mouseY - 450;
    stroke(0 + limitto255, 255 - limitto255y);
    // for loop to create multiple lines up to 10000
    for(var i = 0; i < points; i++) {
        // constrains on mouseX and Y on variables
        a = constrain(mouseX, 0, width);
        b = constrain(a/mouseY, 0, width);
        h = constrain(mouseY, 0, height);
        var t = map(i, 0, points, 0, TWO_PI);
        x = (a - b) * cos(t) + h * cos(((a + b)/ b) * t);
        y = (a - b) * sin(t) - h * sin(((a - b)/ b) * t);
        // half of original size
        strokeWeight(0.05);
        vertex(x/2,y/2);
    }
    endShape();
    pop();
}
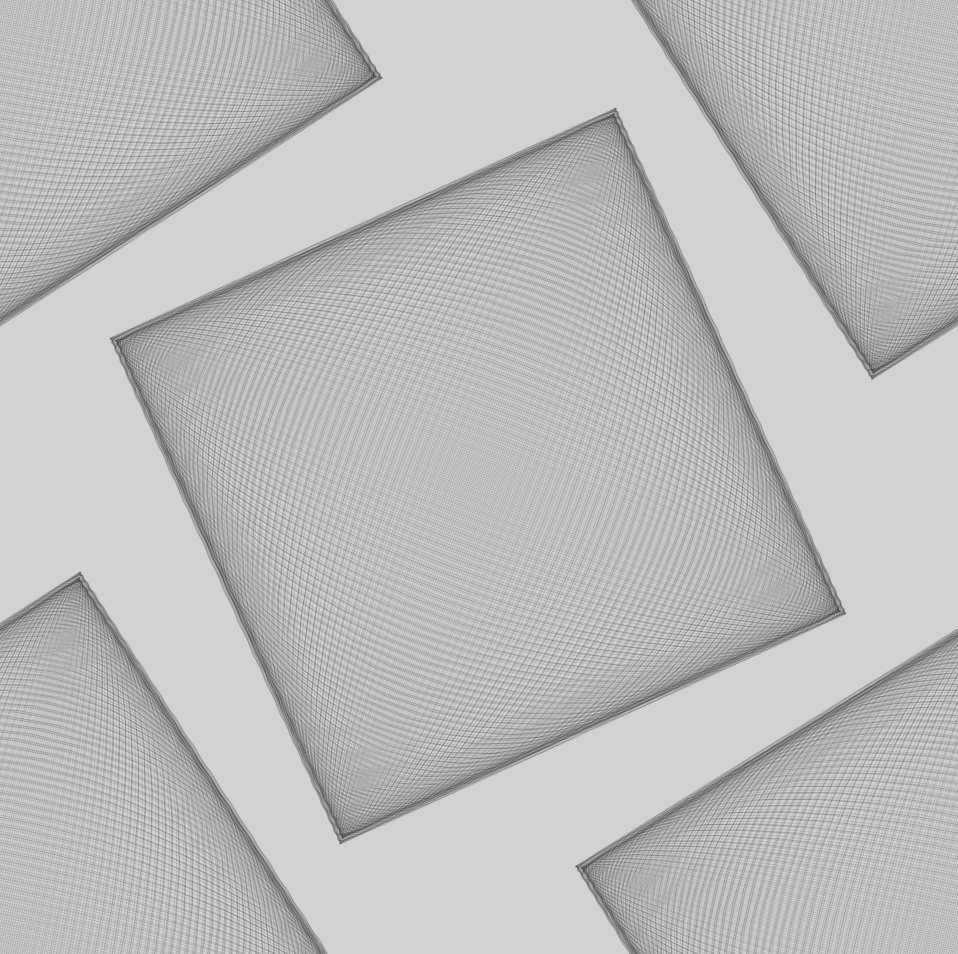
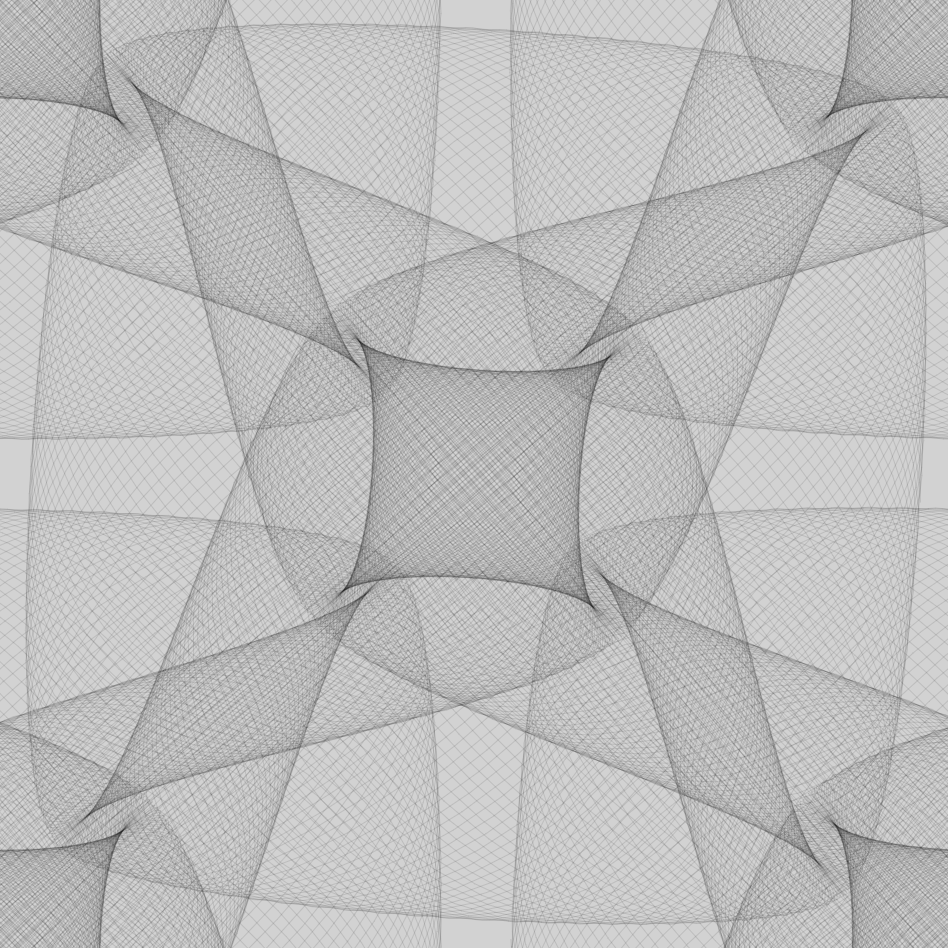
Circles visible at the top part of the canvas.Square forms when the mouse is as the left side of the canvasFive hypotrochoid curves intersect creating a dynamic form.
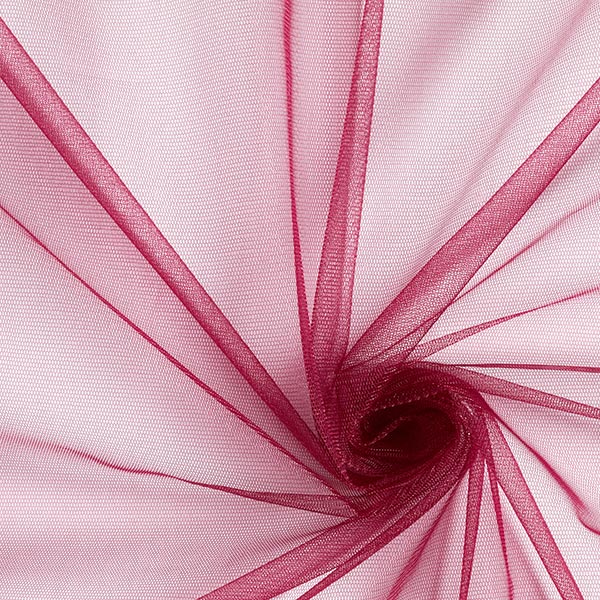
With this project, I was inspired to emulate the qualities of fabric like tulle and mesh. Using these mathematical curves afforded the opportunity to explore this. I decided to use the hypotrochoid curve as it offered the ability to create overlapping curves like the Guilloché Pattern. Going beyond my inspiration for fabric, I wanted to convey the feelings of hardness and softness. When the mouse is moved to the right, the hypotrochoids turn into squares. When the mouse is moved to the left, the hypotrochoids take a dynamic shape. I implemented rotation to allow for interactive intersections and organic forms to come to life. I chose to make this project at a greyscale as I wanted the viewers to focus to be on the form. Variations on the greyscale are achieved through mouse positioning.
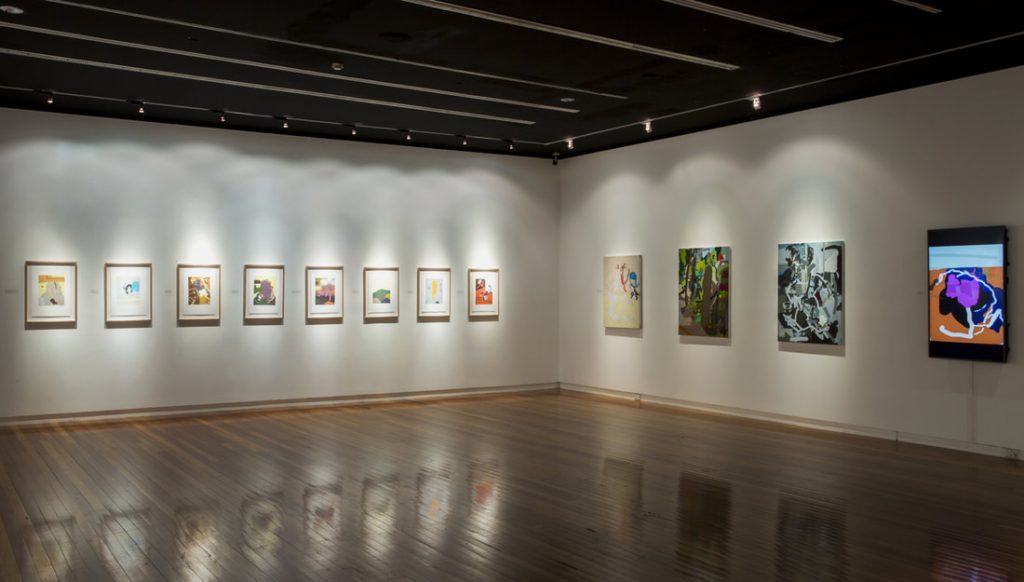
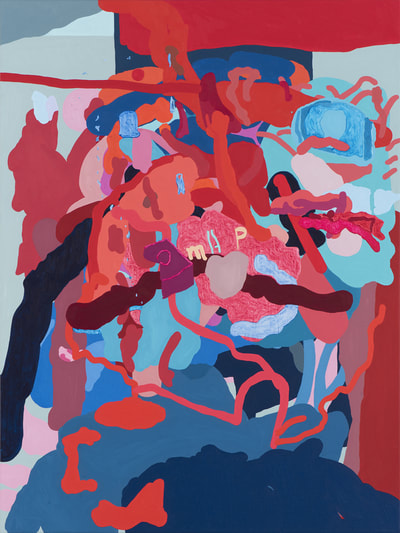
Tony Curran’s Random Feels Familiar in the Wagga Wagga Art GalleryArt titled: ‘Just not enough blue to hold it down’ in the exhibition
Random Feels Familiar by Tony Curran is a randomly generated series of art pieces on oil on linen. Created in 2017 and currently exhibited at the Wagga Wagga Art Gallery, art hangs on the wall encompassing the viewer in fine art that feels familiar but is quite different. Abstract designs hang on the wall are printed on canvas yet are, in reality, randomly generated by code. The art piece use texture and expressive techniques to confuse the viewer if it’s created by code or done by a human. What I admire about this series is how it blurs the lines between who has ownership of the painting. Although the computer uses pseudo-random generation, the foundation remains on the artist’s visual language.
// Yoshi Torralva
// yrt@andrew.cmu.edu
// Section E
// Project-06-Abstract Clock
function setup() {
    createCanvas(480, 480);
}
function draw() {
    background(255, 188, 0);
    var H = hour();
    var M = minute();
    var S = second();
    noStroke();
    //grass
    fill(0, 104, 47);
    rect(0,405,480, 75);
    // tree
    fill(107, 38, 0);
    rect(376,50, 63, 300);
    fill(5, 73, 39);
    ellipse(410, 50, 300, 300);
    //Sun for Hour
    fill(255, 211, 26);
    ellipse(125, 200, 200, 200);
    fill(249, 206, 0);
    ellipse(125, 200, H * 5, H * 5);
    // plants
    fill(5, 73, 39);
    rect(0,260,480, 145);
    //fence backing
    fill(173, 66, 11);
    rect(0,  280, 480, 20);
    rect(0,  350, 480, 20);
    //horizon line grass
    fill(7, 63, 31);
    rect(0,400,480, 10);

    //fence for loop
    for(var i = 0; i < 59; i++) {
            fill(173, 66, 11);
            rect(i * 8.2,  250, 7, 155);
            ellipse(i * 8.2 + 3.4, 250, 7, 7);
        }
    //filled in fence for variable M
    for(var i = 0; i < M; i++) {
            fill(137, 42, 0);
            rect(i * 8.2,  250, 7, 155);
            ellipse(i * 8.2 + 3.4, 250, 7, 7);
        }
    //calling dog into canvas
    dachshund(S * 1, 0);
    //clock in the tree
    fill(0, 104, 47);
    textSize(32);
    text(H, 300, 40);
    text(M, 320, 120);
    text(S, 390, 150);
}
//dog
function dachshund (x, y) {
    push();
    translate(x, y);
    //tail
    strokeWeight(5);
    stroke(5);
    line(46, 360, 20, 385);
    noStroke();
    fill(255);
    //body
    rect(50, 357, 80, 32);
    //back
    ellipse(50, 373, 32, 32);
    //chest
    ellipse(130, 373, 32, 32);
    //back leg
    rect(34, 370, 13, 35);
    //front leg
    rect(120, 370, 10, 35);
    //paws
    ellipse(130, 402, 6, 6);
    ellipse(47, 402, 6, 6);
    //black fur front chest
    fill(0);
    arc(130, 373, 32, 32, 3 * PI / 2, PI/2, CHORD);
    //ear
    fill(73, 33, 7);
    rect(130, 340, 16, 30);
    ellipse(138,370, 16, 16);
    //head
    fill(0);
    quad(145, 340, 180, 350, 175, 365, 145, 370);
    //eyes
    fill(255);
    ellipse(155,350,6, 6);
    fill(0);
    ellipse(156,349, 4, 4);
    //spots
    fill(0);
    arc(100, 357, 40, 40, 2 * PI, PI, CHORD);
    arc(70, 389, 30, 30, PI, 2 * PI, CHORD);
    ellipse(48,370, 15, 15);
    pop();
}
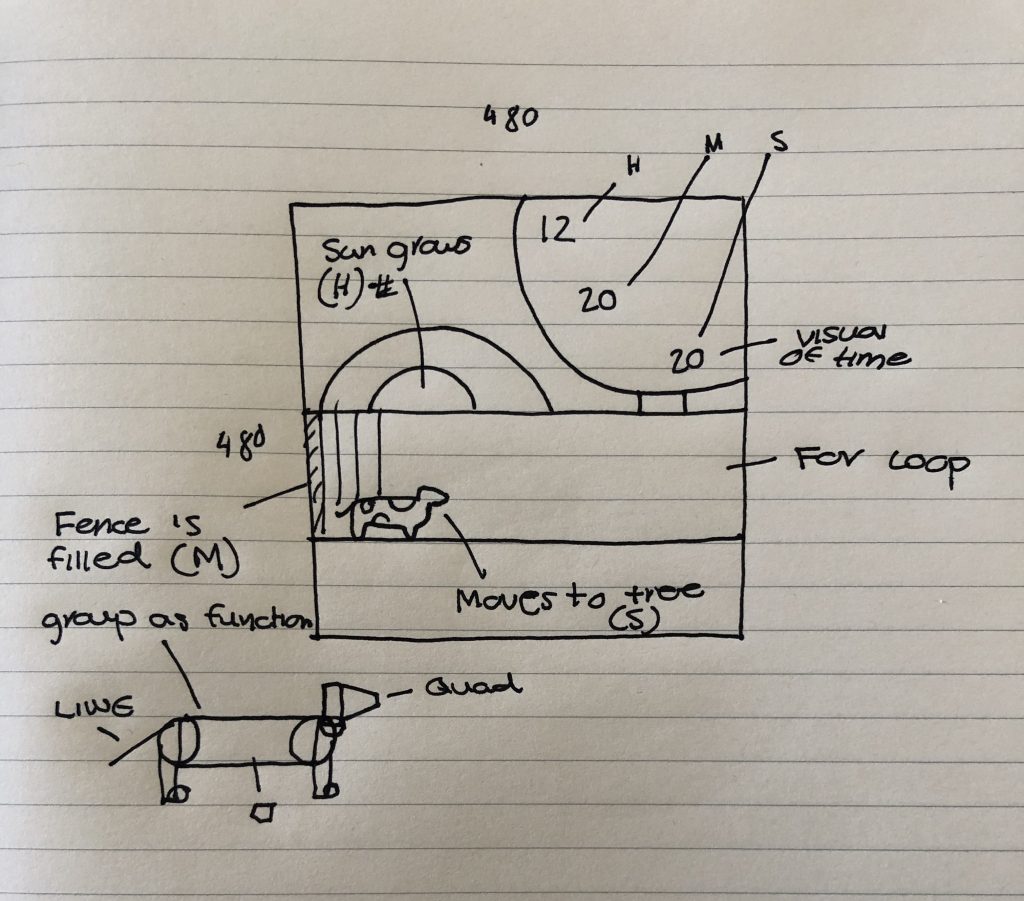
Initial Sketch
With this project, I wanted to create an abstract clock set in a scene with my dog. Planning was important before I could start making this scene with p5.js as I would need to know what shapes I would use to create my dog. In the sketch, I illustrate the shapes I will have to create. In my editor, I made my dog a function I could call to free up space in the function draw(). In terms of inserting time-based motion, the dog moves by seconds, the fence changes color to minutes, and the sun increases in size to hours. I used a loop to replicate the base fence and another for the minutes’ fence to fill in.
Onboarding process to generate 3d rock sculptures.
Building hopes is an augmented reality generative art experience that allows users to visualize their hopes for certain topics powered by Google Trends data. This project was created by Giorgia Lupi and her team at Accurat for Google in 2018. Based on personal hopes by selected by the user, the algorithm develops a 3D hope sculpture. The user selects different Google Trend data topics and is asked how important they feel about the topic. Digital rocks are auto-generated and vary in size and color depending on the user’s desired intensity on the topic. The artistic license by Lupi is reflected in bold rock colors and a simple white interface. What I admire about this project by Lupi is how it’s inspired by traditional balancing rock art. Through the use of generative 3d art, her team is able to humanize data trends rooted in tradition.
With this project, I wanted to create a pattern that had a cooking element to it as if the design could be placed on an apron. I choose to use a sunflower yellow color pallette for a pleasant tone. A coffee bean, straw, and cup are present.
A video showcasing Janet Cardiff’s process in creating The Forty Part Motet sound sculpture.
The Forty Part Motet fits within an emerging fine arts category — sound sculpture. Created by Janet Cardiff and first installed in 2001, the artist uses 40 speakers to create an experience that transports oneself into a choir. Each speaker only emits a single recording of a singer in the Salsbury Cathedral Choir. What this does is heighten the experience of being in the actual cathedral. Additionally, one can move around the speakers to have the feeling as if they were immersed in the choir floor. What I admire about this is that it uses technology in a way that is founded on creating a compelling human experience. Each speaker represents the individuality of the singular singer and allows for the opportunity for the viewer to partake in different listening experiences. A customized algorithm to channel the individual sound recordings to individual speakers most likely had to be used. Much explanation wasn’t provided on the technical aspects, but the program used most likely had to implement various channelings to different audio recordings and speaker inputs. What I find very interesting is that the artist focuses on the limitation of unnecessary visual elements to heighten the powerful voices within this installation.
Using string art, I wanted to create a shell-like formation. I used multiple lines in the for() statement to create a swirling visual. Mouse tracking was implemented to add depth as it served as a frame into the shell.
// Yoshi Torralva
// Section E
// yrt@andrew.cmu.edu
// Project 04
function setup() {
    createCanvas(300, 400);
}

function draw() {
    background(0, 191, 255);
    /* for loop making 40 lines
    which allows for 10px spacing */
    for(var i = 0; i < 40; i++) {
    /* mouseX and Mouse Y move the string art */
    strokeWeight(1);
    stroke(255);
    //moving string art
    line(mouseX, i * 10, 0 + i * 10, mouseY);
    // flipped mouseX and mouse Y to create opposite scaling
    line(mouseY, i * 10, 0 + i * 10, mouseX);
    strokeWeight(0.2);
    //string art starting at top x height
    // 10 px width between each line
    // increments of 50
    line(i * 10, 0, 300, 0 + i * 10);
    line(i * 10, 0, 250, 0 + i * 10);
    line(i * 10, 0, 200, 0 + i * 10);
    line(i * 10, 0, 150, 0 + i * 10);
    line(i * 10, 0, 100, 0 + i * 10);
    line(i * 10, 0, 50, 0 + i * 10);
    //string art at bottom x height
    // 10 px width between each line
    // increments of 50
    line(250, i * 10, 0 + i * 10, 400);
    line(200, i * 10, 0 + i * 10, 400);
    line(150, i * 10, 0 + i * 10, 400);
    line(100, i * 10, 0 + i * 10, 400);
    line(50, i * 10, 0 + i * 10, 400);
    }
}
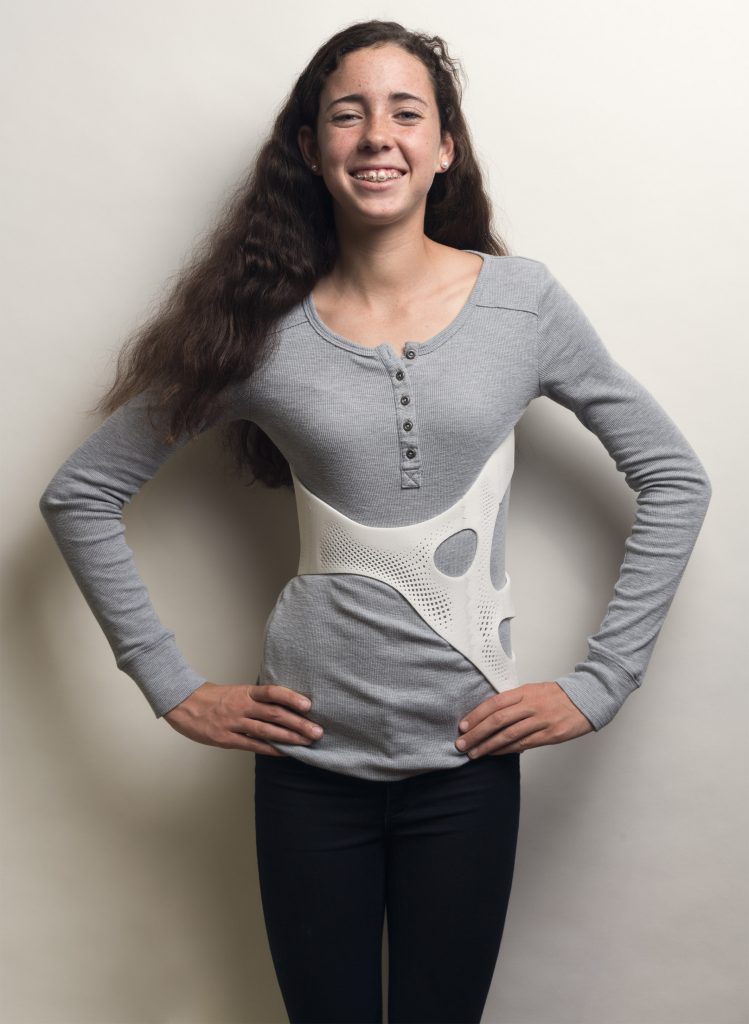
Braces for scoliosis have been adjustable to the user’s condition but never personable. Ultimetality this results in these braces to be uncomfortable when worn for long periods due to adjustable straps and locks. UNYQ Align solves the issue of discomfort using an algorithm that uses current measurement data and desires goals to assist in mitigating the health effects of scoliosis. What why admire about the brace is how the structure is slimmer yet as effective due to the computer-generated design. The UNYQ Align’s overall design language is similar to that of an organically formed structure. UNYQ is applying this method of auto-generating forms into casts and braces for different parts of the body. One note is that they don’t go into detail about if the brace treats scoliosis faster or at the same rate as similar braces.
A person wearing the UNYQ brace personalized to their medical needs.
// Yoshi Torralva
// Section E
// yrt@andrew.cmu.edu
// Project 03

var x = 40; //  x height of plaid
var y = 40; //  y height of plaid
var dx = 0; //diagonal var / width
var dy = 40; //diagonal var / height

function setup() {
    createCanvas(480, 640);
}
function draw() {
    background(mouseX, mouseY, 0); // changes color
//thread to the left and right
//conditional reactive to the mouse
if(mouseX > 0) {
    x = mouseX;
}
//conditional reactive to the mouse
if(mouseX < 200) {
    x = mouseX;
}
//conditional reactive to the mouse
if(mouseY > 0) {
    y = mouseY;
}
//conditional reactive to the mouse
if(mouseY < 200) {
    y = mouseY;
}
var bxscale = constrain(mouseX, 40, 100); // scale of ellipse
var byscale = constrain(mouseY, 40, 100); // scale of ellipse
// plaid banners — layered
    push();
    noStroke();
    fill(187, 0, 0);
    rect(0, 40, x, 40);
    fill(0, 136, 85);
    rect(160, 0, 40, y);
    fill(0, 136, 85);
    rect(40, 0, 40, y);
    fill(0, 136, 85);
    rect(160, 0, 40, y);
    fill(34, 68, 51);
    rect(100, 0, 40, y);
    fill(187, 0, 0);
    rect(0, 100, x, 40);
    fill(187, 0, 0);
    rect(0, 160, x, 40);
    fill(34, 68, 51);
    rect(100, 0, 40, y);
    fill(187, 0, 0);
    rect(0, 220, x, 40);
    fill(34, 68, 51);
    rect(220, 0, 40, y);
// thin gold layering
    fill(170, 102, 0);
    rect(0, 40, x, 10);
    fill(170, 102, 0);
    rect(40, 0, 10, y);
    pop();
// push and pop used for strokeWeight only
    push();
    stroke(color(255));
    strokeWeight(10);
    line(mouseX, mouseY, 0, 0); // top left line
    line(mouseX, mouseY, 480, 640); // bottom right line
    fill("white");
    ellipseMode(CENTER);
    noStroke();
    ellipse(mouseX, mouseY, bxscale, byscale); // ellipse that moves to mouseX/Y
    pop();
}
With this project, I wanted to use the interaction of the mouse to create a plaid pattern. The rectangles react to the mouse and the white lines serve as a visual guide to imply that the mouse is weaving the plaid together. The background alternates color and the cursor shifts scale diagonally.
![[OLD FALL 2019] 15-104 • Introduction to Computing for Creative Practice](../../../../wp-content/uploads/2020/08/stop-banner.png)