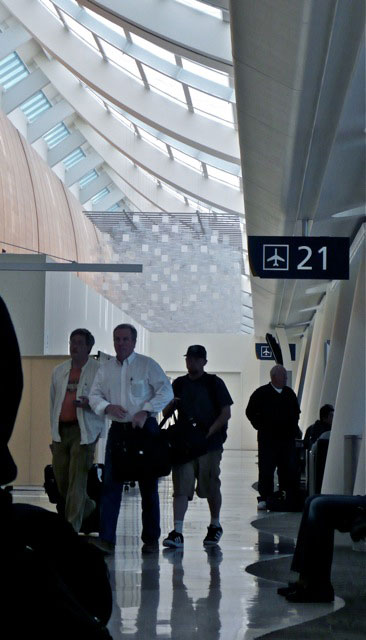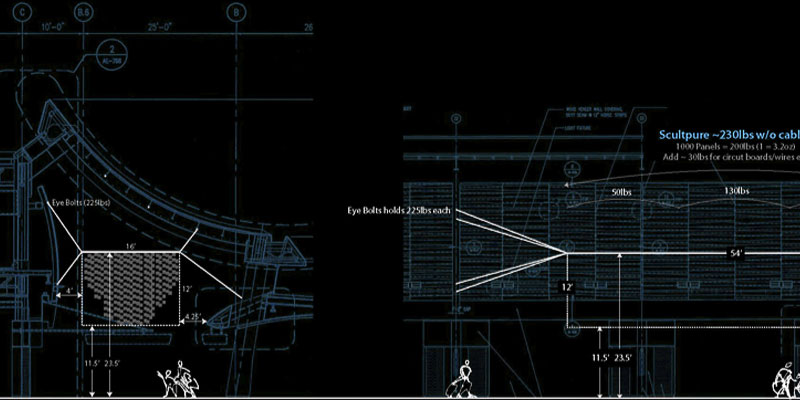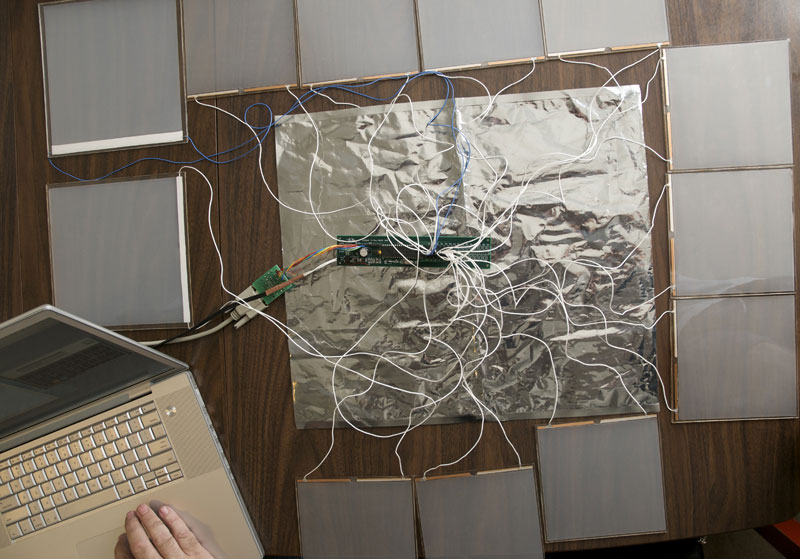


For this looking outwards post, I found Joseph Zhang’s looking outwards post on the eCloud for data visualization quite interesting. eCloud is a physical representation of weather conditions in the current location. On the side of the walkway, different computer-generated Created in 2010 and a permanent installment in the San Jose Airport, eClouds are generated from other sites on a screen. I want to add to Joseph’s comments on the eCoud to how this physical data-visualization of weather data improves the overall space. As a whole, the opaque tiles create a feeling of direction, leading people to move across the terminal. Additionally, I admire how unobtrusive it is to both allow people to take a glance at the screen to understand the meaning of the formation of tiles but also move quickly through space. At first, it looks as if there is no technology equipped to these tiles, but through live-imputed data, it slightly shifts from transparent to opaque.
![[OLD FALL 2019] 15-104 • Introduction to Computing for Creative Practice](wp-content/uploads/2020/08/stop-banner.png)