![[OLD FALL 2019] 15-104 • Introduction to Computing for Creative Practice](../../wp-content/uploads/2020/08/stop-banner.png)
For my final project I want to create a game where the user is stacking different types of cakes on top of each other. The cakes will be placed in random places on the screen as it is moving up (towards the sky) and the user will drag the cakes towards the center and start stacking them. The user is given a choice to pick what type of cakes to stack to create their own ultimate multi layered customized cake. However, if the dragged piece is offset by more than half of the length of the cake then the whole thing will topple over.
Author: claireyo@andrew.cmu.edu
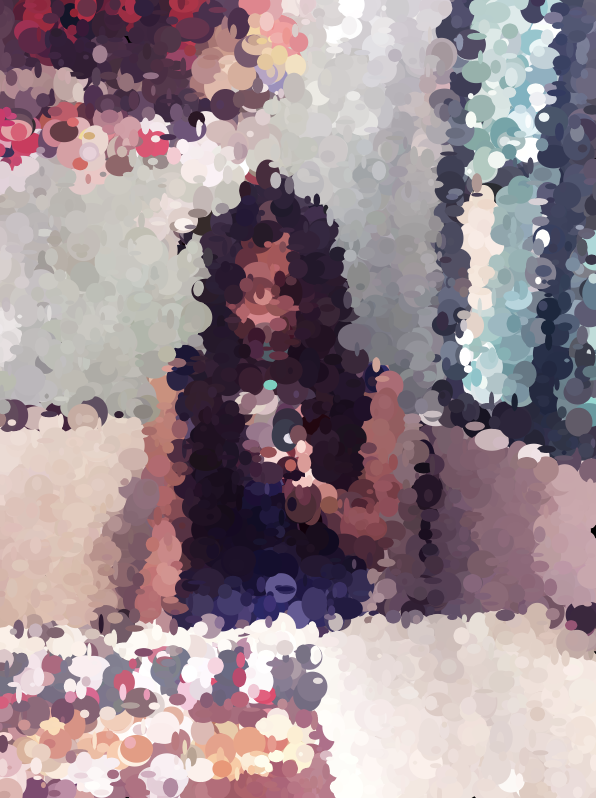
Claire Yoon Project 9
//Claire Yoon
//claireyo@andrew.cmu.edu
//Section E
//Project—09—Portrait

function preload() {
    var myImageURL = "https://i.imgur.com/Oo4KTUc.jpg";
    baseImage = loadImage(myImageURL);
}

function setup() {
    createCanvas(300, 400);
    background(0);
    baseImage.loadPixels();
    //rate at which the pixels appear
    frameRate(1000);
}

function draw() {
    var px = random(width);
    var py = random(height);
    var ix = constrain(floor(px), 0, width-1);
    var iy = constrain(floor(py), 0, height-1);
    // color at the current pixel
    var theColorAtLocationXY = baseImage.get(ix, iy);

    //draw ellipses at random sizes
    noStroke();
    fill(theColorAtLocationXY);
    //ellipses increase in size when mouse is pressed
    if (mouseIsPressed) {
        ellipse(px, py, random(10, 17), random(10, 17));
    //ellipses in more smaller sizes
    } else {
        ellipse(px, py, random(2, 10), random(2, 10));
    }
}
I enjoyed experimenting with the different sizes of the ellipses by randomizing the size and increasing the randomized size when clicking on the mouse.
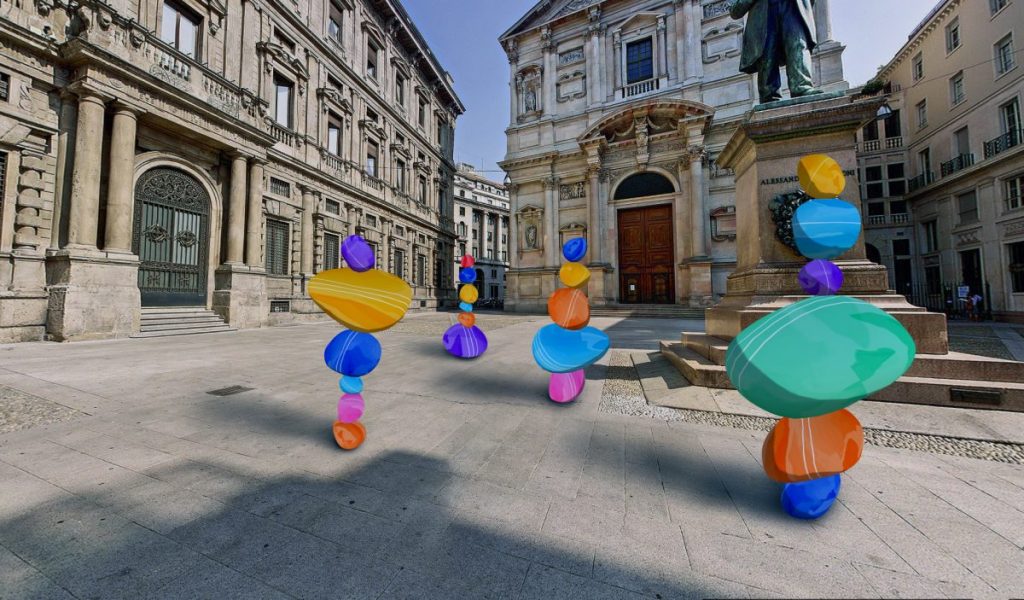
Looking Outwards 09
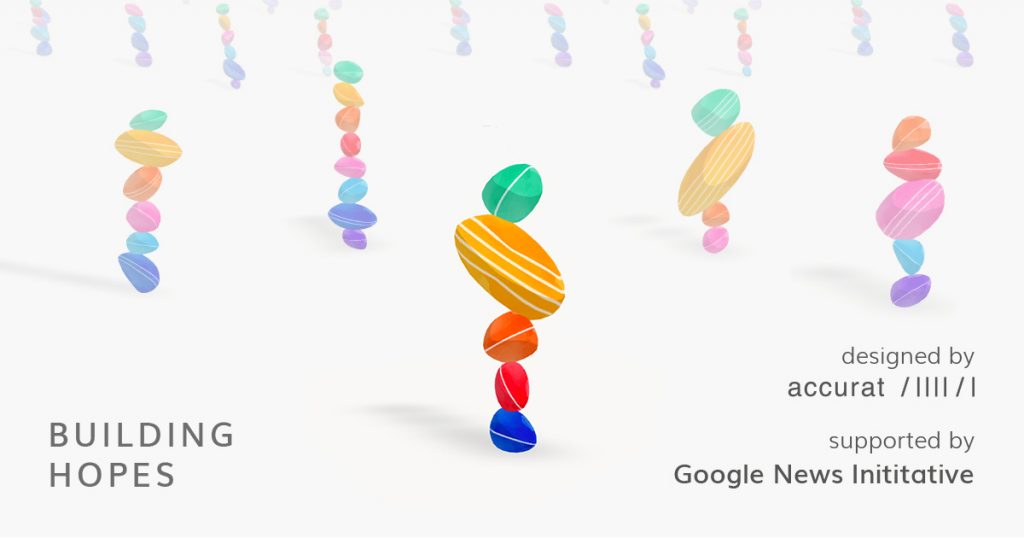
For this Looking Outwards post, I found Yoshi’s looking outwards-0 5 post really intriguing. This project is called Building hopes by Giorgia Lupi at Accurat for Google and it is an experimental AR app that is powered by Google trends data to explore the user’s hopes. It is interesting how each rock , which is digitally generated, represents a topic and varies in size and color depending on the user’s desired intensity. Then they are stacked to create a physical representation of the user’s hopes. Like Yoshi, I admire how it is inspired by traditional balancing rock art and how she is available to use generative 3d art to humanize data trends rooted in tradition. Additionally I like how this project incorporates a sense of physicality to hopes which are intangible to enhance a more natural interaction. This project reminds us that there are so many more ways to interpret data.
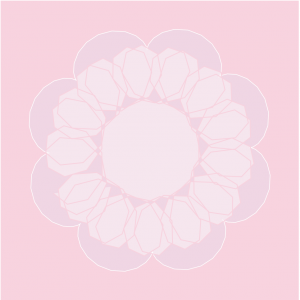
Claire Yoon-Project 7-Curves
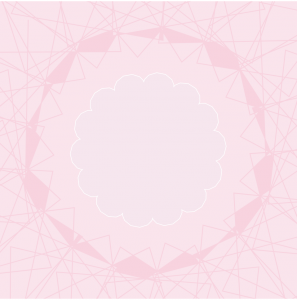
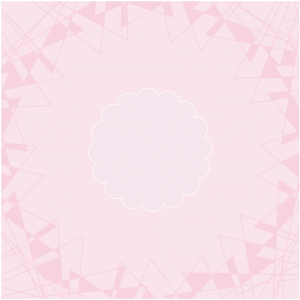
For this project, I played with how the different curve functions interacted and overlapped with each other. I made the rotation continuous to make it more visually dynamic.
Different forms:
/* Claire Yoon
   claireyo@andrew.cmu.edu
   Section E
   Project 7 */

// global variables
var nPoints = 200;
var angle = 0;
var rotateCount = 0
function setup() {
    createCanvas(480, 480);
    frameRate(20);
}

function draw() {
    background (255, 209, 224);
    // calling functions at middle of the canvas
    push();
    translate(width / 2, height / 2);
    // function continuously rotating
    rotate(radians(rotateCount));
    rotateCount++;
    drawHypocycloid();
    drawHypotrochoid();
    pop();


}
function drawHypotrochoid() {
    //setting variables for pale pink hypotrichoid
    var a1 = map(mouseX, 0, 450, 50, 240);
    var b1 = 10;
    var h1 = map(mouseX / 10, 0, 200, 0, height);

    //pale pink stroke
    fill(255, 255, 255, 100);
    stroke(255, 209, 224);
    strokeWeight(1.5);
    // for loop to draw hypotrochoid form
    beginShape();
    for(var i = 0; i < nPoints; i++) {
        // angle for hypotrochoid formula
        var angle1 = map(i, 0, 100, 0, TWO_PI);
        x = (a1 - b1) * cos(angle1) + h1 *  cos(((a1 - b1)/ b1) * angle1);
        y = (a1 - b1) * sin(angle1) - h1 * sin(((a1 - b1)/ b1) * angle1);
        vertex(x, y);
    }
        endShape();
}

function drawHypocycloid() {
    // setting variables for white astroid
    a2 = int(map(mouseX, 0, width, 240, 150));
    b2 = int(map(mouseX, 0, width, 8, 15));
    // pale pink with low opacity
    fill(189, 236, 255, 40);
    stroke("white");
    strokeWeight(1);

    beginShape();
    // for loop to draw hypocycloid form
    for (var i = 0; i < 200; i++){
        // angle for hypocycloid formula
        var angle2 = map(i, 0, 100, 0, TWO_PI);
        var x = a2 * ((b2 - 1) * cos(angle2) + cos((b2 - 1) * angle2)) / b2;
        var y = a2 * ((b2 - 1) * sin(angle2) + sin((b2 - 1) * angle2)) / b2;
        vertex(x, y);
    }
    endShape();
}
Looking Outwards-07-Claire Yoon
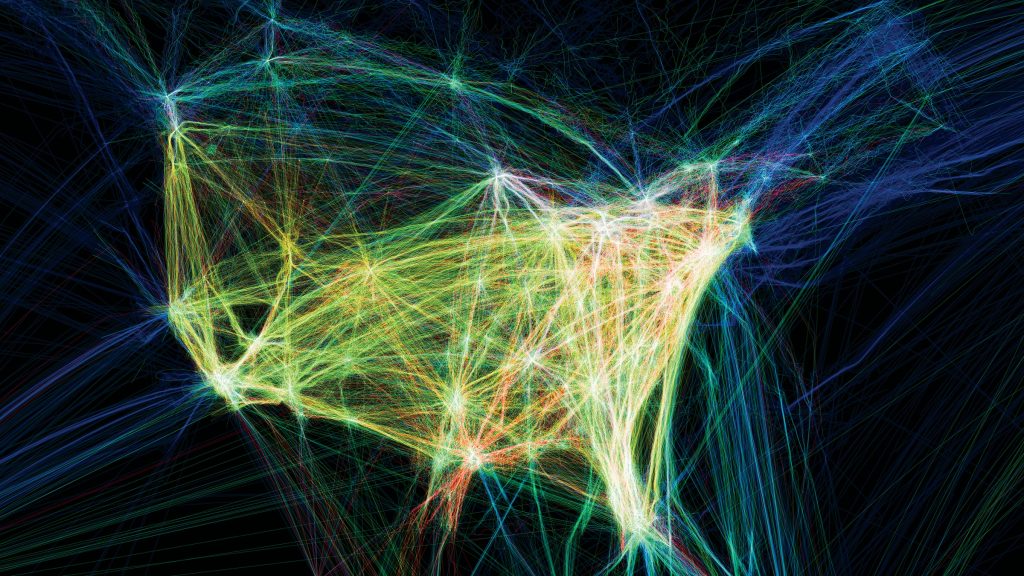
Flight patterns is a data visualization of airplane traffic that captures the rhythms and spatial patterns across North America over a 24- hour period. This project was created by Aaron Koblin who used data from the Federal Aviation Administration’s (FAA), which tracks 140,000 planes a day. He then used processing to plot where each plane went and used after effects and Maya.
The various colors and patterns are coded to show a wide range fo data such as type of aircraft, alterations to routes, weather systems and no fly zones. Also, the airline hubs appear as bright points of diffusion inside a complex web. I found this project particularly intriguing because this project’s use of aggregated data is visually pleasing as well as represents a relationship between humans and technology.
This was originally part of
Flight paths from FAA data drawn algorithmically and colored based on airplane model
Claire Yoon – Project 06 – Abstract clock
/* Claire
   Section E
   claireyo@andrew.cmu.edu
   Project-06-Abstract-Clock*/

function setup() {
    createCanvas(400, 400);
    noStroke();
}
function draw() {
    background(166, 243, 247);
    noStroke();

//Fetch the current time
    var H = hour();
    var M = minute();
    var S = second();

// mapping time variables
    var shadowcolor = map(H, 0, 8, 0, 37, 0, 44)
    var creamfall = map(M, 0, 6, 0, 7);

//shadow gets darker with hours
    var shadow = color(166 - shadowcolor, 243 - shadowcolor, 247 - shadowcolor);
    fill(shadow);
    noStroke();
    quad(145, 272, 229, 77, 501, 328, 339, 473);

//Popsicle part that does not move
    noStroke();
    //popsicle stick
    fill(239, 198, 142);
    rect(190, 247, 22, 108, 30);
    //popsicle
    fill(252, 234, 68);
    rect(144, 115, 111, 171, 20);
    //dent on popsicle
    fill(239, 220, 43);
    rect(168, 120, 22, 134, 10);
    rect(212, 120, 22, 134, 10);
    //cream
    fill(250, 120,119);
    ellipse(199.5, 125, 112, 112);

//cream that is falling with minutes
    rect(144, 121, 28, 90 + creamfall, 14);
    rect(156, 121, 50, 68 + creamfall, 23);
    rect(197, 121, 43, 94 + creamfall, 21.5);
    rect(236, 121, 20, 106 + creamfall, 10);

//drooling drops that falls down every second
    push();
    translate(249, 213);
    fill(250, 120,119);
    s = (millis()) % 800;
    s = map(s, 0, 800, 0, 213);
    ellipse(0, s, 10, 12);
    pop();

//sun
    fill(255, 224, 0);
    ellipse(29, 6, 191, 191);

// Time
    fill(255);
    text(H + ":" + M + ":" + S, 40, 50);

   }
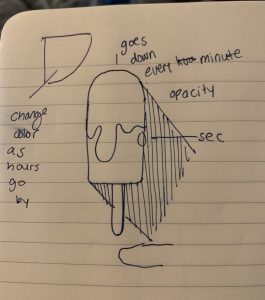
I enjoyed this project and the concept of creating an graphic art piece that evolves around time. I based my clock on how a popsicle drips and melts as time goes by.
Claire Yoon – Looking Outwards – 06
This art piece by Vladimir Kanic, a transmedia artist filmmaker, is part of a series of artwork that incorporates chaos theory and randomness to create structured art. Vladimir created a process that alters the film to create itself from spontaneous occurrences in everyday material world. He devised a concept called ‘Magic box ‘ where twelve boxes are given to different art directors and they put in a random number of objects. A group of random people would then procede to put them in a stash and the artist would create a film by observing and measuring randomness from the objects from any one of the boxes. I found this piece particularly interesting as a unique piece of art is created through measuring randomness through a random model system of chaos.
Claire Yoon -Looking Outwards 05 – 3D Computer Graphics
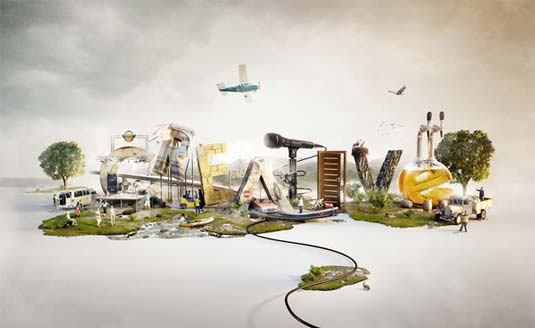
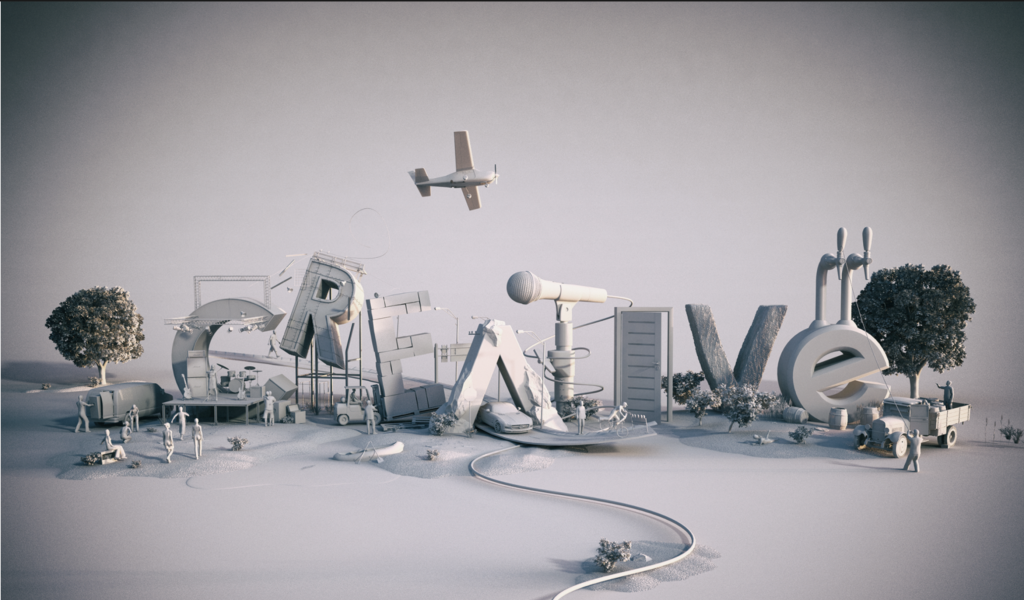
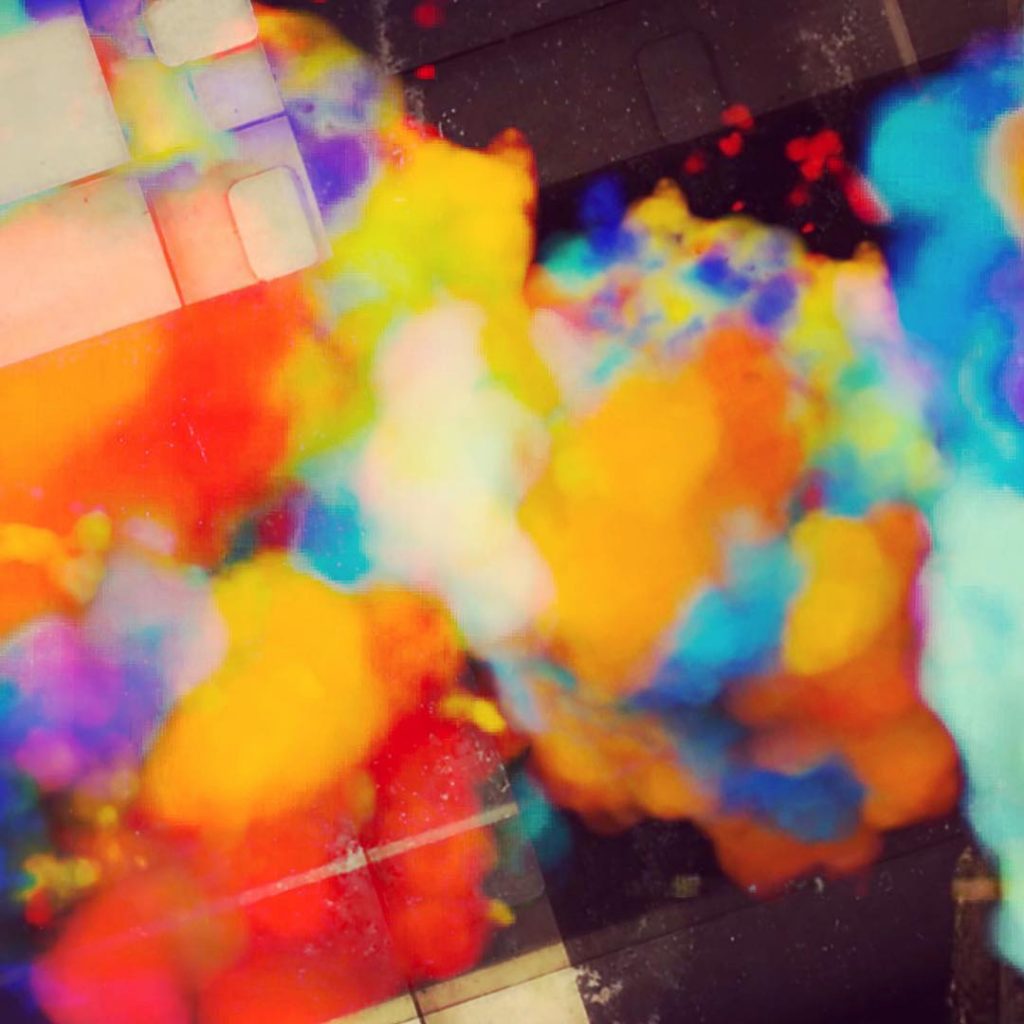
From the start the concept of this art piece by Jan Reeh really intrigued me because of the mix of objects and objects shaped as letters. This image explains the word “creative” in a literal way. Close up there are objects surrounding the each letter and people interacting it and seems to tell a story.
Watching the video of the color helps me further understand the author’s intention of explaining the word in a literal way. As the colors slowly fills the page it mimics the way one would read a word and gives “life” to the word as the objects surrounding it move as well. This work was created was made in 3ds max and rendered in Vray.
Claire Yoon-Project 05 -Wallpaper
It was fun to experiment with different shapes and lines and I got inspiration from the scaling on the turtle’s shell and further gave dimension by adding a gradient.
/* Claire Yoon
   claireyo@andrew.cmu.edu
   Section E
   Wall Paper */
    var pu;
    var pi;

    function setup() {
      createCanvas(640, 600);
      background(140,171,190);
      //gradient for lines
      pu = color(164, 168, 209);
      pi = color(187, 160, 178);
      setGradient(pu, pi);
    }
    function draw() {
      //vertical loop for pattern y
      for(var y = 20; y <= height; y += 50){
        //horizontal loop for pattern x
        for(var x = 20; x <= width; x += 50){
          //call pattern
          pattern (x,y);
        }
      }
      noLoop()
    }
    function pattern(x, y) {
      fill(209,242,255);
      strokeWeight(0);
      rect(x, y, 20, 20);

      noFill();
      stroke(194, 85, 100);
      strokeWeight(1.5);
      line(0, y - 15, width, y - 15);
      line(x - 15, 0, x - 15, height);
    }
    function setGradient(pu,pi) {
      //gradient for the background
      noFill();
      strokeWeight(1.5);
      for (var c = 0; c < height; c++ ) {
      var blend = map(c, 0, height, 0, 1)
      var m = lerpColor(pu, pi, blend);
      stroke(m);
      line(0, c, width, c);
    }
  }


//187,160,178
// stroke(164, 191, 235);
// strokeWeight(1);
Claire Yoon-String Art-Project 4
/*Claire Yoon
  Section E
  claireyo@andrew.cmu.edu
  Project4
  */

function setup() {
    createCanvas(400, 300);
    strokeWeight(0.75)
}

function draw() {
    background(158,219,229,);
    for (var i = 0; i < 40; i ++) {
    stroke(255);
    strokeWeight(0.75);
    // white lines moving in a diamond shape
    line(i * 10, mouseY, width / 2, height);
    line(width / 2, 0, i * 10, mouseY);
  }
    //yellow lines
    for (var i = 0; i < 400; i += 10){
    stroke("yellow");
    strokeWeight(0.75);
    // bottom right curve
    line(mouseX, 250 - i, i / 2, height/ 2);
    strokeWeight(0.75);
    // bottom left curve
    line(0, i / 2, 400 - i, mouseY);
    strokeWeight(0.75);

    // horizontal lines
    stroke("white")
    strokeWeight (1.5);
    line(mouseX, 300 - i, 200, height - i);
  }
}
Compared to the other projects, I found that I was a lot more intuitive with this piece and went through a more trial and error process in order to show visual harmony between the lines.