/* Claire Yoon
   claireyo@andrew.cmu.edu
   Section E
   Project 7 */

// global variables
var nPoints = 200;
var angle = 0;
var rotateCount = 0
function setup() {
    createCanvas(480, 480);
    frameRate(20);
}

function draw() {
    background (255, 209, 224);
    // calling functions at middle of the canvas
    push();
    translate(width / 2, height / 2);
    // function continuously rotating
    rotate(radians(rotateCount));
    rotateCount++;
    drawHypocycloid();
    drawHypotrochoid();
    pop();


}
function drawHypotrochoid() {
    //setting variables for pale pink hypotrichoid
    var a1 = map(mouseX, 0, 450, 50, 240);
    var b1 = 10;
    var h1 = map(mouseX / 10, 0, 200, 0, height);

    //pale pink stroke
    fill(255, 255, 255, 100);
    stroke(255, 209, 224);
    strokeWeight(1.5);
    // for loop to draw hypotrochoid form
    beginShape();
    for(var i = 0; i < nPoints; i++) {
        // angle for hypotrochoid formula
        var angle1 = map(i, 0, 100, 0, TWO_PI);
        x = (a1 - b1) * cos(angle1) + h1 *  cos(((a1 - b1)/ b1) * angle1);
        y = (a1 - b1) * sin(angle1) - h1 * sin(((a1 - b1)/ b1) * angle1);
        vertex(x, y);
    }
        endShape();
}

function drawHypocycloid() {
    // setting variables for white astroid
    a2 = int(map(mouseX, 0, width, 240, 150));
    b2 = int(map(mouseX, 0, width, 8, 15));
    // pale pink with low opacity
    fill(189, 236, 255, 40);
    stroke("white");
    strokeWeight(1);

    beginShape();
    // for loop to draw hypocycloid form
    for (var i = 0; i < 200; i++){
        // angle for hypocycloid formula
        var angle2 = map(i, 0, 100, 0, TWO_PI);
        var x = a2 * ((b2 - 1) * cos(angle2) + cos((b2 - 1) * angle2)) / b2;
        var y = a2 * ((b2 - 1) * sin(angle2) + sin((b2 - 1) * angle2)) / b2;
        vertex(x, y);
    }
    endShape();
}
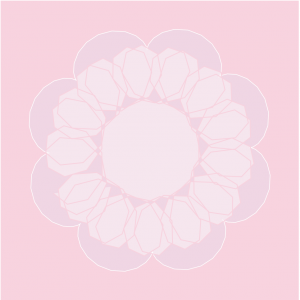
For this project, I played with how the different curve functions interacted and overlapped with each other. I made the rotation continuous to make it more visually dynamic.
Different forms:


![[OLD FALL 2019] 15-104 • Introduction to Computing for Creative Practice](wp-content/uploads/2020/08/stop-banner.png)