LO_07_Data Visualization

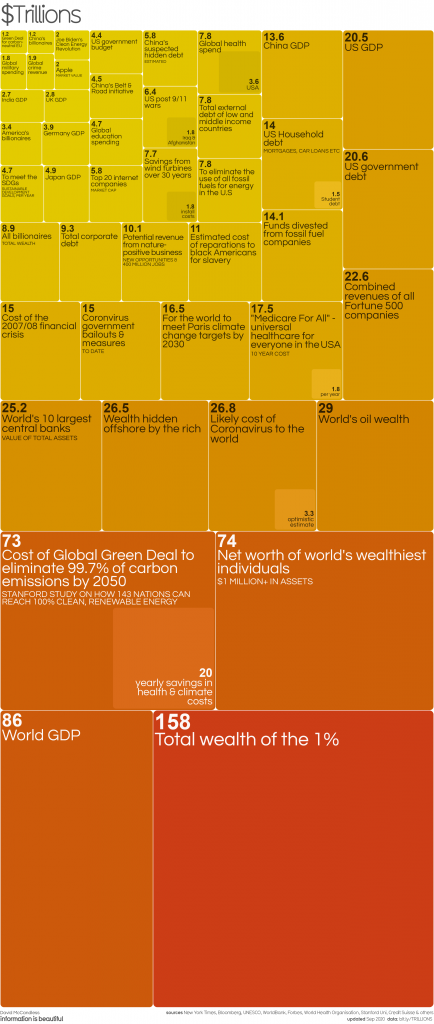
For this week’s topic, I looked at a chart relating to money- Trillions.

The author is David Macandless, and the source are from New York Times, Bloomberg, UNESCO,WorldBank,Forbes,World Health Organisation, Stanford Uni, Credit Suisse, etc.

Money is a very interesting topic but when the number gets huge, it is very hard to get a real feeling of the amount.

https://informationisbeautiful.net/visualizations/trillions-what-is-a-trillion-dollars/

In this chart, the author raised some very interesting(or not that interesting) topics about what money can do.

By comparing the size of different squares, it is easier to get the idea of how large a concept means or how much money to get one thing to be done.

Among all the topics and comparisons the author can make, those topics shown on the chart silently describe the author’s opinions about some social topics.Also the author secretly implies his/her opinion by gradually changing colors.

I think by visualizing data and deliberately representing data in a certain way, people are easier to get influenced because they tend to think data is object numbers.

Project-07

sketch
//Diana McLaughlin, dmclaugh@andrew.cmu.edu, Section A
//a code that experiments with epicycloids and hypotrochoids

var nPoints = 500;
var theta = 0;

function setup() {
    createCanvas(480, 480);

}

function draw() {
	var g = map(mouseX, 0, 480, 0, 160);
	var b = map(mouseX, 0, 480, 75, 255);
    background(0, g, b); //shades of blue

    for(var y = 0; y <= 480; y += 100) { //draw the vertical yellow epicycloids
    	push();
    	translate(0, y);
    	Epicycloid2();
    	pop();
    	push();
    	translate(480, y);
    	Epicycloid2();
    	pop();
    }

    for (var x = 20; x <= 480; x += 100) {
    	    push(); //top row, yellow epicycloids
    	    translate(x, 0);
    	    Epicycloid2(); 
    	    pop();
            push(); //second row, pink hypotrochoids
            translate(x, 120);
            Hypotrochoid1();
            pop();
            push(); // middle row, purple epicycloids
    	    translate(x, 240);
    	    Epicycloid1();
    	    pop();
            push(); //fourth row, green hypotrochoids
            translate(x, 360);
            Hypotrochoid2();
            pop();
            push(); //bottom row, yellow epicycloids
            translate(x, 480);
            Epicycloid2();
            pop();

    }

    
}

function Epicycloid1() { //purple epicycloid
    var a = map(mouseX, 0, 480, 0, 70); //inner radius
    var b = map(mouseY, 0, 480, 0, 20); //outter radius

    strokeWeight(1);
    stroke(255, 128, 255); //light purple
    noFill();
    beginShape();
    for (var i = 0; i < nPoints; i++) {
        var theta = map(i, 0, 125, 0, TWO_PI);
        x = (a+b) * cos(theta) - b * cos(((a+b)/b) * theta);
        y = (a+b) * sin(theta) - b * sin(((a+b)/b) * theta);
        vertex(x, y);
    }
    endShape();
}

function Epicycloid2() { //yellow, epicycloid, used for the border
    var a = map(mouseX, 0, 480, 0, 30); //inner radius
    var b = map(mouseY, 0, 480, 0, 20); //outter radius

    strokeWeight(0.75);
    stroke(255, 255, 0); //yellow
    noFill();
    beginShape();
    for (var i=0; i<nPoints; i++) {
        var theta = map(i, 0, 45, 0, TWO_PI);
        x = (a+b) * cos(theta) - b * cos(((a+b)/b) * theta);
        y = (a+b) * sin(theta) - b * sin(((a+b)/b) * theta);
        vertex(x, y);
    }
    endShape();
}


function Hypotrochoid1() { //pink hypotrochoid
    var a = map(mouseX, 0, 480, 0, 125); //outter radius
    var b = map(mouseY, 0, 480, 0, 50); //inner radius
    var h = map(mouseX, 0, 480, 0, 60); // tracing distance from center of inner circle

    strokeWeight(1);
    stroke(255, 128, 200); //pink
    noFill();
    beginShape();
    for (var i=0; i<nPoints; i++) {
        var theta = map(i, 0, 120, 0, TWO_PI);
        x = (a-b) * cos(theta) + h * cos(((a-b)/b) * theta);
        y = (a-b) * sin(theta) - h * sin(((a-b)/b) * theta);
        vertex(x, y);
    }
    endShape();
}

function Hypotrochoid2() { //green hypotrochoid
    var a = map(mouseX, 0, 480, 0, 100); //outter radius
    var b = map(mouseY, 0, 480, 0, 40); //inner radius
    var h = map(mouseY, 0, 480, 0, 60); //tracing distance from center of inner circle

    strokeWeight(1);
    stroke(0, 255, 0);
    noFill();
    beginShape();
    for (var i=0; i<nPoints; i++) {
        var theta = map(i, 0, 120, 0, TWO_PI);
        x = (a-b) * cos(theta) + h * cos(((a-b)/b) * theta);
        y = (a-b) * sin(theta) - h * sin(((a-b)/b) * theta);
        vertex(x, y);
    }
    endShape();
}

I made this as a way to mess around with hypotrochoids and epicycloids. It took awhile to figure out the math and variables, but once I did, it was fun to play around with. The top pink row is my favorite.
Project 07: Composition with Curves

My process to create this project began with doing research on various geometric curves. Once I found the Conchoid of de Sluze, I found that it had this unique directional quality and, if translated to the middle of the canvas, neatly divided it in half. After making the curve flip based on the x-position of the mouse, I decided to make the bulge of the curve responsive to the y-position of the mouse. Then, I would draw another curve ( a cardiod cartacaustic) with a flashing background in the half of the canvas the Conchoid of de Sluze was not occupying. In this way, the Conchoid of de Sluze was acting as a revealing element. Afterwards, to add some visual interest, I added a random function to the vertexes of each curve to create a jittery animated effect.

Project 7 – CurvesDownload


function setup() {
    createCanvas(480, 480);
    background(220);
    text("p5.js vers 0.9.0 test.", 10, 15);
}

function draw() {
	background(0);
	if (mouseX >= width/2){
		noStroke();
		fill(random(200,255),random(100,255),0);
		rect(0,0,width/2,height);
		push();
		translate(width/4,height/2);
		//rotate(radians(45));
		cardioidCatacaustic();
		pop();
	} else {
		noStroke();
		fill(random(100,255),0,random(200,255));
		rect(width/2,0,width/2,height);
		push();
		translate(3*width/4,height/2);
		rotate(radians(180));
		cardioidCatacaustic();
		pop();
	}
	push();
	translate(width/2,height/2);
	conchoid();
	pop();
}

function conchoid() {
	//https://mathworld.wolfram.com/ConchoidofdeSluze.html
	var x;
	var y;
	var r;
	var a = constrain(mouseY,10,240);
	fill("red");
	beginShape();
	for(var i = 0; i < 200; i++){
		var t = map(i,0,200,-PI,3*PI);
		if(mouseX <= width/2){
			r = -(1/cos(t) + a*cos(t));
		} else{
			r = (1/cos(t) + a*cos(t));
		}
		x = r*cos(t);
		y = r*sin(t);
		vertex(x + random(-2,2),y + random(-2,2));
	}
	endShape();
}

function cardioidCatacaustic() {
	https://mathworld.wolfram.com/CardioidCatacaustic.html
	var x;
	var y;
	var xe;
	var ye;
	var strokeVal =.2;
	var a = 60;
	noFill();
	stroke(0);
	strokeWeight(strokeVal);
	beginShape();
	for(var i = 0; i < 200; i++){
		var t = map(i,0,200,-PI,PI);
		x = a*(1 + cos(t))*cos(t);
		y = -a*(1 + cos(t))*sin(t);
		vertex(x + random(-2,2),y + random(-2,2));
	}
	endShape(CLOSE);
}

Looking Outwards 07: Information Visualization

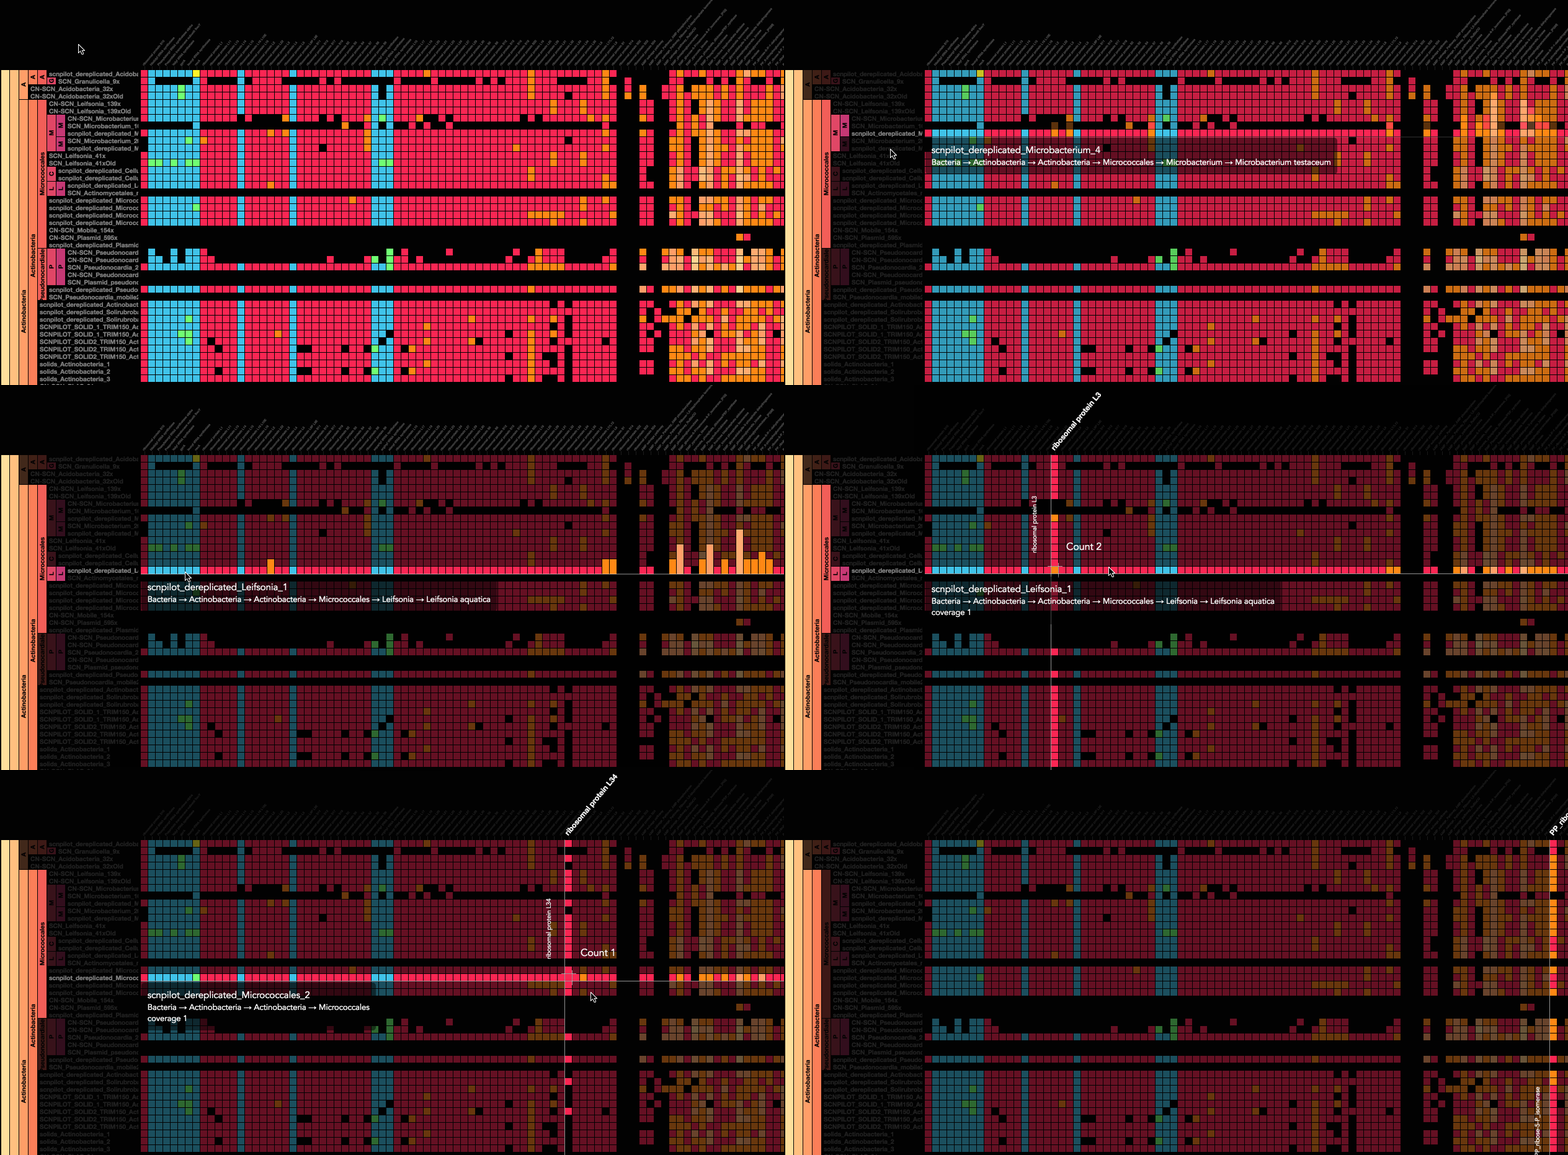
A work of computational information visualization that I find intriguing is Stamen Design’s “Metagenomics with the Banfield Lab.” This project came about when the Banfield Lab asked Stamen Design to visualize their data about gene sequences in an ecosystem. I admire the clarity of the visual result because it takes what would normally be considered complex data and arranges it in a way that is easy to access and read. I suppose that the artwork was generated by sorting the data into a matrix and visualizing the data as squares. Stamen Design’s artistic sensibilities are manifested in the final form because they created a clear and readable visualization of data while being visually interesting.

Gif of Stamen Design’s “Metagenomics with the Banfield Lab”

Project 7

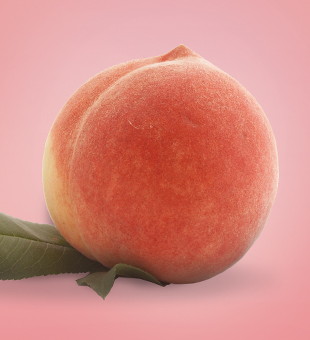
After exploring the variety of equations on the MathWorld site, I decided to use a heart curve to create peaches. My peaches are inspired by Japanese peaches, and they change color and size based on mouseX.

peaches
Japanese peach
function setup() {
    createCanvas(480, 480);
}

function draw() {
    background(150, 240, 210); //mint background
    //4 peaches
    for (var x = 140; x <= width; x += 200) {
        for (var y = 140;y <= height; y+= 200) {
        push();
        leaf(x, y);
        pop();
        push();
        translate(x, y);
        peach();
        pop();
        }
    }
}
function leaf(x, y){
    push();
    stroke(35, 153, 139);
    strokeWeight(2);
    strokeCap(SQUARE);
    fill(50, 200, 180);
    arc(x+15, y+15, 70, 40, PI/4, PI + PI/3, OPEN);
      //arc(width/220 - 25, height/2, 40, 40, PI-PI/3, , OPEN);
    pop();
  
}
function peach(){
    var colorshift = constrain(mouseX, 5, 50);
    fill(255, 180- colorshift/4, 120+colorshift/2);// peach become redder based on mouseX
    stroke(250, 250, 250); //offwhite outline
    scale(2.5);//no need to rotate peach shape
    beginShape();
    for (var i = 0; i < 2*PI; i+=0.1) {
        var mx = constrain(mouseX/300, 0.7, 1.2); //mouseX multiplier
        var x = mx*20*pow(sin(i),3);
        var y = mx*20*cos(i)-4*cos(2*i)-2*cos(3*i);
        vertex(x,y); 
    }
    endShape();
}

LO 7

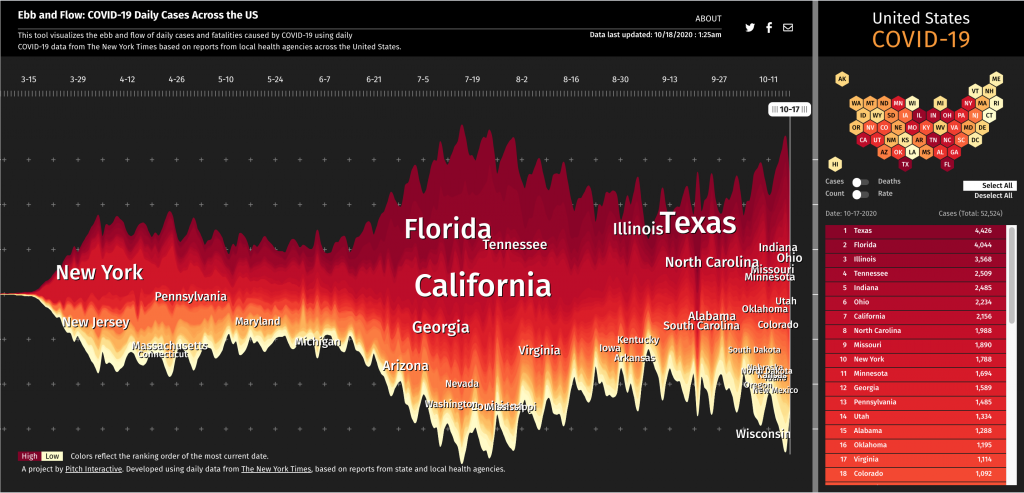
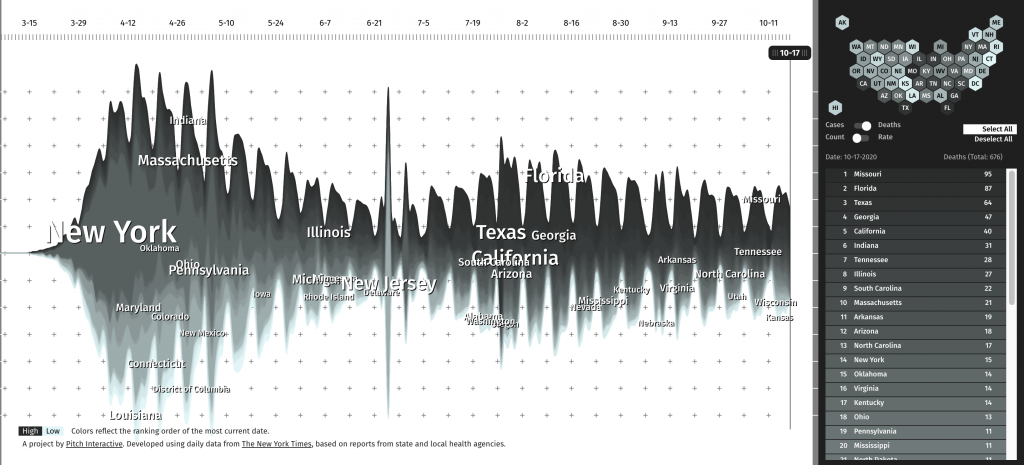
COVID-19 cases across the 50 states over the course of the pandemic

I found Pitch Interactive Inc.’s Ebb and Flow: COVID-19 Daily Cases Across the US a very effective data visualization tool, not to mention very relevant during the pandemic. The tool plots the daily cases and fatalities of each state in the U.S. in relation to each other over the course of the entire pandemic. I think the use of color and the visual nature of the graph effectively instills alertness and demonstrates the severity of the pandemic. As we enter the 7th month of dealing with this public health crisis, the inclusion of all states on the map is essential for the public to access to inspire better community action. People living in states that are doing worse in the current moment will feel a greater sense of responsibility to do better, as they can see their state “called out,” their performance directly plotted against “better” states, and how it affects the holistic curve of the United States. With our country becoming increasingly divided, a tool like this is not only scientifically representative, but has the potential to inspire social and political unity. I find it more effective than the largely achromatic COVID-19 graph provided by Google that forces users to choose their state from a drop-down menu.

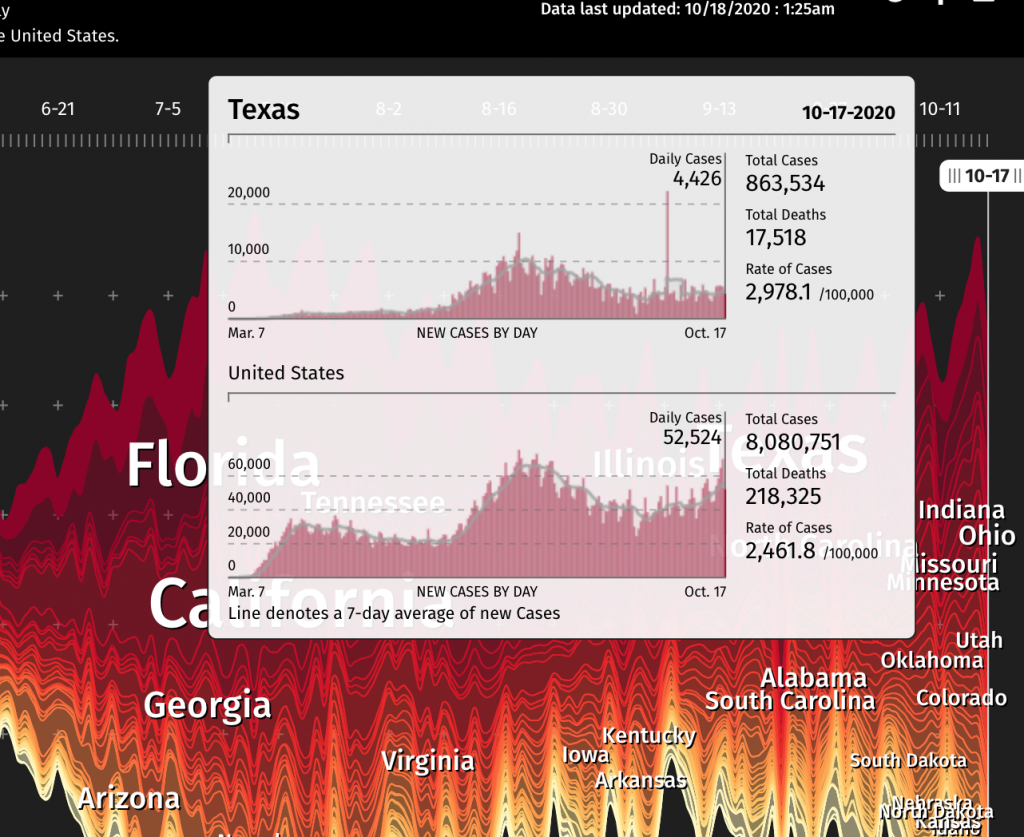
Magnifying function displays state’s curve in comparison to the national curve when the user mouses over the state’s curve on the main map

I believe the algorithm is largely determined by some of the functions that made the “stock market tracker” from the last lab, like arrays and array methods like push. Instead of using the noise function to generate the data values, real COVID data from The New York Times would determine the “marketvalue” array. A loop will also hold the array so that it updates daily without manual input. I wouldn’t consider this project to have a lot of artistic considerations, but I do believe the color and other visual decision made make this a good form of communication design made functional with code.

Deaths in America due to COVID-19

LO-07 (information visualization)

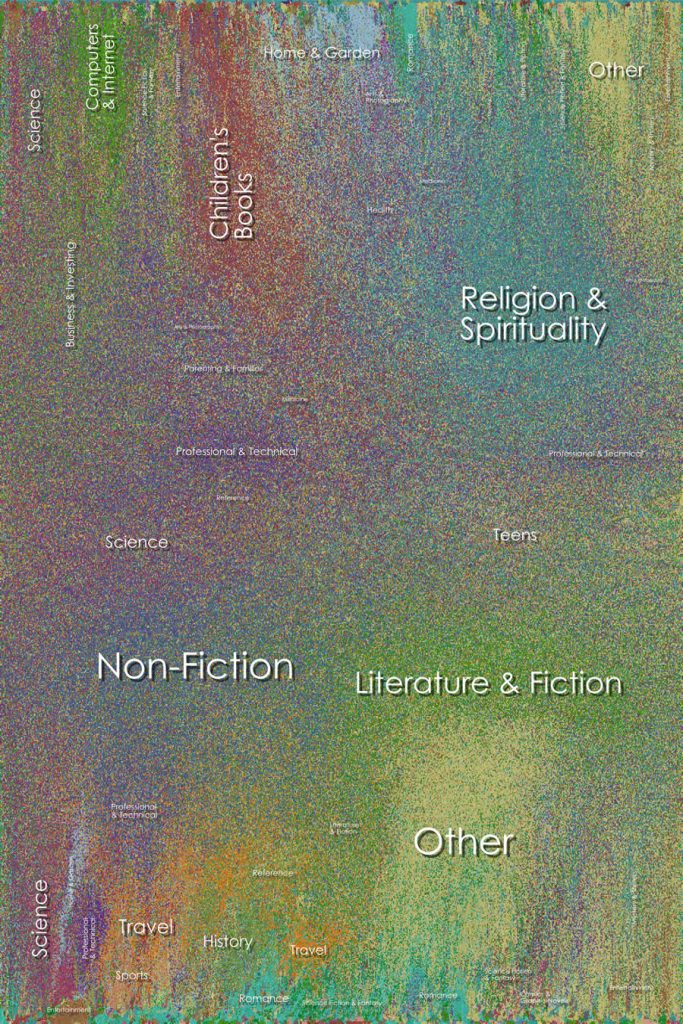
For this LO, I looked at Chris Harrisons data visulazation on amazon books. In the project he let his computer run an automated algorithm based on title, topic, and relevance to each other. This allows for similar books to “cluster” and create a more solid color. What I thought was interesting is how he mentions through each iteration, the books that are more and more similar will then begin to attract to one another, thus the more time provided equals a more coherent data graph. But due to the sheer sample size of the project, 700,000 books, Chris stated that it would have taken too much memory for the computer to run. Thus emphasizing the sheer physical space it takes to process data with a large sample group. What I thought was the most intriguing aspect of the project is the resulting color field as it creates such a unique gradient that almost seems like some form of abstract pixel art.

PROJECT-07 (curves)

sketch
// SEAN CHEN
// 15-104 A

var nPoints = 100;
var tx = []; // keeping track of the x y of each hypotrochoid
var ty = [];
var rot = 0; // rot init
var size = []; // each size
var col = []; // each color

function setup() {
    createCanvas(480, 480);
    background(255);
}

function distance() { // distance from center to mouse
    var d = dist(width/2, height/2, mouseX, mouseY);
    return d;
}

function hypotrochoid(a, col) {
    push();
    fill(col);
    var x, y, a, b, t;
    b = a / int(map(distance(), 0, width/2, 1, a));
    stroke(0);
    rotate(radians(rot));
    beginShape();
    for (var i = 0; i < nPoints; i++) {
        t = map(i, 0, nPoints, 0, TWO_PI);
        x = (a - b) * cos(t) - b * cos((a-b) / b * t);
        y = (a - b) * sin(t) + b * sin((a-b) / b * t);
        vertex(random(3)+x, random(3)+y);
    }
    endShape(CLOSE);
    pop();
}

function draw() {
    background(255);
    rect(0, 0, 480, 480);
    push();
    translate(width/2, height/2); // initial hypotrochoid
    hypotrochoid(120, color(245,211,114));
    pop();
    for (var i = 0; i < tx.length; i++) { // added hypotrochoid
        push();
        translate(tx[i], ty[i]);
        hypotrochoid(size[i], col[i]);
        pop();
    }
    rot += 1;
    text("click to add!", 10, 20);
}

function mouseClicked() { // add new hypotrochoid
    tx.push(mouseX); // input new at mouseXY
    ty.push(mouseY);
    size.push(random(50, 200));
    col.push(color(random(255),211,114));
    if (tx.length > 12) { // delete after 12
        tx.shift();
        ty.shift();
        size.shift();
        col.shift();
    }
}

Project 7 – Interactive Curve

sketch
//hollyl
//composition with curves
//section D
var nPoints = 150;

function setup(){
	createCanvas(480, 480);
}

function drawCartiod(){
	var x;
	var y;

	var a = 15;
	var b = a/2;
	var h = constrain(mouseY/50, 0, b);
	var ph = mouseX/50;

	fill(200, 255, 200);
	beginShape();
	for(var i=0; i<nPoints; i++){
		var t=map(i, 0, nPoints, 0, TWO_PI);

		x = (a+b)*cos(t) * (h-cos(ph+t*(a+b)/b));
		y = (a+b)*sin(t) * (h-cos(ph+t*(a+b)/b));
		vertex(x, y);
	}
	endShape(CLOSE);
}

function draw(){
	background(255);
	push();
	translate(width/2, height/2);
	drawCartiod();
	pop();
}


I really enjoyed the examples for this project, as they were very soothing to play with, so I decided to create a form that I enjoyed the most. I played around with epicycliod forms in desmos until I landed on one that I enjoyed that coded it.

LO 7

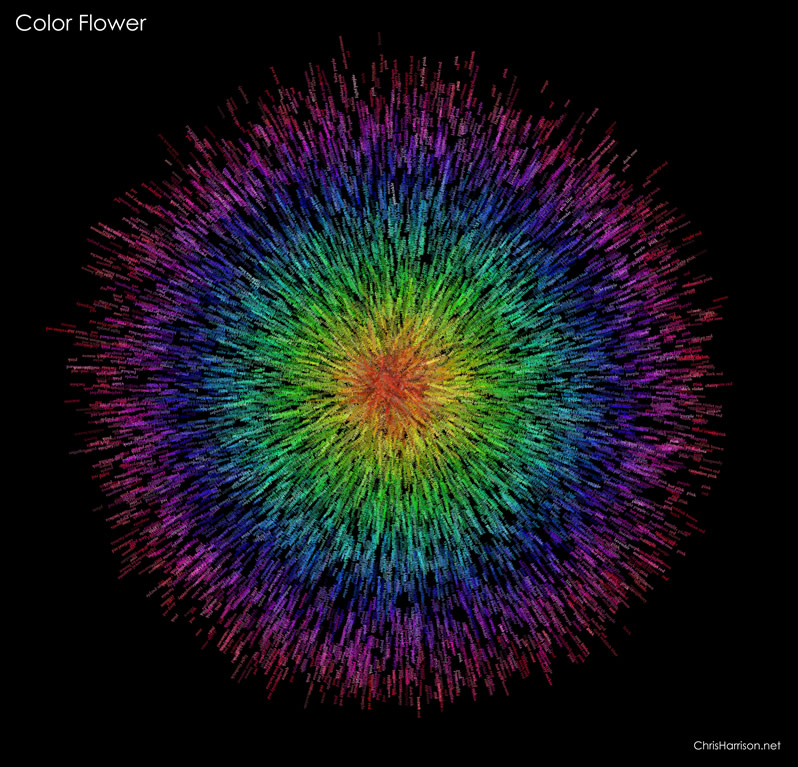
I particularly enjoyed the recommended Chris Harrison‘s ColorFlower project, where he ran 16,276 data points of known and named colors and organized them by their hue to create rainbow visualizations. Harrison had to play a hand in helping the algorithm determine the difference between brown and red, etc. He also used an aspect of randomization to make the visualizations seem more organic and textural.

Harrison’s ColorFlower render.