Project-07-Curves (Fireworks)

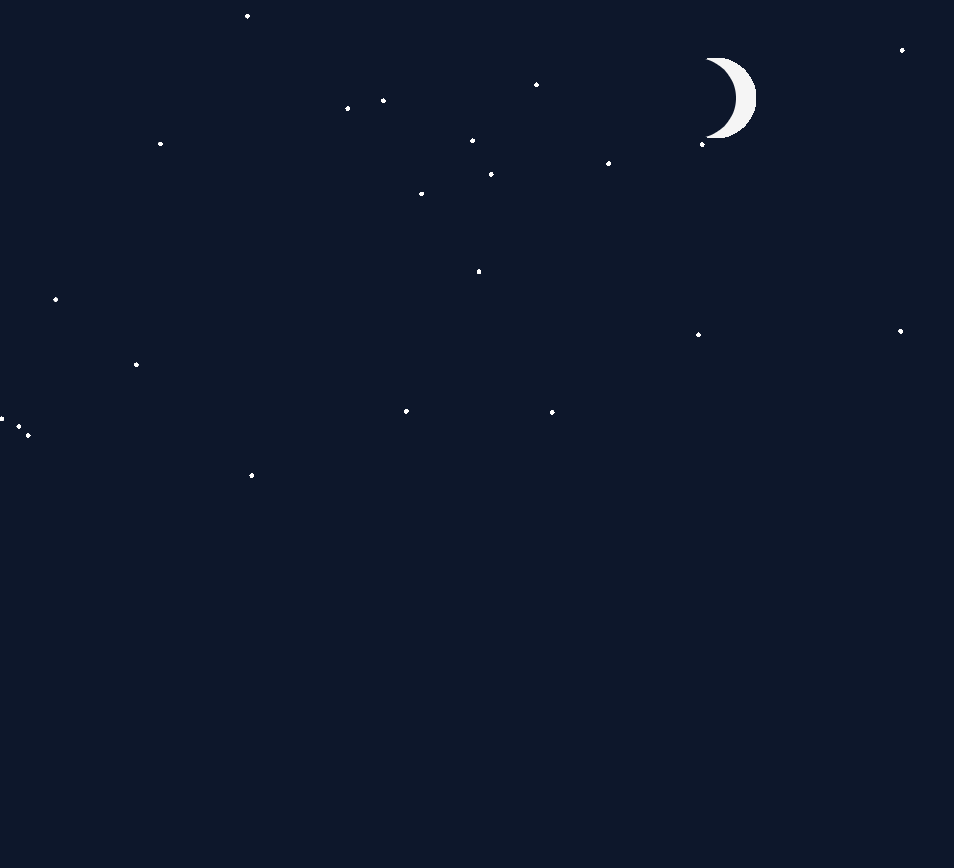
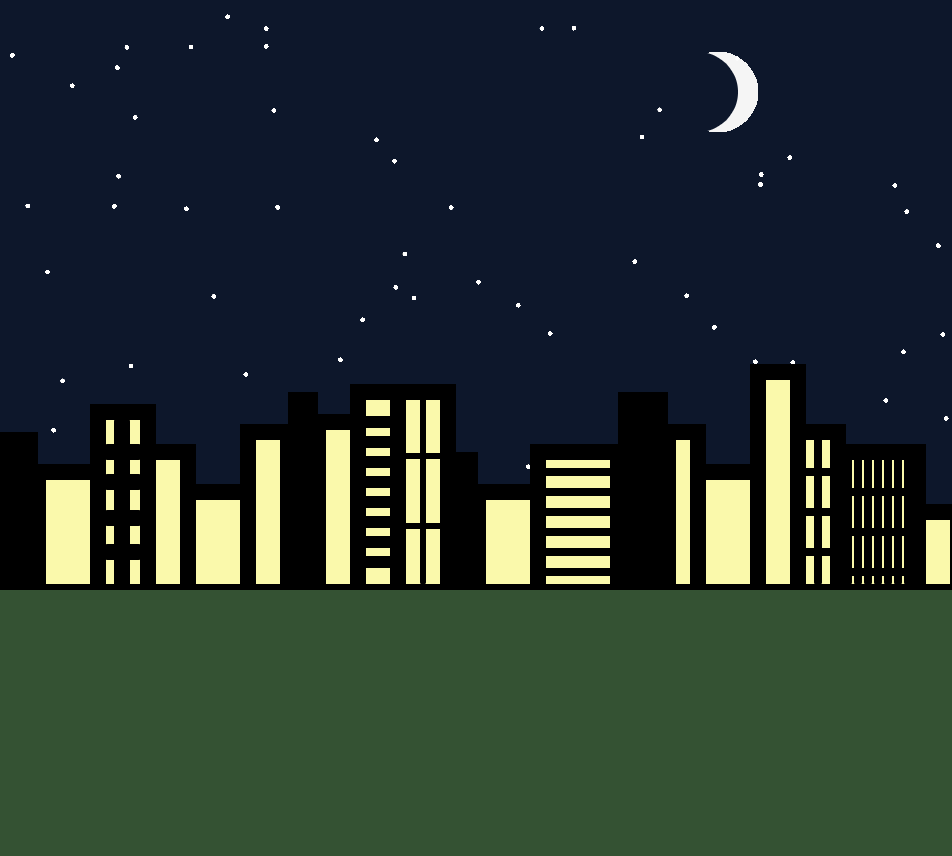
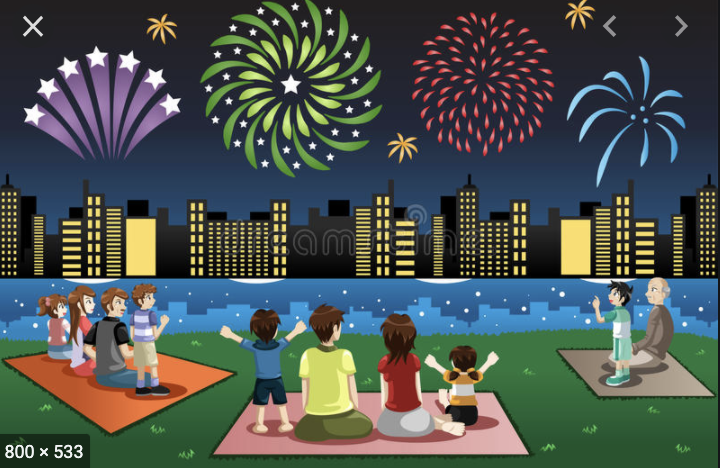
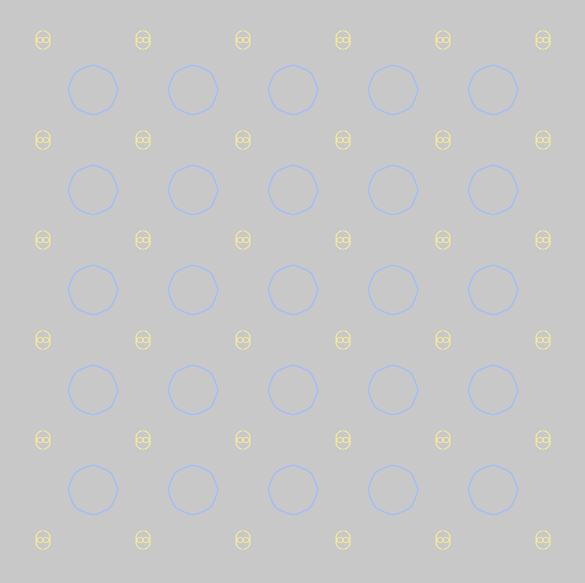
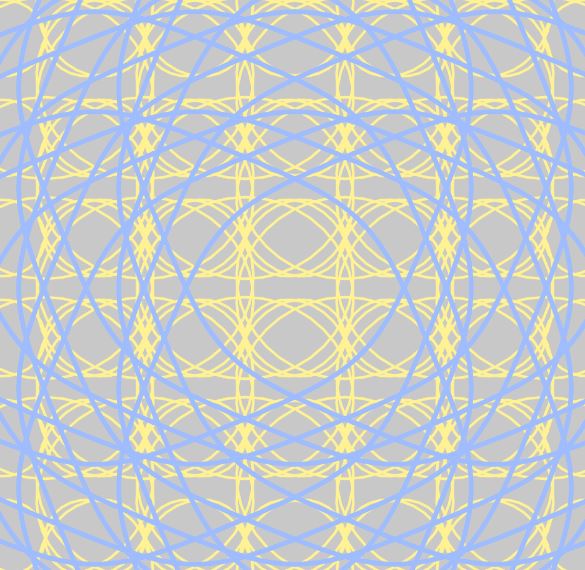
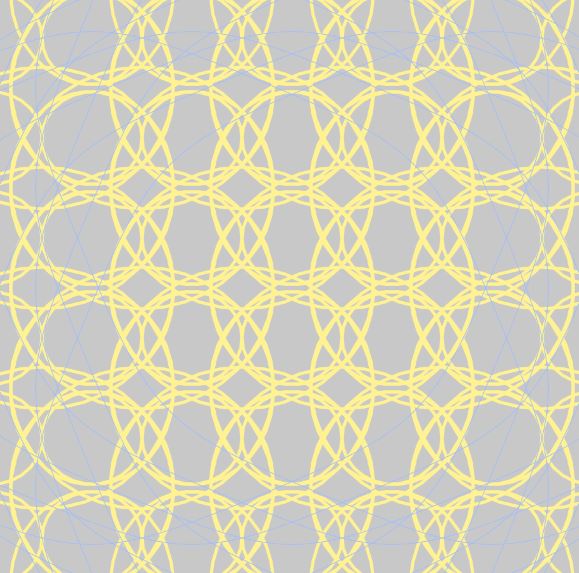
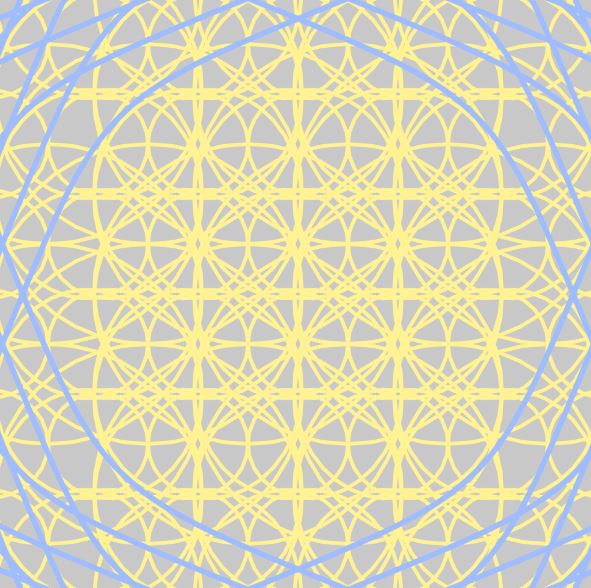
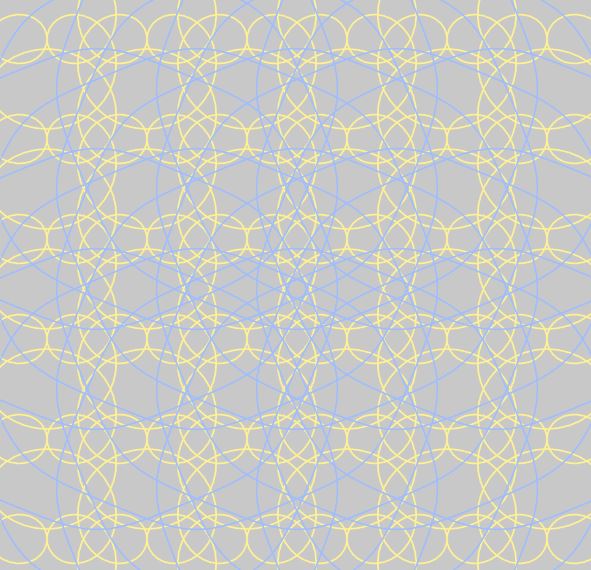
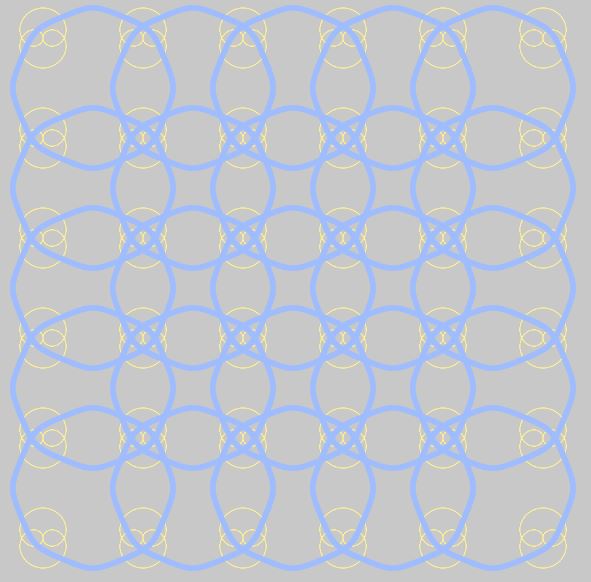
For my project, I wanted to incorporate these curves so that it served a purpose to the image. I did not want to simply create curves and just submit random shapes. I thought that the curve I wanted to use would suit the appearance of fireworks very well. It was difficult at first to figure out how to create these fireworks because I originally wanted them to burst and then disappear/fall down as real fireworks do. However, I decided to just have the fireworks growing and changing colors because I wanted the curves to constantly be seen. I based my project off of a cartoon image of a Fourth of July fireworks celebration, and that is why I put a person on a picnic blanket on the grass so that it would make more sense. I think the easiest part for me was making the city skyline and the person’s body because I have continuously layered shapes in all my projects. I think the most difficulty I had was creating the fireworks, while also making them different enough so that it actually seemed like real unpredictable fireworks. As mouseX or mouseY moves, colors of the fireworks can change, and the size and patterns move based on the mouse movement.

sketch
//Annie Kim
//anniekim@andrew.cmu.edu
//SectionB
//anniekim-07-project ~ CURVES ~ 

xStar = []; //array for stars
yStar = [];

function setup() {
    createCanvas(480, 440);
    background(10, 23, 45); //dark blue sky
    for (i = 0; i < 60; i ++) {
    	xStar[i] = random(0, 480); //randomly placing stars
    	yStar[i] = random(0, 240);
    }
    frameRate(10);
}
function draw() {
	//moon
    fill(245);
    noStroke();
    circle(360, 50, 40);
    fill(10, 23, 45);
    circle(350, 50, 40);

    var s = second(); //stars popping up every second
    for (i = 0; i < s; i ++) {
    	fill(255);
    	ellipse(xStar[i], yStar[i], 2, 2); //stars
    }
//orange OR yellow firework
    push();
    translate(250, 80);
    if (mouseX > 240) { //mouseX right half -> yellow
    	stroke(218, 218, 100);
    } else { //mouseX left half -> orange
    	stroke(218, 100, 100);
    }
	firework1(); 
	pop();
    //purple or pink firework
	push();
	translate(450, 45);
	if (mouseY < 240) { //mouseY top half -> pink
		stroke(135, 105, 170);
	} else { //mouseY bottom half -> purple
		stroke(105, 85, 255);
	}
	firework2();
	pop();
	//blue firework
	push();
	translate(30, 50);
	stroke(136, 194, 223);
	firework3();
	pop();
    //pink and red firework
	push();
	translate(200, 200);
	if (mouseX < 240) { //mouseX left half -> pink
		stroke(180, 70, 180); 
	} else { //mouseX right half -> red
		stroke(255, 120, 150);;
	}
	firework4();
	pop();
	//green or dark green firework
	push();
	translate(440, 180);
	if (mouseX > 240) { //mouseX right half -> dark green
		stroke(155, 165, 130);
	} else {
		stroke(205, 255, 180);
	}
	firework5();
	pop();
	
	//~~~~~CITY~~~~~
	//buildings in black
	fill(0); 
	noStroke();
	rect(0, 260, 480, 40); //base
	rect(0, 220, 20, 80);
	rect(145, 200, 15, 100);
	rect(225, 230, 15, 70);
	rect(310, 200, 25, 100);
	//city buildings FILLED BY YELLOW
	fill(250, 250, 160);
	stroke(0);
	strokeWeight(8);
	rect(20, 240, 30, 60);
	rect(50, 210, 25, 90);
	rect(75, 230, 20, 70);
	rect(95, 250, 30, 50);
	rect(125, 220, 20, 80);
	rect(160, 215, 20, 85);
	rect(180, 200, 20, 100);
	rect(200, 200, 25, 100);
	rect(240, 250, 30, 50);
	rect(270, 230, 40, 70);
	rect(335, 220, 15, 80);
	rect(350, 240, 30, 60);
	rect(380, 190, 20, 110);
	rect(400, 220, 20, 80);
	rect(420, 230, 40, 70); 
	rect(460, 260, 20, 40);//rightmost building
    //START OF WINDOW MAKING(separated by building in code)
	strokeWeight(8);
	stroke(0);
	//building #1
	line(62, 215, 62, 300);
	line(55, 230, 70, 230);
	line(55, 245, 70, 245);
	line(55, 263, 70, 263);
	line(55, 280, 70, 280);
    //building #2
	strokeWeight(4);
	line(270, 240, 310, 240);
	line(270, 250, 310, 250);
	line(270, 260, 310, 260);
	line(270, 270, 310, 270);
	line(270, 280, 310, 280);
	line(270, 290, 310, 290);
    //building #3
	line(410, 220, 410, 295);
	line(400, 240, 420, 240);
	line(400, 260, 420, 260);
	line(400, 280, 420, 280);
    //building #4
    line(425, 230, 425, 295);
	line(430, 230, 430, 295);
	line(435, 230, 435, 295);
	line(440, 230, 440, 295);
	line(445, 230, 445, 295);
	line(450, 230, 450, 295);
	line(455, 230, 455, 295);
	line(420, 250, 460, 250);
	line(420, 270, 460, 270);
	line(420, 290, 460, 290);
    //building #5
    strokeWeight(6);
	line(180, 215, 200, 215);
	line(180, 225, 200, 225);
	line(180, 235, 200, 235);
	line(180, 245, 200, 245);
	line(180, 255, 200, 255);
	line(180, 265, 200, 265);
	line(180, 275, 200, 275);
	line(180, 285, 200, 285);
    //building #6
	strokeWeight(3);
	line(200, 232, 225, 232);
	line(200, 267, 225, 267);
	line(212.5, 200, 212.5, 295);
    //END OF WINDOW MAKING
	//grass
	fill(42, 83, 47);
	noStroke();
	rect(0, 299, 480, 141);

	//picnic blanket
    fill(220, 125, 145); //pink color
    stroke(185, 100, 100); //darker pink color outline
    quad(150, 340, 310, 340, 330, 400, 130, 400); //blanket
    //PERSON SITTING ON BLANKET
    //arms
    fill(230, 200, 170);
    noStroke();
    rect(170, 340, 8, 30);
    rect(212, 340, 8, 30);

    //pants
    fill(104, 104, 55); 
    noStroke();
    ellipse(185, 380, 45, 25);
    ellipse(205, 380, 45, 25);
    //shirt
    fill(234, 234, 131);
    noStroke();
    rect(177.5, 313, 35, 57);
    ellipse(195, 369, 38, 9);
    rect(170, 320, 10, 20);
    rect(210, 320, 10, 20);
    //shoulders
    circle(177.5, 321, 15);
    circle(212.5, 321, 15);
    //sleeve lines
    stroke(200, 200, 100);
    strokeWeight(2); 
    line(178, 327, 178, 340);
    line(212, 327, 212, 340);
    //neck
    fill(200, 170, 140);
    noStroke();
    rect(190, 305, 10, 8);
    //head shape
    fill(230, 200, 170);
    ellipse(195, 295, 23, 28);
    //hair
    fill(80, 45, 25);
    ellipse(195, 285, 25, 20);
    ellipse(191, 290, 20, 30);
    triangle(195, 288, 207, 288, 195, 303);
    //ear
    fill(230, 200, 170);
    stroke(200, 180, 140);
    strokeWeight(1);
    ellipse(200, 295, 4, 7);
}

function firework1() { //yellow-orange firework
	var x;
	var y;
	var a = map(mouseY, 0, height, 0, 20);
	var h = map(mouseY, 0, height, 0, 20);
	var b = a / 4;
	var angle = 360;
	beginShape();
	for (var i = 0; i < angle; i ++) {
		strokeWeight(0.2);
		noFill();
		var q = map(i, 0, 180, 0, TWO_PI);
		x = (a - b) * cos(q) + (h) * cos(((a + b)/ b) * q);
		y = (a - b) * sin(q) + (h) * sin(((a + b)/ b)* q);
		vertex(x, y);
	}
	endShape(CLOSE);
}

function firework2() { //purple-pink firework
	var x;
	var y;
	var a = map(mouseY, 0, height, 0, 35);
	var h = map(mouseY, 0, height, 0, 35);
	var b = a / 8;
	var angle = 360;
	beginShape();
	for (var i = 0; i < angle; i ++) {
		strokeWeight(0.2);
		noFill();
		var q = map(i, 0, 180, 0, TWO_PI);
		x = (a - b) * cos(q) + h * cos(((a + b)/ b) * q / 2);
		y = (a - b) * sin(q) + h * sin(((a + b) / b) * q / 2);
		vertex(x, y);
	}
	endShape(CLOSE);
}

function firework3() { //blue firework
	var x;
	var y;
	var a = map(mouseX, 0, 240, 0, 20);
	var h = map(mouseY, 0, 240, 0, 20);
	var b = a / 15;
	var angle = 360;
	beginShape();
	for (var i = 0; i < angle; i ++) {
		strokeWeight(0.08);
		noFill();
		var q = map(i, 0, 180, 0, TWO_PI);
		x = (a - b) * cos(q) + h * cos(((a + b)/ b) * q);
		y = (a - b) * sin(q) + h * sin(((a + b) / b) * q);
		vertex(x, y);
	}
	endShape(CLOSE);
}

function firework4() { //pink-red firework
	var x;
	var y;
	var a = map(mouseX, 0, 400, 0, 50);
	var h = map(mouseY, 0, 400, 0, 40);
	var b = a / 20;
	var angle = 360;
	beginShape();
	for (var i = 0; i < angle; i ++) {
		strokeWeight(0.2);
		noFill();
		var q = map(i, 0, 180, 0, TWO_PI);
		x = (a - b) * cos(q) + h * cos(((a + b)/ b) * q);
		y = (a - b) * sin(q) + h * sin(((a + b) / b) * q);
		vertex(x, y);
	}
	endShape(CLOSE);
}

function firework5() { //green-dark green firework
	var x;
	var y;
	var a = map(mouseX, 0, 240, 0, 18);
	var h = map(mouseX, 0, 240, 0, 18);
	var b = a / 7;
	var angle = 360;
	beginShape();
	for (var i = 0; i < angle; i ++) {
		strokeWeight(0.4);
		noFill();
		var q = map(i, 0, 180, 0, TWO_PI);
		x = (a - b) * cos(q) + h * cos(((a + b)/ b) * q);
		y = (a - b) * sin(q) + h * sin(((a + b) / b) * q);
		vertex(x, y);
	}
	endShape(CLOSE);
}


This was the starting process where I made the night sky, and added a moon and stars. The stars add with seconds, so every star represents a second.
This was after I made the city skyline, I started by making rectangles of different sizes with a yellow fill and black stroke outline. I made the windows by putting black lines over the yellow fills.
This was my inspiration/reference for the fireworks project. I didn’t do nearly as much as in this image, but I did base a lot of ideas from this.

Project 07-Curves

sketch
var nPoints = 100;
function setup() {
    createCanvas(400, 400);
    frameRate(60);
}


function draw() {
    background(0);
    
    // draw the frame
    fill(0); 
    noStroke();
    stroke(57,255,20);
    noFill(); 
    rect(0, 0, width-1, height-1); 
    
    // draw the curve
    push();
    translate(width / 2, height / 2);
    for( var count = 1; count <= 9; count += 1){
      if(count <=3){
        drawButterflyCurve(-200 + count*100, 110);
      }else if(count <= 6){
        drawButterflyCurve(-200 + (count-3)*100, 0);
      }else if(count <= 9){
        drawButterflyCurve(-200 + (count - 6)*100, -110);


      }
    }
    pop();
  
}
function drawButterflyCurve(dx, dy){
  var x;
  var y;
  beginShape();
  for (var i = 0; i < nPoints; i++) {
        var t = map(i, 0, nPoints, 0, TWO_PI);
        x = 20*Math.sin(t) * [(Math.E)**(Math.cos(t)) - 2*Math.cos(mouseX/100 + 4*t) + (Math.sin(t/12))**5] - dx;
        y = -20*Math.cos(t) * [(Math.E)**(Math.cos(t)) - 2*Math.cos(mouseY/100 + 4*t) + (Math.sin(t/12))**5] - dy;
    vertex(x,y);
    
  }
  endShape(CLOSE);
}

Reading the project description, I was very intimidated by this week’s project due to all the complicated formulas and many options. I think I was drawn to the butterfly curve because of the shape and the complexity of it. I wanted to make a pattern out of these curves while it would turn based off the mouse’s position. Based on the mouse position, the curves would change and the lines would make different positions.

Project-07-Curves

For this project I explored the conchoid of de Sluze curve. I thought this curve was interesting because it reflects different curves across a vertical access depending on if the equation is multiplied by a positive or negative “a”. This reminded me of a galaxy being pinched and forming from space matter so I added a rocket and stars into the background. It also looks like a planet is forming from space matter. The colors change based on the mouse position, the sizes of the curves also change based on mouse position, and when you keep your mouse pressed you can make the right half of the curve (changed “a” value).

graanak-07
//Graana Khan 
//Section B 
// 07 - Project - Curve Composition 

var p = 500; //number of points
var x;
var y;
var a;

function setup() {
    createCanvas(480, 480);
    background(0);
}

function draw() {

//drawing the conchoid curve
	push();
	translate(width/2, height/2);
	scale(25);
	conchoid();
	pop();

//adding the stars in the background 
	stars(50, 50);
	stars(230, 350);
	stars(400, 400);
	stars(380, 100);
	stars(200, 150);
	stars(460, 240);
	stars(70, 430);
	stars(100, 270);
	stars(300, 300);

//rocket in corner
	x = 70;
	y = 400;
	rocket();
	
}

//function for the conchoid of de Sluze 
function conchoid(){
	beginShape();
	stroke(mouseX-200, mouseY-100, 200); //color changes on mouse position 
	strokeWeight(0.01);
	noFill();

	//creating loop for the curves 
	for(var i =0; i < p; i++){
		var t = map(i, 0, p, 0, 2*PI);

		if(mouseIsPressed){  //a values switch from positive to negative if mouse is pressed
			a = mouseX/100;
		} else {
			a = -1*(mouseX/50);
		}

		//equations are from https://mathworld.wolfram.com/ConchoidofdeSluze.html
		x = ((1/cos(t)) + (a*cos(t)))* cos(t);
		y = ((1/cos(t)) + (a*cos(t)))* sin(t);
		vertex(x,y);
	}
	endShape();
}

//function for making the stars 
function stars(x,y){
	stroke(255);
	line(x, y-5, x, y+5);
	line(x-5, y, x+5, y);
}

//rocket in the corner 
function rocket(){
	push();
	translate(x,y);
	rotate(radians(45));
	noStroke();
	fill(255);
	rect(0, 0, 14, 28, 2);
	triangle(0, 0, 7, -13, 14, 0);
	triangle(0, 8, 0, 16, -4, 16);
	triangle(14, 8, 14, 16, 18, 16);
	stroke(255, 0, 0);
	line(2, 30, 2, 40);
	line(11, 30, 11, 42);
	stroke(244, 128, 11);
	line(5, 30, 5, 45);
	stroke(244, 238, 11);
	line(8, 30, 8, 37);
	noStroke();
	fill(0);
	circle(7, 10, 8);
	pop();
}

Project 07 : Curves

petal
//Rachel Kim
//15-104(Section C)
//rachelki@andrew.cmu.edu
//Project 07


//global variables
var numPoints = 800;

function setup() {
    createCanvas(480, 480);
}

function draw() {
    
    background(200); //dusty pink bkgrd color
    

    for (var x = 40; x <= 480; x += 80) {	//number of "modules" (grid)
        for (var y = 40; y <= 480; y += 80) {
            push();
            translate(x, y);
            EpicycloidPedal();
            pop();
        }
    }

    for (var x = 80; x <= 460; x += 80) {	//number of "modules" (grid)
        for (var y = 80; y <= 460; y += 80) {
            push();
            translate(x, y);
            HypocycloidPedal();
            pop();
        }
    }
}


function HypocycloidPedal() {
    
    //radius
    var a = map(mouseX, 0, 480, 0, 120); 
    var b = map(mouseX, 0, 480, 0, 60);

    strokeWeight(mouseY/100, mouseX/350); //change in stroke thickness
    stroke(158, 188, 254); //blue color
    noFill();

    //moduleShape
    beginShape();
    for (var i=0; i<numPoints; i++) {
        var angle = map(i, 0, 180, 0, TWO_PI);
        var n = 8; //number of pedals

        //equations from mathworld
        x = a * (((n-1) * cos(angle)) + (cos((n-1) * angle)) / n);
        y = a * (((n-1) * sin(angle)) - (sin((n-1) * angle)) / n);

        vertex(x, y);    	
    }
    endShape(); 	
}


function EpicycloidPedal() {

    //radius
    var a = map(mouseX, 0, 480, 0, 160); 
    var b = map(mouseX, 0, 480, 0, 80); 


    strokeWeight(mouseX/80, mouseY/200); //change in stroke thickness
    stroke(255, 242, 147); //yellow color
    noFill();

    //module shape
    beginShape();
    for (var i=0; i<numPoints; i++) {
        var angle = map(i, 0, 100, 0, TWO_PI);

        //equations from mathworld
        x = ((1/2) * (a+(2*b))) * (cos(angle) - cos(((a+b)*angle) / b));
        y = ((1/2) * (a+(2*b))) * (sin(angle) - sin(((a+b)*angle) / b));

        vertex(x, y);
    }
    endShape();

}

After browsing through the Mathworld curves site, I wanted to explore the possibilities of the Hypocycloid pedal curve and the Epicycloid pedal curve under the roulettes category. Using different functions, I tried showing the different shapes each curve had the ability to make, through the manipulation of its radius and x and y coordinates. Above, there are screenshots of the different visuals depending on where the mouse is placed on the screen. I did not want to manipulate any change in the colors, because I want the user to focus on the different geometries.

Looking Outwards 07 : Computational Information Visualization

Rachel Binx is an American designer, data visualizer, and developer. She graduated from Santa Clara University and is currently the co-founder of Meshu and Gifpop. Meshu and Gifpop are companies that focus on creating visualizations from social data. One of her projects includes Healthy Los Angeles. This project’s purpose was to provide the residents of Los Angeles with a more interesting way to view information about neighborhoods. Combining creativity/art with data/numbers is a great way to grab the attention of the audience. It can also have the possibility of making information much easier to read and understand. The website itself is able to collect 100 health indicators while featuring two different views: a city-level view and a neighborhood view.

Project 7: Curves

I was really drawn to the rounded curves of the Cardioid and wanted to see how much I could alter this shape based on my mouse’s position. Based on your mouse’s position on the canvas, the Cardioid will change in shape and color.

curves
var nPoints = 100;
var CARDIOID = 0;
var curveMode = CARDIOID;

function setup() {
    createCanvas(480, 480);
    noStroke();
    frameRate(20);
    pinkColor = color(255, 179, 184);
    paleGreen = color(236, 255, 214);
    paleBlue = color(224, 222, 255);
    yellowColor = color(254, 255, 222);
}

function draw() {
    //change color of background depending on MouseY
    let changeBG = map(mouseY, 0, height, 0, 1);
    var changeColor = lerpColor(paleGreen, paleBlue, changeBG);
    background(changeColor);

    //drawing the cardioid
    push();
    rotate(-(PI/2.0));
    translate(-width/4.0, height/2);
    switch (curveMode) {
        case CARDIOID:
            drawCardioidCurve();
            break;
    }
    pop();
}

function drawCardioidCurve() {
    //Cardioid: https://mathworld.wolfram.com/Cardioid.html
    //x = a cos t(1 - cos t)
    //y = a sing t(1 - cos t)

    var x;
    var y;
    var a = 150.0;
    var stifleMouse = constrain(mouseX/2.5, 0, width);

    //changing cardioid color
    let changeShape = map(mouseY, 0, height, 0, 1);
    var shapeColor = lerpColor(pinkColor, yellowColor, changeShape);
    fill(shapeColor);

    //cardioid shape
    beginShape();
    for (var i = 0; i < nPoints; i++) {
        var t = map(i, stifleMouse, nPoints, 0, TWO_PI);
        x = a * cos(t) * (1 - cos(t));
        y = a * sin(t) * (1 - cos(t));
        vertex(x, y);
    }
    endShape(CLOSE);
}

Project 07: Curves

This project was a really fun experience with using different curves to simulate weather, along with arrays and shifting elements in the array. It was difficult to actually get the weather to move the way I wanted it to but I’m still unhappy with how some of the rain function works. It took a bit to get the curves working but from there it wasn’t too hard to get the grids working the way I wanted, although there were some pretty funny interactions with the direction and speed with which the curves moved and fell.

weather

var nPoints = 100
var curveX = []
var curveY = []
var numCurves;


function setup() {
    createCanvas(480, 480);
}


function draw() {
	numCurves = width
	for (y = 0; y < width; y += 40){ ////sends data to arrays to translate for curves
    for (x = 0; x < height; x += 40){
            curveY.push(y)
            curveX.push(x)
        }
    }
	background(0, 0, 255, 4)
	if (mouseIsPressed) { ///changes curve and color when mouse is held down
		rain()
	} else {
	    wind()
	}
}

function drawGrid() { ///establishes moving pattern of neiods for the rain() function
curveX.shift()
curveY.shift()
for(n = 0; n <= numCurves; n++){
	translate(curveX[n], curveY[n])
	drawNeoid()
}
}


function drawSecond() {  ///establishes moving pattern of curves for the wind() function
curveX.shift()
curveY.shift()
for(k = 0; k <= numCurves; k++){
	translate(curveX[k], curveY[k])
	drawLituus()
    }
}
function drawNeoid() { ///draws a neiod curve based on the mouse location
	var x
	var y
	var r
	var a = mouseX / 10
	var b = mouseY / 5
	beginShape()
	   for (var i = 0; i < nPoints; i++) {
            var t = map(i, 0, nPoints, 0, TWO_PI); ///converts to terms of pi
            r = (a * t) + b ////neiod formula
            x = r * cos(t)
            y = r * sin(t)
            vertex(x, y)
        }
    endShape()        
}

function drawLituus() { ///draws a lituus curve based on the mouse location, similar process to drawNeiod() with a different formula
    var x
	var y
	var r
	var a = (mouseX / 10) + (mouseY / 5)
	beginShape()
	   for (var i = 0; i < nPoints; i++) {
            var t = map(i, 0, nPoints, 0, TWO_PI);
            r = sqrt(sq(a) / t) ///lituus formula in terms of r
            x = r * cos(t)
            y = r * sin(t)
            vertex(x, y)
        }
    endShape()
}

function rain(){ ///draws a pattern of blue neiods like rain
	drawGrid()
	stroke(0, 0, 255)
	background(236, 236, 236, 4)
}

function wind(){ ////draws white lituuses like wind
	drawSecond()
	stroke(255, 255, 255)
	}

Looking Outwards 07: Information Visualization

A visualization of human development levels in 2013.

For this week’s Looking Outwards, I was drawn to Dutch creative developer Jurjen Verhagen’s online data visualization Human Development Tree, an interactive platform that lets users visualize a level of human development based on set conditions of life expectancy, expected years of education, mean years of education, a country’s GDP, the country’s ideals on gender equality, and a color of your choice. Based on your input, the platform will reveal
your “ideal tree” with leaves. Leaves that fall off the tree represent current countries that don’t meet your conditions in 1985. More leaves grow back on tree as the data visualization progresses to the year 2013.

You can change the color of the tree’s leaves.

I thought this project was a super fascinating way to combine data and gamification in a fun but educational way. This visualization taught me a lot about human development and how much the world has changed since 1985, as well as leave me curious on how the tree’s leaves would have changed since 2013. I’m really curious on what kinds of algorithms Verhagen combined with
his beautiful 3D models, and if he ever plans on updating this project to reflect data from 2020.

Interact with the data visualization here.

LO 07: Data Visualization

For this week’s LO, I researched the 24 hour movement of air traffic over Europe, called Europe 24, found on Visual Complexity. It is a beautiful array of data, set over a geographically accurate representation of Earth to better reflect where each plane is going. Europe 24 was made by NATS, the leading organization in air traffic control in the UK, which oversees all airports in the country, especially the busiest airport in Europe, in Heathrow. The visualization is particularly important for a company such as NATS as it provides a representation of how flights move over the space they work to keep safe and allows them to identify areas of high traffic which could prove to be dangerous. It is also artistically pleasing, with soft blues and a beautiful almost-photorealistic graphic of the globe below each line. The entirety of the animation is very clean and professional, as befitting such an important organization, and the overall cleanliness of the work makes it more accessible to the public so they might understand the work of NATS in the UK. Individual planes are show as points of light to enhance clarity as they move, and so they are not lost in the blue trails others leave behind, and cities are highlighted so they stand out as well.

The video of Europe 24 running, tracking flights over the continent for a day.

Project7_curves

sketch_curvesDownload
	// Huijun Shen  session D
    // huijuns@andrew.cmu.edu


var nPoints = 100;
//var lineGroup = [];


function setup() {
    createCanvas(400,400);
    background(180);
    frameRate(10);  
    
}


function draw() {
    background(150);
    noStroke();
    push();
    translate(width/2,height/2);
    rotate(mouseX/30); // make it rotate according to x position
    Orthotomic();
    pop();
    
} 

function Orthotomic(){ //draw the shape

    var x;
    var y;  
    noFill();
    fill(255-mouseY*0.3,mouseY*0.2,100); // make color related to y position
    stroke(3);
   
    beginShape(); // the shape
    for (var i = 0; i < nPoints; i++) {
        var t = map(i, 0, nPoints, 0, TWO_PI);
        x = constrain(mouseX,0,400)/30*cos(t);
        y = sin(t);
        var x1 =20*(x*cos(2*t)-y*sin(2*t)+2*sin(t));
        var y1 =20*(-x * sin(2*t) - y*cos(2*t) + 2*cos(t));
        vertex(x1+random(5), y1+random(5)); //make the edge a bit random lines
    }


    endShape(CLOSE);    
   
    
}