LO – 07

“Flight Patterns” by Aaron Koblin explores the cultural trends and relationships between humans and technology with the use of U.S. flight data. He used data from the U.S. Federal Aviation Administration which resulted in an animation that shows the frequent routes in popular western cities and traffic over certain geographical areas. I was initially drawn to this piece because I had initially thought it was randomly generated from its close up shots, but it was when the image zoomed out, did I see it in its entirety. This phantom like quality mixed with various colors and patterns illustrates a wide range of aircraft events and results in a mesmerizing depiction of our country. I enjoyed this time-lapse animation of the American air-traffic patterns because it parallels with our idea of what a recorded time lapse footage of these flight patterns may look like in real life.

Paths of air traffic over North America visualized in color and form.

Project 7 – Curves

For this project, I decided to create a psychedelic display of colors and lines. I played around with Epitrochoid Curves and created two different circular displays. This resulted in a busy display of lines and curves that almost seemed 3d. I took a screenshot of my favorite shape, which looked like a cell underneath a microscope.

sketchDownload
//Se A Kim
//seak
//Section D

var nPoints = 300;
var angle = 100;

function setup() {
    createCanvas(480, 480);
}

function draw() {
    background(0);
    translate(width/2, height/2);
    rotate(mouseX/20);
    drawEpitrochoidCurve1();
    drawEpitrochoidCurve2();
}
    //Draw Epitrochoid 1
function drawEpitrochoidCurve1() {
    var a = map(mouseX, 0, 480, 0, 100); 
    var b = map(mouseY, 0, 480, 0, 50); 
    var c = map(mouseY, 0, 480, 0, 50); 
    strokeWeight(1);
    stroke(200, 255, 226);
    fill(200, 100, 109); 

    beginShape(); 
    for (var i=0; i<nPoints; i++) {
        var angle = map(i, 0, 20, 0, PI);
        x = (a) * cos(angle) - c * cos((a+b) * angle);
        y = (b) * sin(angle) - c * sin((a+b) * angle);
        vertex(x, y);
    }
    endShape();
}

    //Draw Epitrochoid 2
function drawEpitrochoidCurve2() {
    var a = map(mouseX, 0, 1000, 0, 10); 
    var b = map(mouseY, 0, 1000, 0, 50); 
    var c = map(mouseX, 0, 1000, 0, 50); 
    strokeWeight(1);
    stroke(200, 20, 226);
    fill(100, 10, 120); 

    beginShape(); 
    for (var i=0; i<nPoints; i++) {
        var angle = map(i, 0, 20, 0, PI);
        x = (b) * cos(angle) - c * cos((a+b) * angle);
        y = (a) * sin(angle) - c * sin((a+b) * angle);
        vertex(x, y);
    }
    endShape();
}
A screen capture of my favorite shape

Project 7 – Composition with Curves

it’s an avocadooooooooo… thaaaaanksss…

sketch
var nPoints = 100;

function setup() {
    createCanvas(300, 480);
    background(220);
    text("p5.js vers 0.9.0 test.", 10, 15);
    frameRate(10);
}

function draw() {
    background(198, 179, 220);
    //Avocado
    push();
    translate(width * 0.6, height * 0.5);
    rotate(radians(30));
    cranoidCurve();
    pop();
    //Avocado face
    face();
    //Avocado pit
    moon();
    //Stars move with mouse
    push();
    translate(mouseX - 200, 30);
    star();
    pop();
    push();
    translate(100, mouseY + 80);
    scale(0.5);
    star();
    pop();
}

function cranoidCurve() {
    var x;
    var y;
    var r;
    var a = 40;
    var b = 60;
    var c = 70;
    var p = constrain((mouseX / width), 0, 1);
    var q = constrain((mouseY / height), 0, 1);
    stroke(77, 135, 2);
    strokeWeight(10);
    fill(195, 238, 139);
    beginShape();
    for(var i = 0; i < nPoints; i++) {
        var t = map(i, 0, nPoints, 0, TWO_PI);
        r = a * sin(t) +
            b * sqrt(1 - p * sq(cos(t))) +
            c * sqrt(1 - q * sq(cos(t)));
        x = r * cos(t);
        y = r * sin(t);
        vertex(x, y);
    }
    endShape(CLOSE);
}

function face() {
    noFill();
    stroke(0);
    strokeWeight(2);
    arc(200, 190, 5, 5, radians(210), radians(30));
    arc(220, 200, 5, 5, radians(210), radians(30));
    arc(205, 210, 10, 10, radians(50), radians(190));
}

function moon() {
    //Moon/Avocado pit gets bigger as x increases with mouse
    var x = max(min(100 + mouseX, width), 10);
    var sizeX = x * 3 / 10;
    var r = 300 - mouseX;
    var g = 300 - mouseX;
    var b = 30;
    noStroke();
    fill(r, g, b);
    circle(mouseX - 100, mouseY - 30, sizeX);
}

function star() {
    fill(240, 255, 135);
    frameRate(10);
    var x = [50, 61, 83, 69, 71, 50, 29, 31, 17, 39];
    var y = [18, 37, 43, 60, 82, 73, 82, 60, 43, 37];
    var nPoints = x.length;
    beginShape();
    //Squiggly star
    for (var i = 0; i < nPoints; i++) {
        vertex (x[i] + random(-3, 3), y[i] + random(-3, 3));
    }
    endShape(CLOSE);
}

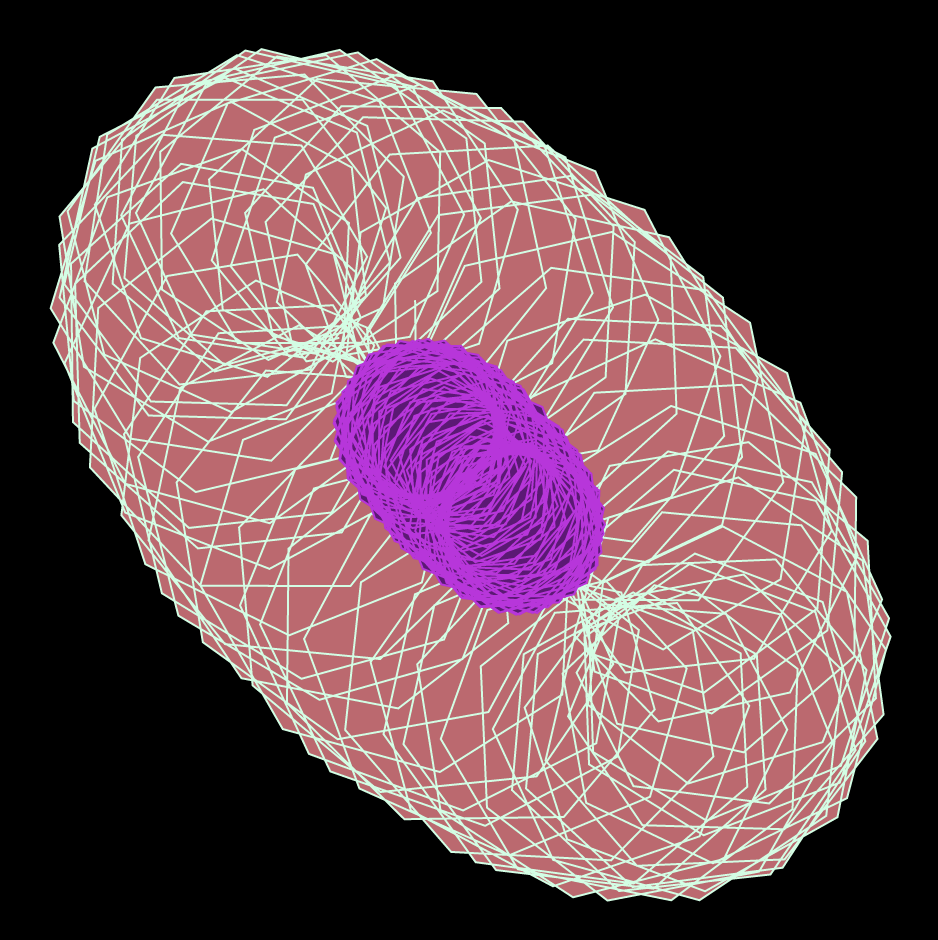
While exploring different types of curves, I was inspired by the cranioid curve, which strongly resembles an avocado shape when interacted with.

Project 7: Curves

For project 7, I chose to use a logarithmic spiral to create a series of spirals that interact with the mouse position. I was inspired to do logarithmic spirals by some shells I have in a jar on my desk. Then, I wanted to do something that is colored differently than my previous projects.

screen capture of my program

The spiral’s distance from the center increases or decreases relative to the mouse x position while the degree from the center changes relative to Y depending on the Y position.

sketch

//Helen Cheng
//helenc1@andrew.cmu.edu
//Section C
//Project-07

var theta;
var r;
var nPoints = 500;

function setup() {
  createCanvas(480, 480);
  angleMode(DEGREES);
}

function draw() {
  background(0);
  startAngle = constrain(mouseY, 10,360);
  //parallel spirals
  stroke(255,255,0);
  logSpiral(0,startAngle);
  stroke(255,255,255)
  logSpiral(mouseX, startAngle);
  stroke(255,0,0)
  logSpiral(mouseX+25, startAngle+25);
  stroke(0,255,0)
  logSpiral(mouseX+50, startAngle+50);
  stroke(0,0,255)
  logSpiral(mouseX+75, startAngle+75);

}

function logSpiral(r, theta, color) {
  var x;
  var y;
  noFill();
  beginShape();
  //populates points on each of the spirals
  for (i=0; i<nPoints; i++) {
    x = 240+(r+i)*-cos(theta+2*i);
    y = 240+(r+i)*sin(theta+2*i);
    vertex(x, y);
  }
  endShape();
}

Project 07

curvy curves
var x;
var y;
var spread; // how far each bean is from one another	
var a; // scales the size of individual beans


function setup() {
    createCanvas(480, 480);
}

function draw() {
    background(0, 30, 50);	
	translate(width/2, height/2);
	push();
	for(var i = 0; i <= 24; i ++){
		beanWO();
		rotate(radians(15));
	} 
	pop();
    // arrangement of 24 beanWO functions 

	push();
    for(var j = 0; j <= 12; j++){ 
    	beanF();
    	rotate(radians(30));
    }
    pop();
    // arrangement of 12 beanF functions

    push();
    for(var k = 0; k <= 36; k++){
        beanScrib(); 
        rotate(radians(mouseX));	
    }
    pop();
    // arrangement of 36 scribble-like shapes that rotate based on the X position of the mouse

    push();
    for(var m = 0; m <= 3; m ++){
    	beanVar();
    	rotate(radians(120));
    }
    pop();
    // draws function beanVar in the middle of the canvas
} 


function beanWO(){ 
// draws beans with white outlines that move toward and away from the origin based on mouseX
    push();
    a = 100
    spread = mouseX/5;
	stroke(255);
	noFill();
	beginShape();
	for(var theta = 0; theta <= TWO_PI; theta += radians(1)){
        x = a * cos(theta) * (pow(sin(theta), 3) + pow(cos(theta), 3)) + spread; // 
        y = a * sin(theta) * (pow(sin(theta), 3) + pow(cos(theta), 3)) + spread; // y parameter of bean curve
        vertex(x, y)
	}
	endShape();
	pop();
}

function beanF(){ 
// draws translucent beans whose colors change with mouseY
	push();
	a = 200;
	spread = -mouseX/5; 
	var r = map(mouseY, 0, 480, 0, 255);
	noStroke();
	fill(r, 255, 231, 40);
	beginShape();
	for(var theta = 0; theta <= TWO_PI; theta += radians(1)){
        x = a * cos(theta) * (pow(sin(theta), 3) + pow(cos(theta), 3)) + spread; // x paremeter of bean curve
        y = a * sin(theta) * (pow(sin(theta), 3) + pow(cos(theta), 3)) + spread; // y parameter of bean curve
        vertex(x, y)
	}
	endShape();
	pop();	
}

function beanScrib(){ 
// draws a variation of the bean function that looks like a scribble
	push();
	a = mouseY;
	spread = mouseY/12
	noFill();
	stroke(214, 197, 255, 40);
	strokeWeight(3);
	beginShape();
	for(var theta = 0; theta <= radians(180); theta += radians(1)){
        x = a * cos(theta * .5) * (pow(sin(theta * .6), 3) + pow(cos(theta), 3)) + spread; 
        y = a * sin(theta * .5) * (pow(sin(theta * .6), 3) + pow(cos(theta), 3)) + spread; 
        vertex(x, y)
	}
	endShape();
	pop();	
}

function beanVar(){ 
// draws a variation of the bean function that changes with mouseY
	push();
	a = 50
	var b = map(mouseY, 0, height, 0, 5) // modifies an angle in the function with mouseY
	noFill();
	stroke(146, 255, 205);
	strokeWeight(5);
	beginShape();
	for(var theta = 0; theta <= radians(180); theta += radians(1)){
        x = a * cos(theta) * (pow(sin(theta * b), 3) + pow(cos(theta), 3));  
        y = a * sin(theta) * (pow(sin(theta * b), 3) + pow(cos(theta), 3)); 
        vertex(x, y)
	}
	endShape();
	pop();

}

For this project, I chose to explore the properties of the “Bean Curve,” essentially a curve shaped like a bean. After figuring out how to use the parametric equations, I experimented with implementing a series of beans that were arranged in a concentric shape and moved further apart with mouseX. From there, I tried plugging in different variables into this function to see what kinds of compositions I could create with different parameters.

LO – Info Visualization

Iris Yip
15-104 Section D
Looking-Outwards
Information Visualization

For this week I looked at nand.io and the way they synthesis information through custom data software. I took a look specifically at their project ‘Peak Spotting‘, which was a tool designed to visually manage Germany’s complex railroad network and its daily passengers.

Based on machine learning algorithms, it uses load and capacity prediction data heavily to allow traffic managers to look at data up to 100 days in advance so they can optimally calculate ticket prices and supply and service.

I was personally drawn to this project because of its amazing applications. Being able to predict data points up to 100 days in advance while being able to automatically generate concise and readable visual depictions of the data is a huge step in the automation of data visualization.

I also really enjoy the aesthetics of nand.io’s projects from a visual design perspective. The colors used are distinctive and readable yet aesthetically pleasing, making it functional and optimal for data visualization.

Project 7 – Compositions with Curves

For this project, I was inspired by an abstract interpretation of the human eye and wanted to include aspects of that into my project. It was sort of difficult getting my initial equation to work, but after adjusting it to cos/sin it worked a lot better. It also took me a long time to find ways of simplifying my code, since I wanted to work on keeping my code as concise as I can when possible, and to try to find the easiest way to create what I had in mind without extra steps.

sketch
//iris yip
//15-104 section D
//project 7

function setup() {
    createCanvas(480, 480); //canvas size
}

function draw() {
    background(0,5) //background opacity
    stroke(255)
    translate(240, 240); //position of interactive circle
    x = cos(frameCount / 30) * (4 * mouseX / 40 * (sin(frameCount / 30)) * 2 - frameCount / 30) //equation
    y = mouseY / 10; //Y position of mouse
    strokeWeight(x / 10)
    rotate(frameCount + x / 100); //action and framerate
  
  //coordinates (movement)
    point(x, y);
    point(y, x);
    point(-x, y);
    point(-y, -x);
}

LO 07

Title: Herald/Harbinger
Artists: Jer Thorpe & Ben Rubin

In the heart of Calgary, Alberta, an installation piece titled “Herald/Harbinger” brings to life the motion of Bow Glacier, demonstrating the connection between human activity and that of the melting glacier. A series of LED arrays installed at the entrance of a building use colored light to indicate real-time movements in the glacier; meanwhile, several speakers project the glacier’s subtle noises into the traffic-filled area. The lights and speakers are connected to the glacier via a seismic observatory and relayed via satellite, then put through an algorithm to visualize the data collected for display. Thousands of passersby feel the glacier’s presence every day, a reflection of how the glacier is an integral part of the city’s water source and history. However, the installation has a shelf life; it is a reminder that this glacier is melting, and there will be one day where the city sounds no longer duet those of Bow Glacier.

A video of the installation in action

Looking Outwards 7

For this looking outwards assignment, I decided to look at this chart that helped visualize food additives and where they are most commonly found. The reason why I chose this graph is because I’ve always been very health conscious and aware of what goes into my foods. Although I’ve always on and on about how unhealthy snacks can be.

Something that I really like about this work is asides from it’s informational purposes is how it is able to turn data that would normally be a bar chart into something easier to read that can communicate data on quantity on bar thickness like a pie chart but demonstrate the dramatic disproportionate distribution like a pie chart.

I think that they used algorithms that determined thickness as a proportion of the quantity and then just connected the points to the corresponding category.

Looking Outwards 07 – Notabilia

This week I’m discussing Moritz Stefaner’s “Notabilia”, a visual exploration of the most controversial corners of wikipedia. The diagram takes data from Wikipedia’s longest “deletion discussions”: arguments over whether to delete a page or not. Ranging from the absurd – “Object validity of Astrology” – to the hilarious – “List of similarities between Canada and New Zealand”.

Categorized into ‘the deleted’ and ‘the kept’, for whether the article in question was deleted or not, these threads visually show the rough, warped, messy work of distinguishing knowledge from misinformation. The artist managed to represent this highly abstract data in a comprehensible tangle, an impressive management of contradiction that makes it particularly interesting.

-Robert