Project – 07

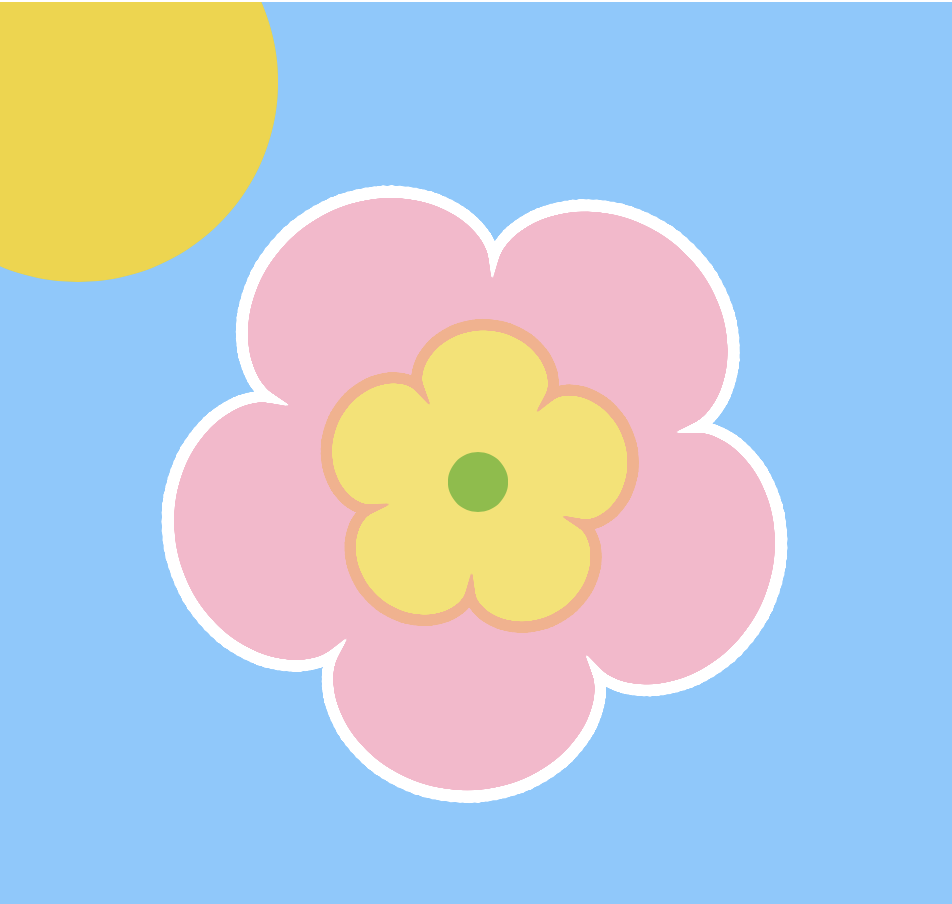
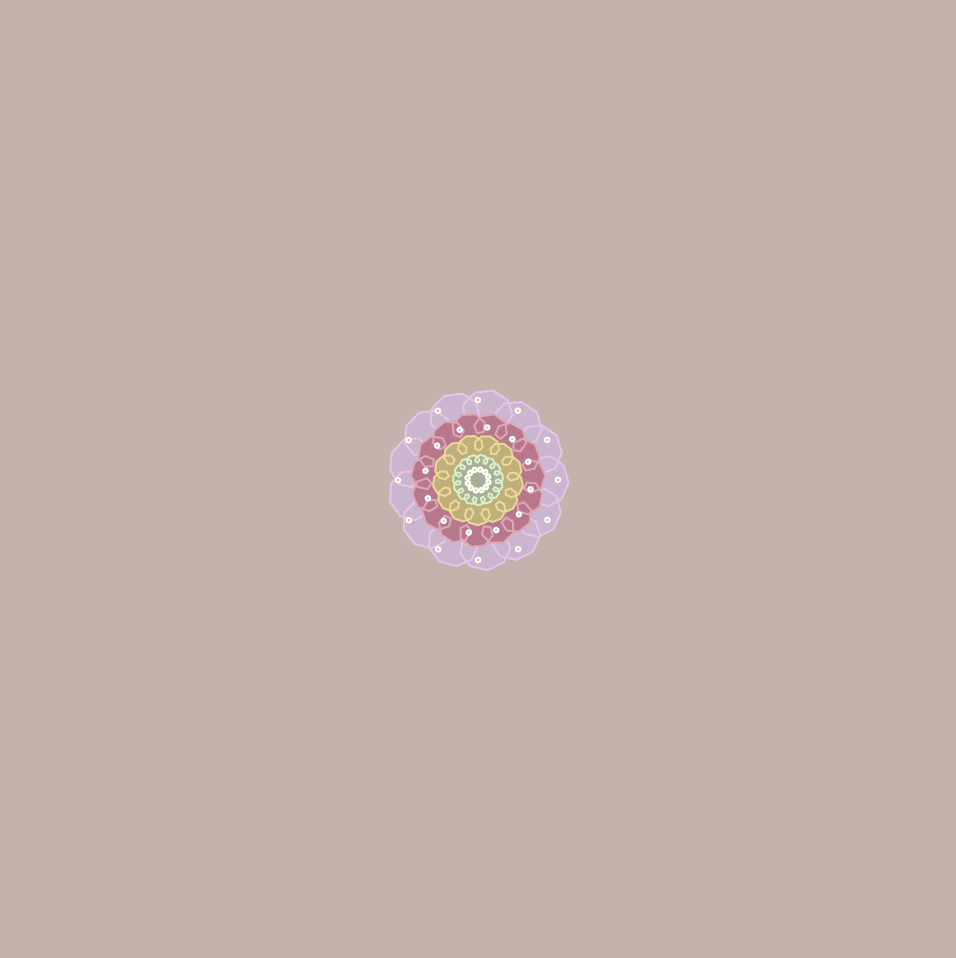
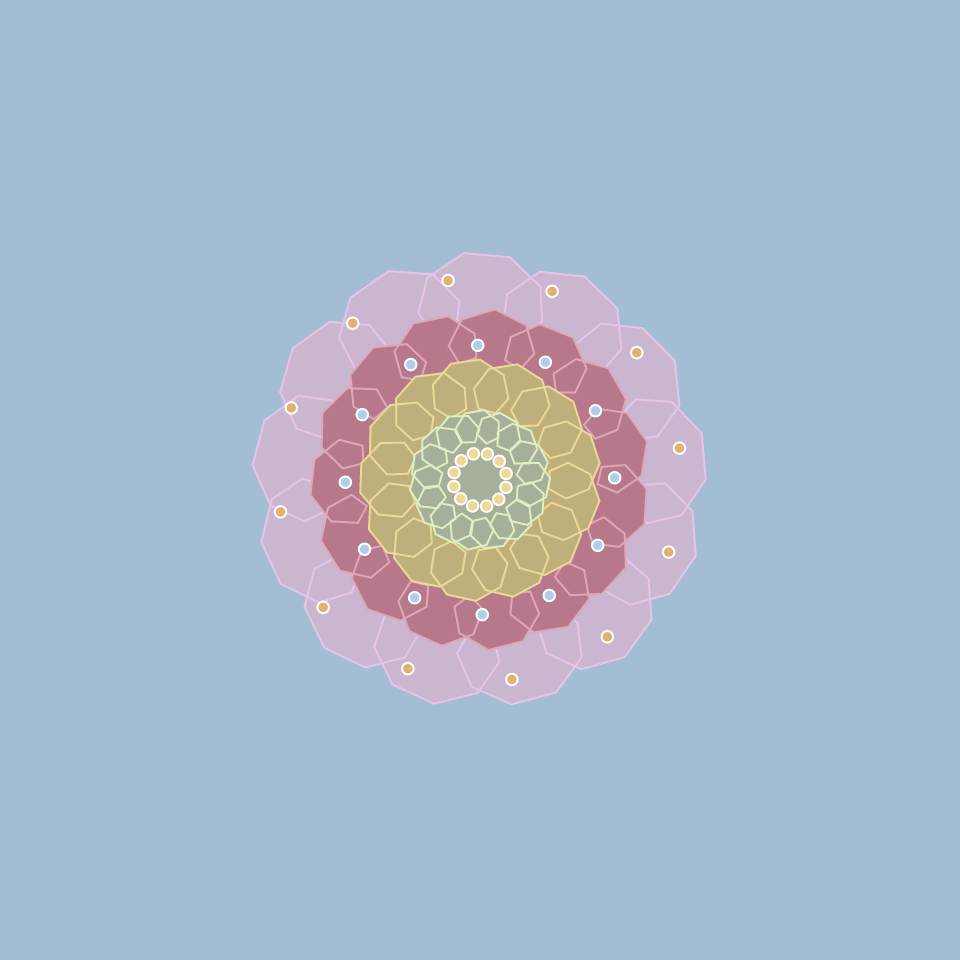
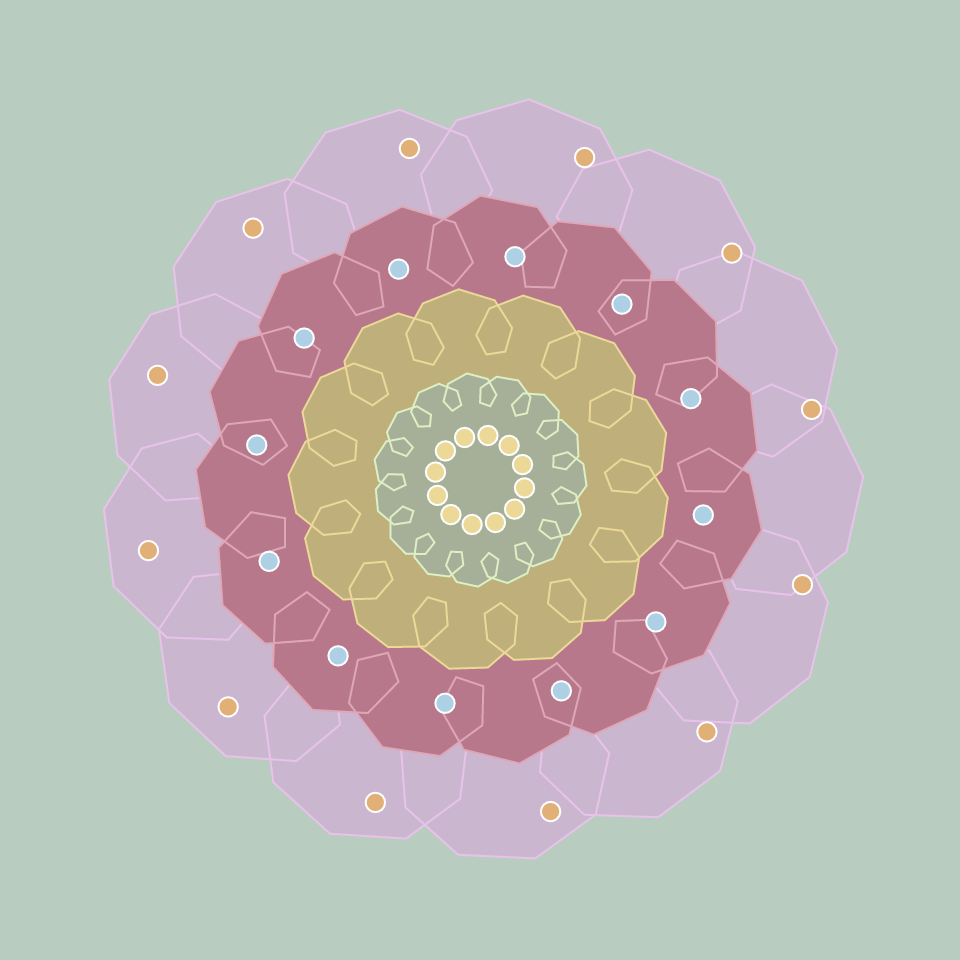
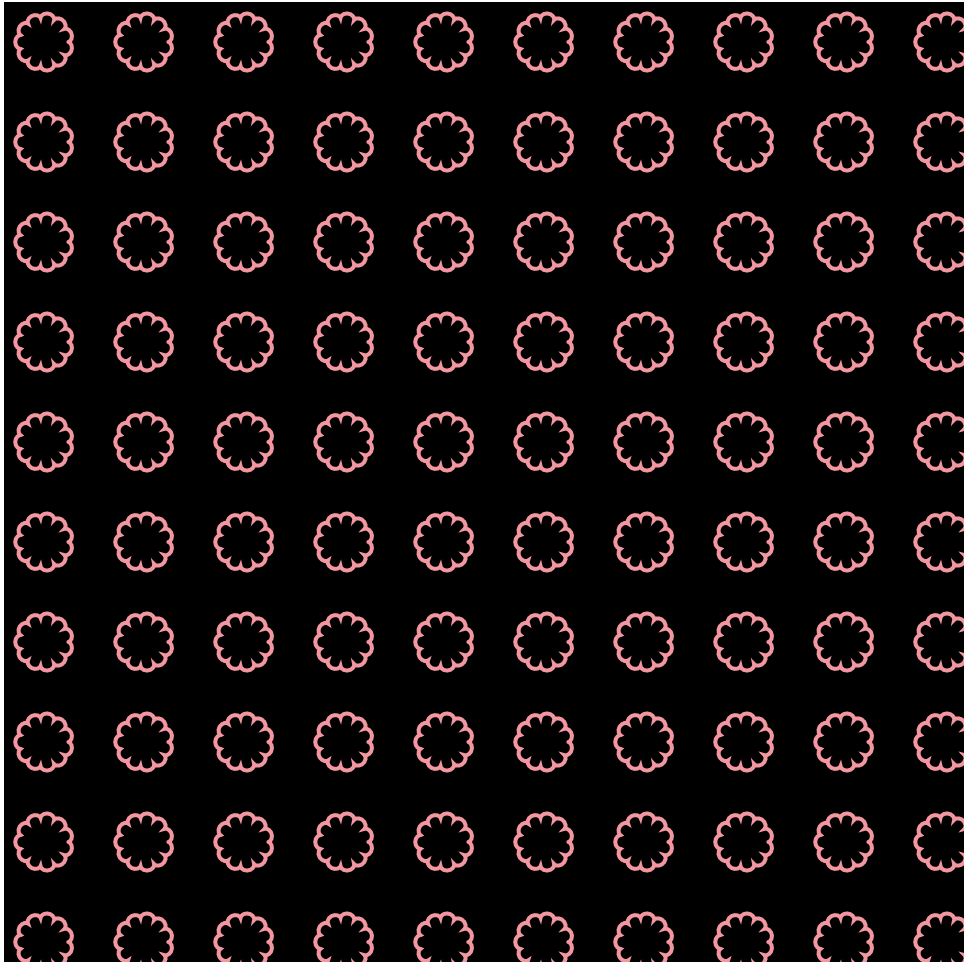
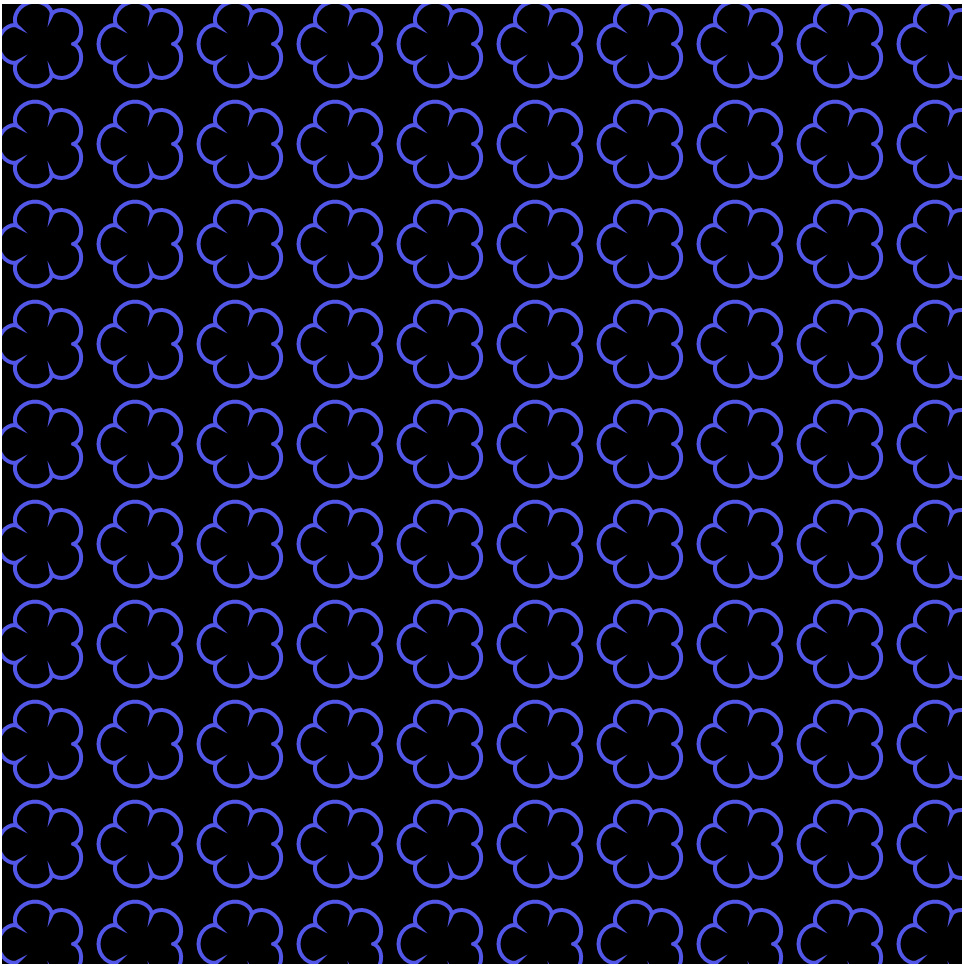
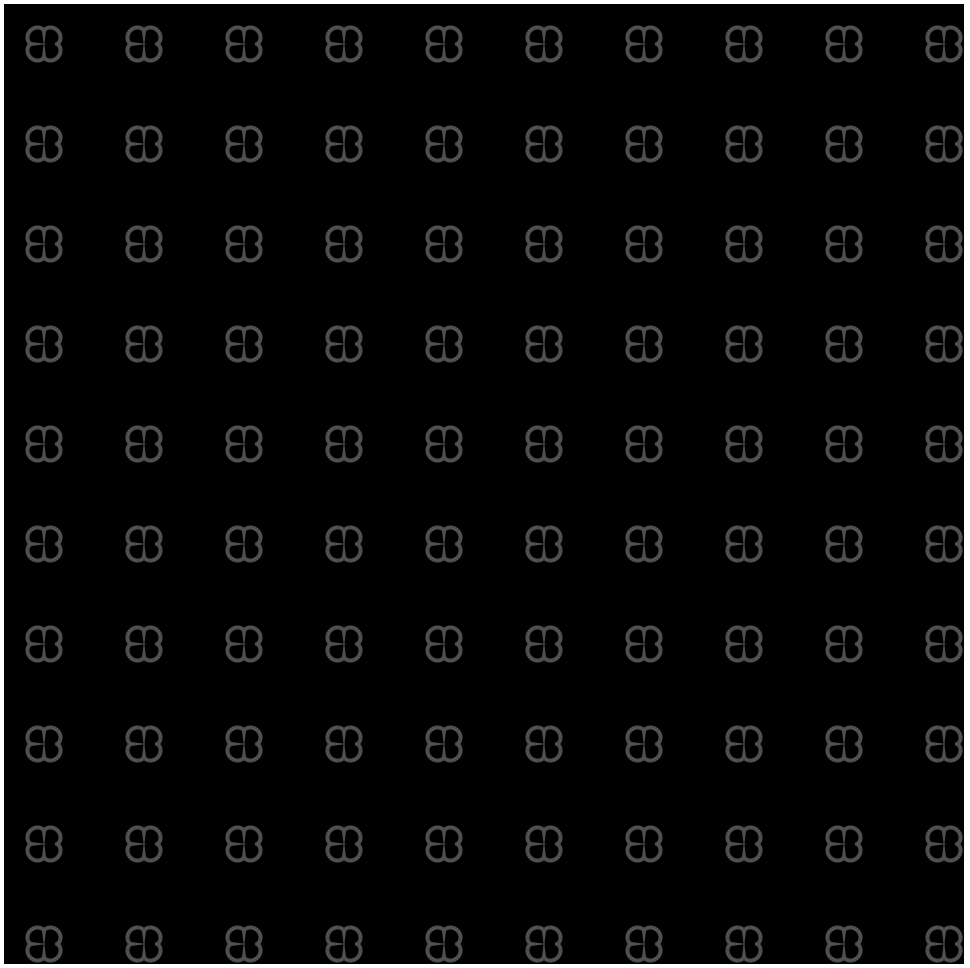
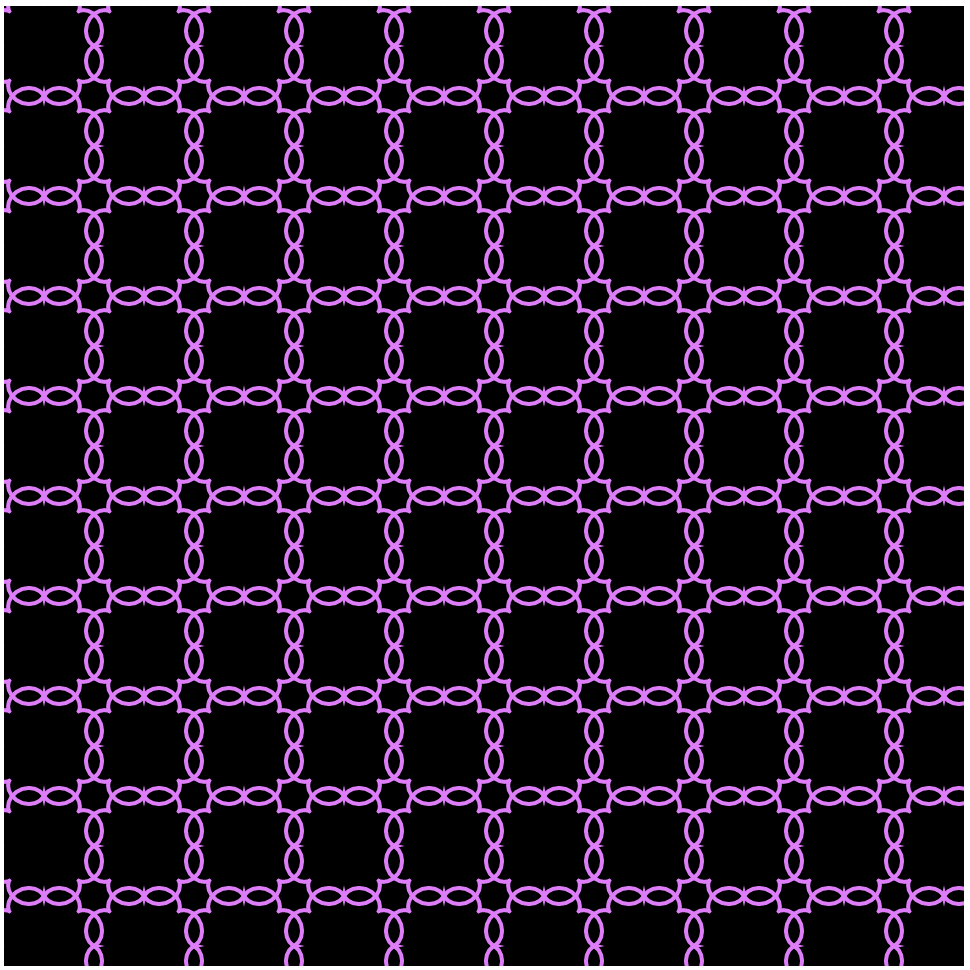
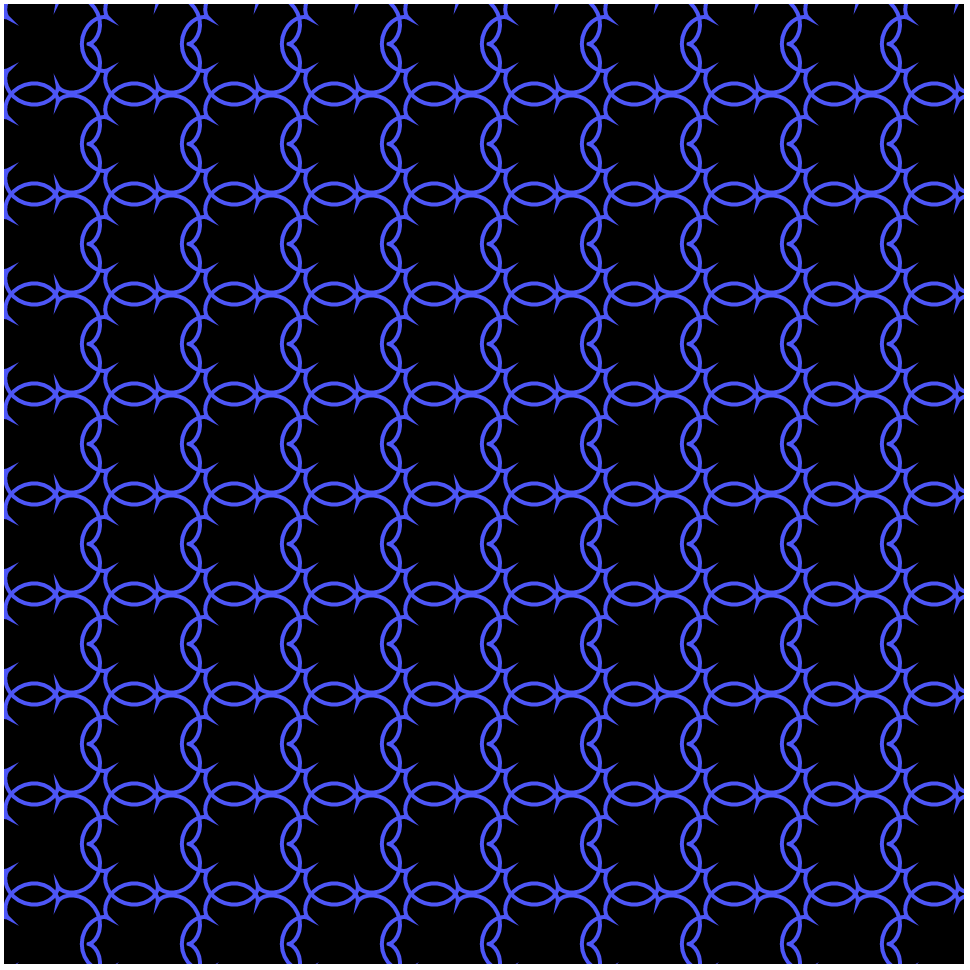
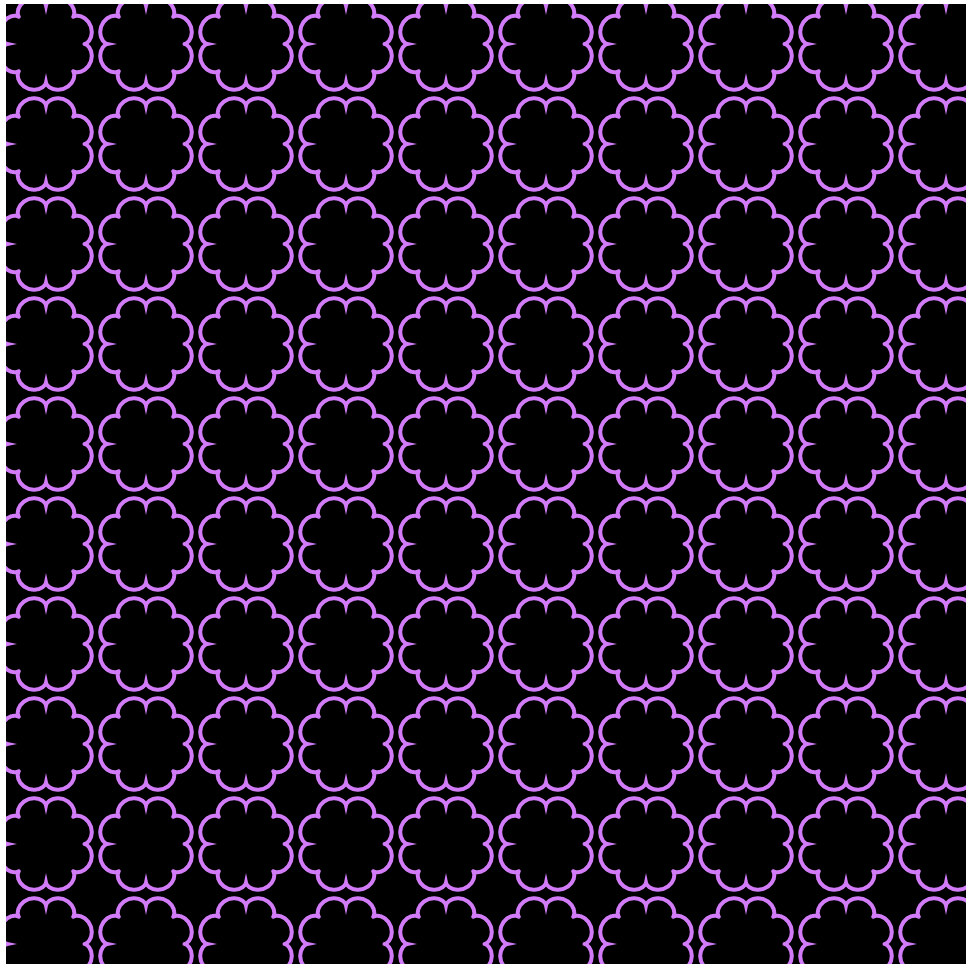
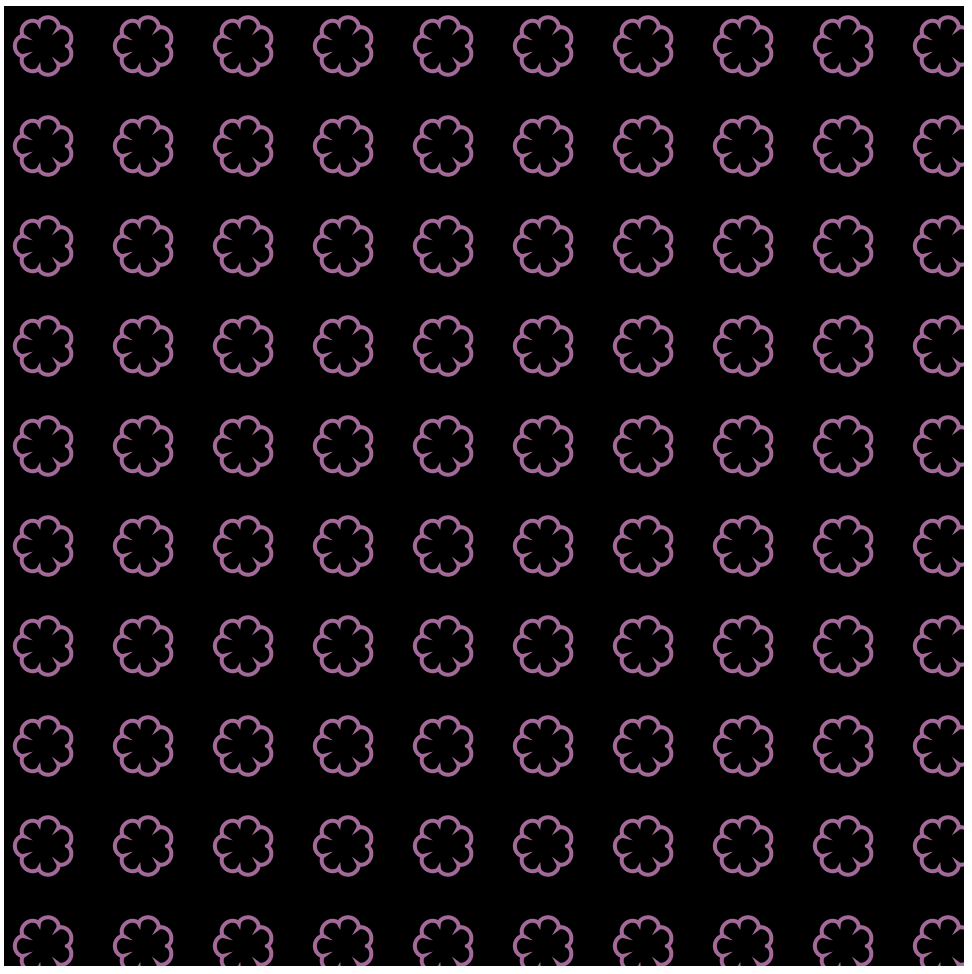
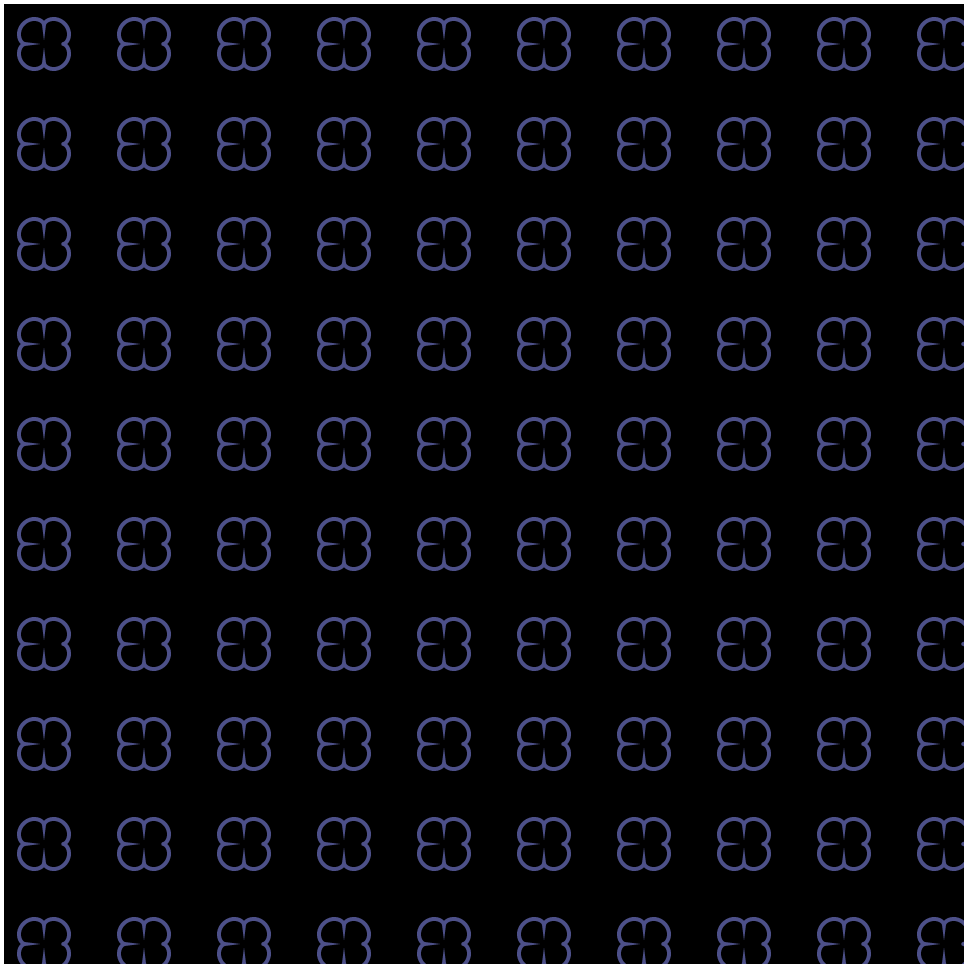
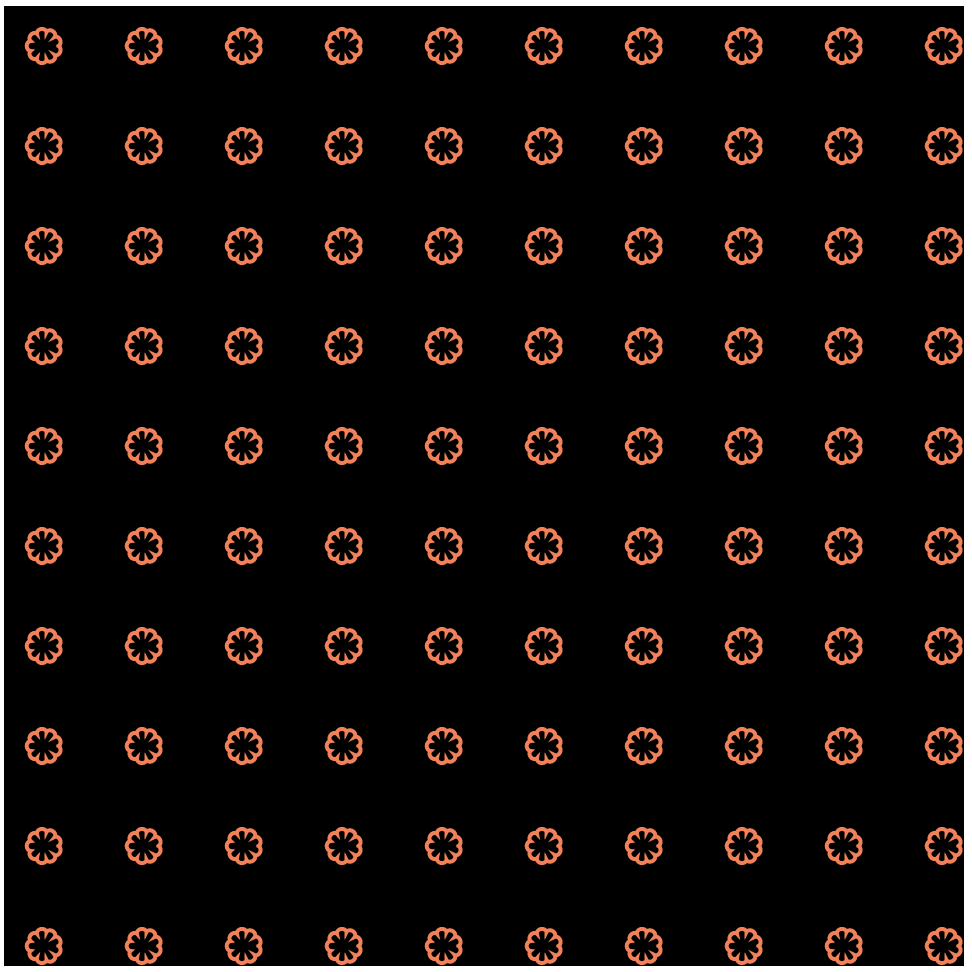
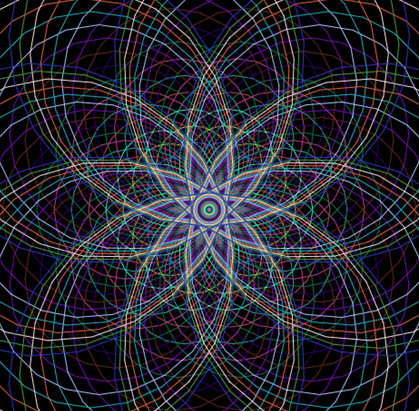
I chose to use the Ranunculoid Curve to create my project. When making it I noticed that the curve looks like a star when small with a larger stroke weight, so I set up my project to switch from day and night to see a star turn into a flower created by ranunculoid curves.

shapesDownload
var n = 50 //number of cusps
var angleRan1 = 0 //rotation of pink flower
var angleRan2 = 0 //rotation of yellow flower

function setup() {
    createCanvas(480, 480);
    background(220);
    frameRate(20);
}

function draw() {
	background(31, 45, 97); // night sky
	translate(width/2, height/2);
	//moon
	push();
    noStroke();
    fill(255);
    circle(-100, -150, 100);
    fill(31, 45, 97);
    circle(-75, -150, 100);
    pop(); 
	stroke(255);
	strokeWeight(5);
	push(); // rotate ranunculoid
	rotate(radians(angleRan1));
    angleRan1 += mouseY;
	drawRanun1();
	pop();
	push();
	rotate(radians(angleRan2));
	angleRan2 += mouseY + 90
	drawRanun2();
	pop();
	if (mouseX >= 100) {
		noStroke();
		fill(129, 191, 54);
		circle(0, 0, 30);
		//sun
		fill(240, 213, 36);
		circle(-200, -200, 200)
	}
}

//Ranunculoid Curve
function drawRanun1 () {
    //x = a[6cost-cos(6t)] y=a[6sint - sin (6t)] <- parametric equations
    var aRan1 = mouseX/50
    if (aRan1 <= 2) {
    	fill(251, 252, 182); //yellow when it is a star shape
    }else {
    	background(130, 201, 255); // day time
    	fill(252, 182, 203); //pink when its a flower shape
    }
    //curve
    beginShape();
    for(var i = 0; i < n; i += 0.1){
    	var xRan1 = aRan1 * (6 * cos(i) - cos(6 * i));
    	var yRan1 = aRan1 * (6 * sin(i) - sin(6 * i));
    	vertex(xRan1, yRan1);
    }
    endShape();
}
//inner flower
function drawRanun2 () {
	strokeWeight(5);
	fill(245, 226, 100);
	var aRan2 = mouseX/100
	if (aRan2 < 2) {
		stroke(255);
	} else {
		stroke(250, 175, 137);
	}
	//curve
	beginShape();
	for(var i = 0; i < n; i += 0.1) {
		var xRan2 = aRan2 * (6 * cos(i) - cos(6 * i));
    	var yRan2 = aRan2 * (6 * sin(i) - sin(6 * i));
    	vertex(xRan2, yRan2);
	}
	endShape();
}

LO- 07

The work I chose is “Facebook: Mapping the World’s Friendships” by Stamen Designs published in June of 2020.
This project is incredibly interesting as it takes data on the interconnectedness of Facebook’s users and turns the data into clean cut visuals on a map to illustrate the world’s friendships.
The countries are sorted by a combination of how many facebook friendships there are between countries as will as the total number of facebook friendships within one county.
The data isn’t only intriguing, it is also informative. Surprisingly, you can see a lot of history within the data, such as where countries have been. If one country has occupied another you can see the connectedness through peoples friends on facebook which is extremely interesting.
I really admire this work as it condenses large quanities of data into an easily undersood visual that can tell you more than you would ever expect.

LO: Information Visualization

Apricot Graph: Analysis of Apricot Trends from 2004 – 2016 (Rhythm of Food)

While I was looking through the list of recommended works, this one project by Moritz Stefaner stood out. Stefaner is an independent designer that specializes in data visualization. The project that stood out to me was “The Rhythm of Food,” which analyzes food seasonality. Using data from Google News Lab, they developed a new type of radial “year clock” graph that shows the seasonal trends of food. With the months spread evenly around the “clock”, viewers can easily distinguish when certain food items are popular in certain times of the year. We are able to see the general trend of any sort of food item and can search specifically for that item or browse food items based on seasonal popularity. The website “Rhythm of Food” showcase the findings and allow visitors to explore the data themselves. Personally, it was very fun and indulging to look through the numerous graphs. The project takes on food, an item very prominent in our lives and visualizes the data in a very appealing way.

Moritz Stefaner (Truth & Beauty): http://truth-and-beauty.net/projects/the-rhythm-of-food

Project 07: Curves

When looking through the curves, I thought it would be perfect to use them and create a flower with multiple layers. I decided to use the hypotrochoid and the epitrochoid curves with pastel-ish colors. As you move across x and y, the flower should grow in size relative to where mouseX and mouseY are. The background color also changes relative to the x and y positions of the mouse.

sketch
//Jessie Chen
//jessiech@andrew.cmu.edu
//D
//Project 07
//Curves

var nPoints = 100;
var angle = 0;
var radius = 200;
var r = 200;
var g = 170;
var b = 170;

function setup() {
    createCanvas(480, 480);
    frameRate(20);
}

function draw() {

    var xcolorchange = map(mouseX, 0, width, 0, 50);
    var ycolorchange = map(mouseY, 0, height, 0, 50);

    //slight change in the background as mouse moves across x and y
    background(r - ycolorchange, g + xcolorchange, b + ycolorchange);

    //origin at the center of the canvas
    translate(width/2, height/2);
    
    //purple layer of petals
    push(radians(angle));
    rotate(radians(-angle))
    angle += mouseX;
    stroke(240, 192, 236);
    //fill(152, 115, 148);
    fill(207, 181, 210)
    hypotrochoid(mouseX/2);
    pop()

    //pink layer of petals
    push();
    rotate(radians(angle));
    angle += mouseY;
    stroke(232, 164, 184);
    fill(193, 116, 139);
    epitrochoid(mouseX/3);
    pop(); 

    //yellow layer of petals
    push();
    rotate(radians(angle));
    angle += mouseX;
    stroke(239, 216, 142);
    fill(193, 175, 116);
    hypotrochoid(mouseX/4);
    pop();

    //green layer of petals
    push();
    rotate(radians(angle));
    angle += mouseY;
    stroke(216, 240, 192);
    fill(164, 176, 148);
    epitrochoid(mouseX/8);
    pop();

    //orange circles
    push();
    rotate(radians(angle));
    angle += mouseX;
    radius = mouseX/3;
    fill(164, 209, 232);
    circles(radius);
    pop();

    //blue circles
    push();
    rotate(radians(angle));
    angle += mouseY;
    radius = mouseX/2;
    fill (233, 175, 109);
    circles(radius);
    pop();

    //yellow circles
    push();
    rotate(radians(angle));
    angle += mouseX;
    radius = mouseX/15;
    fill(239, 216, 142);
    circles(radius);
    pop();
}


function epitrochoid(size) {
    var x;
    var y;
    var a = size;
    var b = a/15;
    var h = constrain(mouseY/30, a/5, b*5);

    beginShape();
    for(var i = 0; i<nPoints; i++) {
        var t = map(i, 0, nPoints, 0, TWO_PI);
        x = (a + b) * cos(t) + h * cos(((a + b) / b) * t);
        y = (a + b) * sin(t) + h * sin (((a + b) / b) * t);
        vertex(x, y);
    }
    endShape(CLOSE);
}

function hypotrochoid(size) {
    var x;
    var y;
    var a = size;
    var b = a/15;
    var h = constrain(mouseY/30, a/5, b*10);
    var ph = mouseX/60;

    beginShape();
    for (var i = 0; i < nPoints; i++) {
        var t = map(i, 0, nPoints, 0, TWO_PI);
        x = (a - b) * cos(t) + h * cos(((a - b) / b) * t);
        y = (a - b) * sin(t) + h * sin (((a - b) / b) * t);
        vertex(x, y);
    }
    endShape(CLOSE);
}

//array of circles
function circles(radius) {
    for (t = 0; t < 360; t = t + 30) {
        var x = radius * cos(radians(t));
        var y = radius * sin(radians(t));
        stroke(255);
        ellipse(x, y, mouseX/35, mouseX/35);
    }
}

Project 7 Curves

sketch

var numpoints = 200;

function setup() {
    createCanvas(400, 400);
    frameRate(10);
    noStroke();
}


function draw() {
    background(14,0,54);
    noFill();

    for (i = 1; i < 4; i+=2) { //two left deltoids
    strokeWeight(0.3);
    stroke(201,255,175);
    push();
    translate(width/4,height*i/4);
    deltoid();
    pop();
    }
 
    for (i = 1; i < 4; i+=2) { //two right deltoids
    strokeWeight(0.3);
    stroke(201,255,175);
    push();
    translate(width*3/4,height*i/4);
    deltoid();
    pop();
    }
    
    var c = color(255,202,map(mouseX,0,width,150,225)); // color change for the cornoid
    push();
    strokeWeight(1);
    stroke(c);
    translate(width/2,height/2);
    cornoid();
    pop();
}

function cornoid() {
  var x;
  var y;
  var a = map(mouseX,0,width,100,200); //a value changes according to mouseX, and mapping the value 
  
  beginShape();
  for (var i = 0; i < numpoints; i++ ) {
    var t = map(i, 0, numpoints, mouseY, 200); //theta changes according to the mouseY
    x = a*cos(t)*(1-2*sin(t)*sin(t));
    y = a*sin(t)*(1-2*cos(t)*cos(t));
    rotate(mouseY); //rotating according to mouseY
    vertex(x,y);
  }
  endShape();
}

function deltoid() {
  var x;
  var y;
  var a = map(mouseY,0,height,10,60); //a value changes according to mouseY, and mapping the value 
  
  beginShape();
  for (var i = 0; i < numpoints; i++ ) {
    var t = map(i, 0, numpoints, 0, mouseX); //theta changes according to the mouseX
    x = a/3*(2*cos(t)+cos(t*2));
    y = a/3*(2*sin(t)-sin(t*2));
    rotate(mouseY); //rotating according to mouseY
    vertex(x,y);
  }
  endShape(CLOSE);
}

Looking Outwards 07: Information Visualization

Looking Outwards 07: Information Visualization

Santiago Ortiz’s Lostalgic was interesting to me. He visualized all the scripts of ABC’s LOST TV show. It is interesting to see how a lot of text is organized and visualized in an interesting format. I like how the text data is translated into interactive visual experience. It is interesting to see heavy data at a glance, and also be able to look closely into the details. I am not sure of what kind of algorithms that generated the work, but I suppose he used some kind of conditionals and loops to organize the data into different episodes and scenes. This work is an interesting experience in which I can read the series in a different, interactive way.

http://intuitionanalytics.com/other/lostalgic/

Looking Outwards 7

For this week, I chose to focus on Stamen’s project called “Getty Institute: Ed Ruscha’s Photo Archive”, a computational organization and documentation of Ed Ruscha’s photo archives of Los Angeles. These photographs were taken from a car-mounted camera, which when driven, would document the buildings and street views of Los Angeles’ Sunset Strip. This documentation continued every few years, creating a dynamic record of the changing views of the street. 

The photos, however, were never digitized, which made it hard to visualize the change in the strip over time: hence the implication of the dynamic interface created. With the use of “AI-generated tags”, Stamen was able to sort through the photos and create an interface that allows the user to virtually “drive” through the street and visualize the change over time. The interface simultaneously shows multiple years of change stacked on top of each other as the user “drives” through the map that is sandwiched in the middle. One is also able to zoom or sort through specific photos with keywords. This project is therefore a combination of both the algorithms created that easily sorts and orders photos, and the ‘creative’ part of the interface that allows the user to drive the car.

Capture of the Interface itself

Project 07-Curves

project07-curves
/*
Lauren Kenny
lkenny@andrew.cmu.edu
Section A

This program draws a grid of Epicycloids.
Functions for this shape where adapted from 
https://mathworld.wolfram.com/Epicycloid.html.

*/


//sets up the canvas size and initial background
function setup() {
    createCanvas(480, 480);
    background(220, 100, 100); 
}

//draws a grid of epicycloids
function draw() {
    translate(20, 20);
    background(0);
    strokeWeight(2);
    noFill();

    //color changes with mouse position
    //red and green change with y position
    //blue changes with x position
    var r=map(mouseY, 0, height, 80, 255);
    var g=map(mouseY, 0, height, 80, 120);
    var b=map(mouseX, 0, width, 80, 200);
    
    for (var row=0; row<width-20; row+=50) {
        push();
        for (var col=0; col<height-20; col+=50) {
            stroke(r, g, b);
            drawEpicycloid();
            translate(0, 50);
        }
        pop();
        translate(50, 0)
    }
}

//draws a singular epicycloid
function drawEpicycloid() {
    var minPetal=6;
    var maxPetal=10;
    var minSize=4;
    var maxSize=8;
    //number of petals increases as y position of mouse increases
    var numPetals = int(map(mouseY, 0, height, minPetal, maxPetal));
    //size of shape increases as x position of mouse increases
    var size = (map(mouseX, 0, width, minSize, maxSize))/(numPetals/2);

    beginShape();
    for (var i=0; i<100; i++) {
        var t = map(i, 0, 100, 0, TWO_PI);
        var x = (size * (numPetals*cos(t) - cos(numPetals*t)));
        var y = (size * (numPetals*sin(t) - sin(numPetals*t)));
        vertex(x, y);
    }

    endShape();
}

For this project I was really interested in the epicycloid because of the variation that could be added to the number of petals. In my program, I explored altering the number of petals in relation the mouse y position. I also added a variation in the size based on the mouse x position. It was fun to figure out through experimenting what each variable in the formula affected within the actual shape. Here are some screen shots with different mouse positions.

Looking Outwards-07

http://intuitionanalytics.com/other/knowledgeDatabase/

http://moebio.com/research/sevensets/

This project titled “Personal Knowledge Database” was created by Santiago Ortiz. In this computational project, Santiago catalogues his internet references collected over more than 10 years. These references include projects, wikipedia articles, images, videos, texts, and many others. All of these references are organized into an isomorphic 7 set Venn diagram that tries balance each section. The 7 categories in this Venn diagram are humanism, technology, language, science, interface, art, and networks. He has also included 19 filters based on the source of the reference (ie. Image, post, blog, book, etc.).

What I absolutely love about this project is the self-reflection of his own digital searches and references. I think looking at 10 years of this data can teach you a lot about yourself, and I’ve always admired large scale self-reflection. What is also amazing about this project, is that all of these references are embedded into the interface, so with one click you can access any of the information. This project shows a lot about this artist’s sensibilities, and I admire them very much. I would be curious to know how Santiago feels after cataloguing this much personal data and finding patterns.

One other comment I have about this work is that I find it a bit hard to keep track of the category overlaps with the main Venn diagram. With the colored archetype, you are given a list of which colors are overlapping with each section you hover over. I wonder if this would be a helpful section to be utilized in the main project.

Project-07: Artistic Curves

I really wanted to create a psychedelic piece with curves. To do this, I made a rainbow effect of colors. The main aspect of the art was a hypotrochoid. This is made with a fixed circle and lines created by another circle rolling along the edge. The piece changes different mathematical aspects of the hypotrochoids based upon the position of the mouse. The curve is created with parametric equations based upon the radius of the fixed circle and the radius of the moving circle. These are the elements that are adjusted with the mouse. The loops created many hypotrochoids and in certain positions on the canvas, this can make very interesting designs.

sketchDownload
function setup() {
    createCanvas(480, 480);
    background(220);
    frameRate(20);
}

function draw() {
    background(0);
    //moves the shapes to the center of the canvas
    translate(width/2, height/2);
    for(var i = 0; i<20; i++){
        stroke(random(255), random(255), random(255)); //randomizes colors
        noFill();
        //creates loop of hypotrochoids based upon mouse position
        hypotrochoid(i*mouseX*.5, i*mouseY);
    }
}

//defines the shape hypotrochoid
//https://mathworld.wolfram.com/Hypotrochoid.html
function hypotrochoid(a, mouseY){
    var x; //used for parametric form
    var y; //used for parametric form

    var a; //radius of the fixed circle
    var b = a/10 //radius of the rolling ball
    var h = constrain(mouseY/10, 0, a) //var h depends on mouseY and restricted

    //defines the actual shape
    beginShape();
    for (var i = 0; i < 200; i++){
        var t = map(i, 0, 600, 0, 6*PI);
        x = (a-b)*cos(t)+h*cos(((a-b)/b)*t); //parametric equation for x
        y = (a-b)*sin(t)-h*sin(((a-b)/b)*t); //parametric equation for y
        vertex(x,y);
    }
    endShape(CLOSE);
}