Project 07 Curves

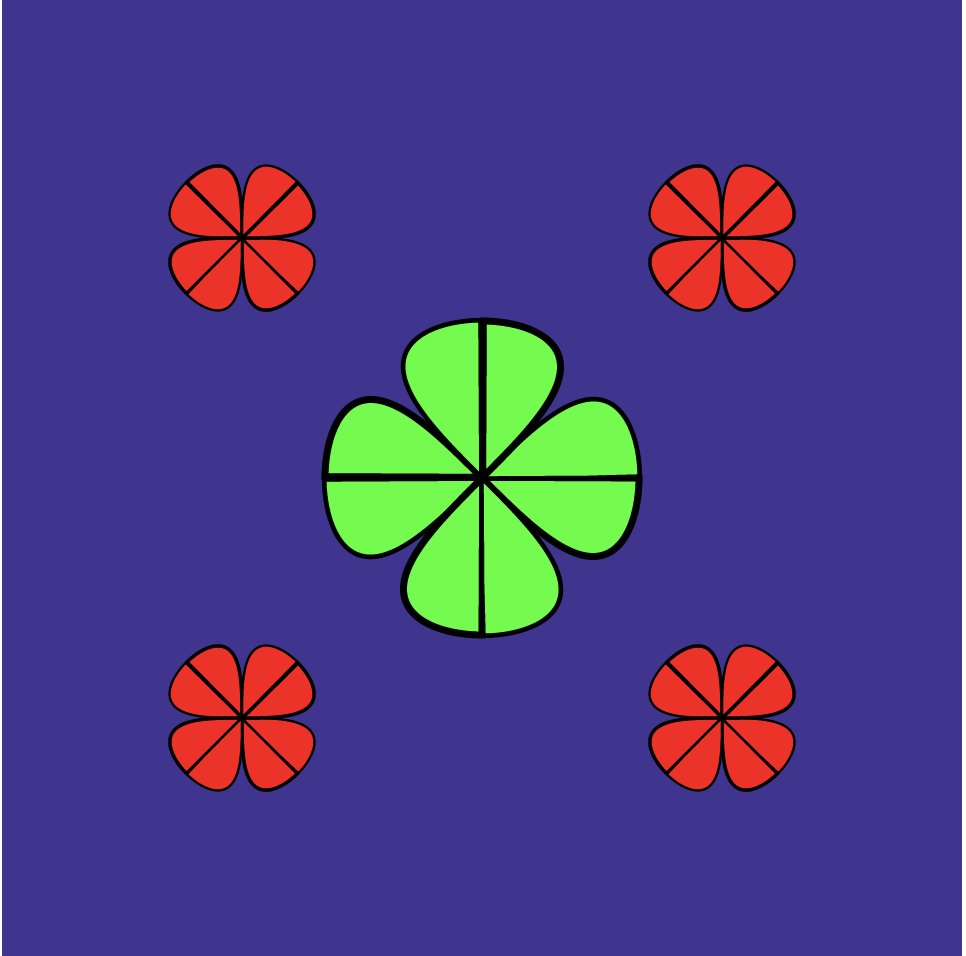
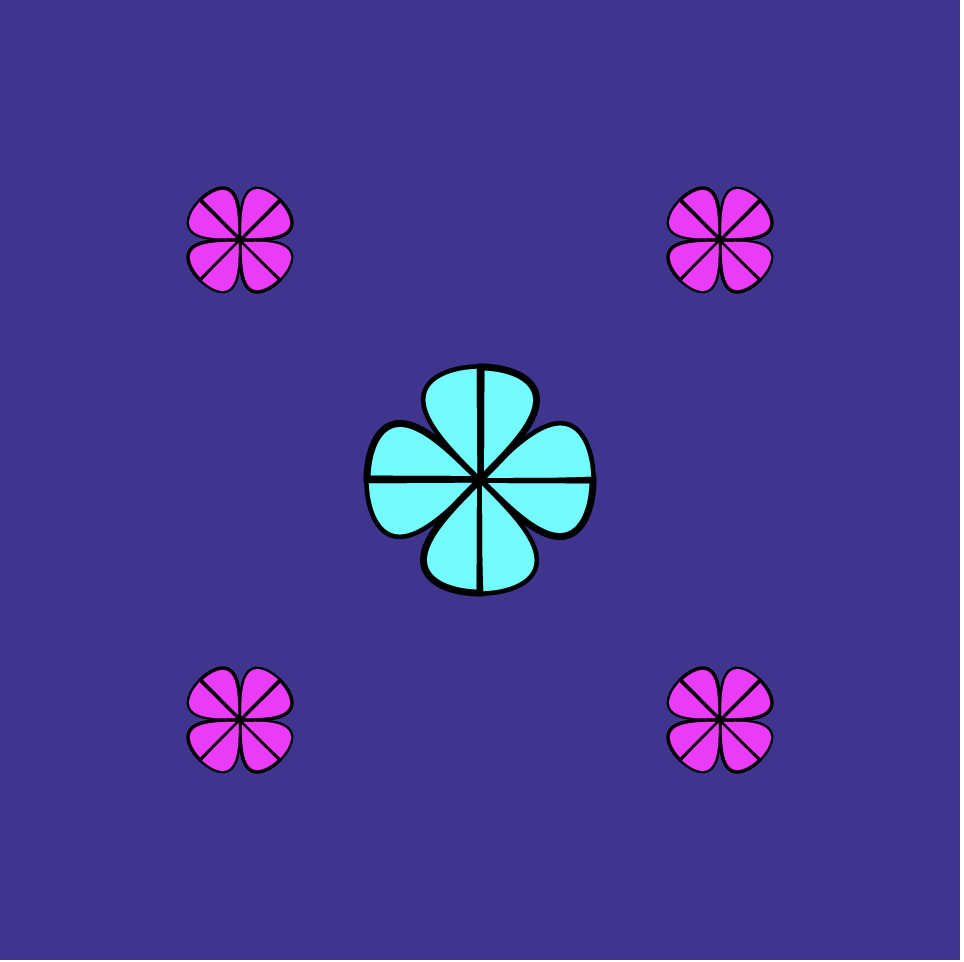
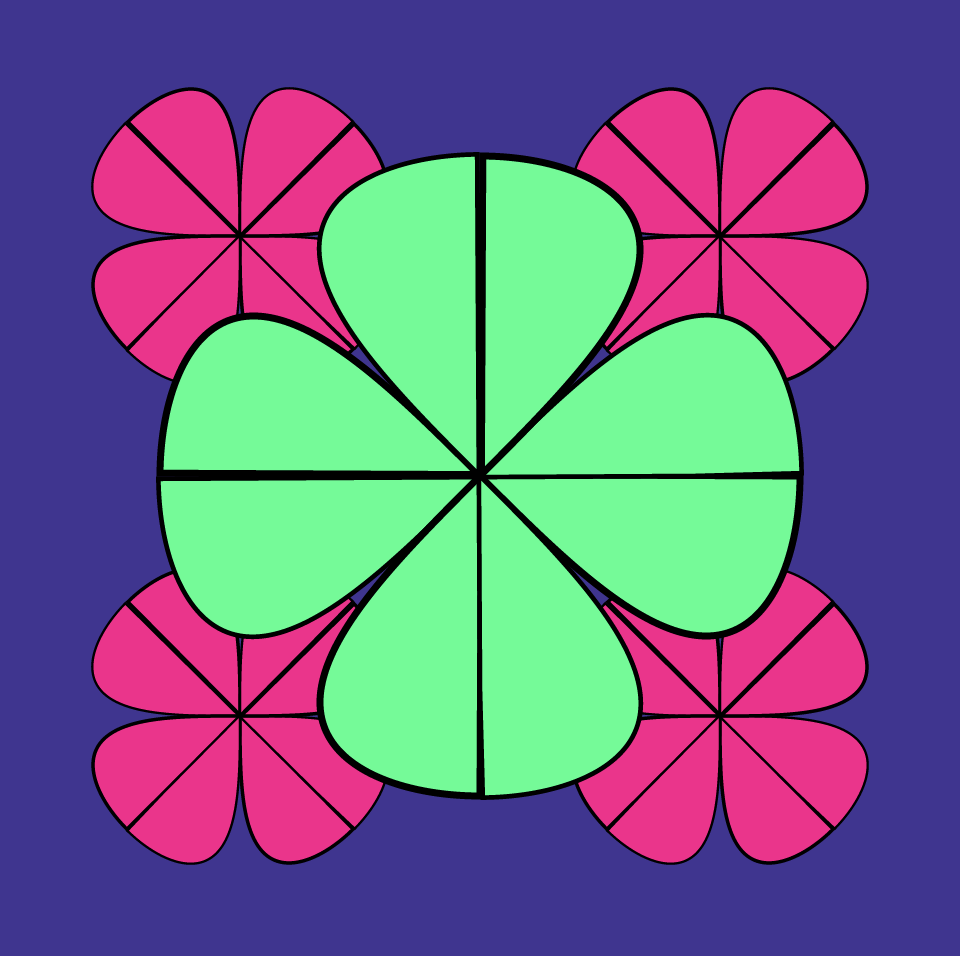
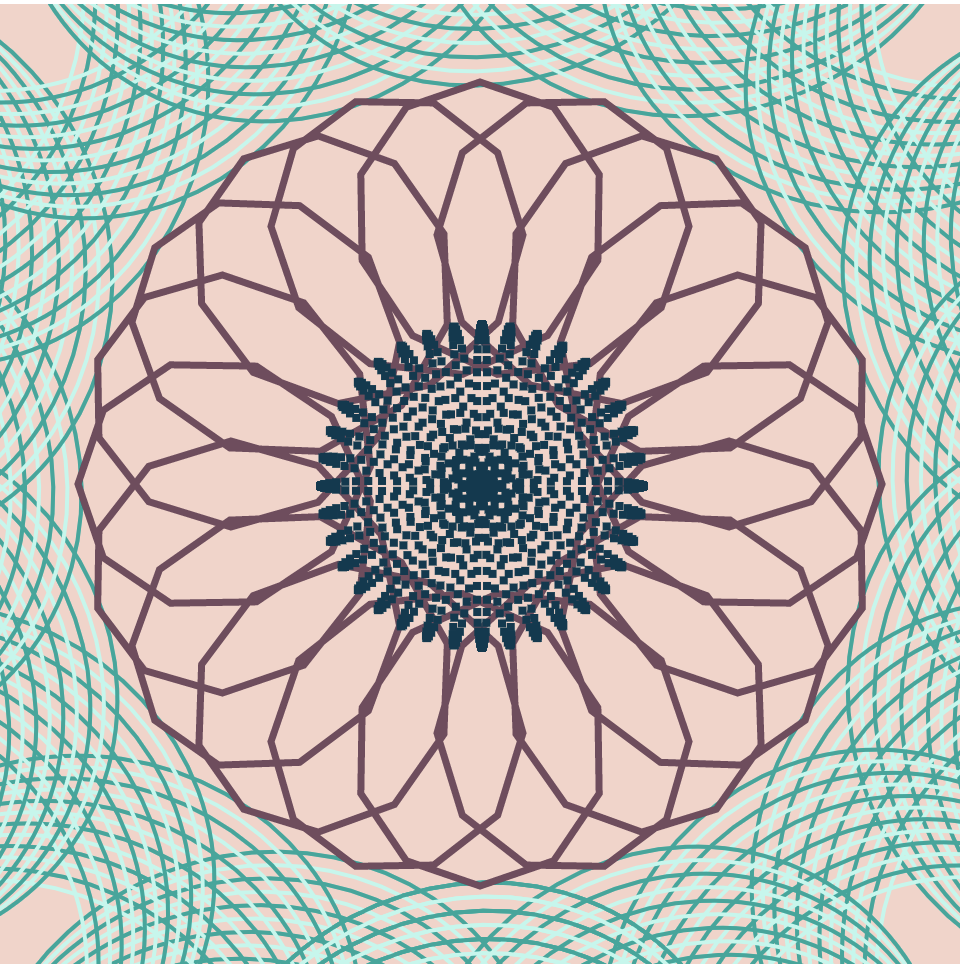
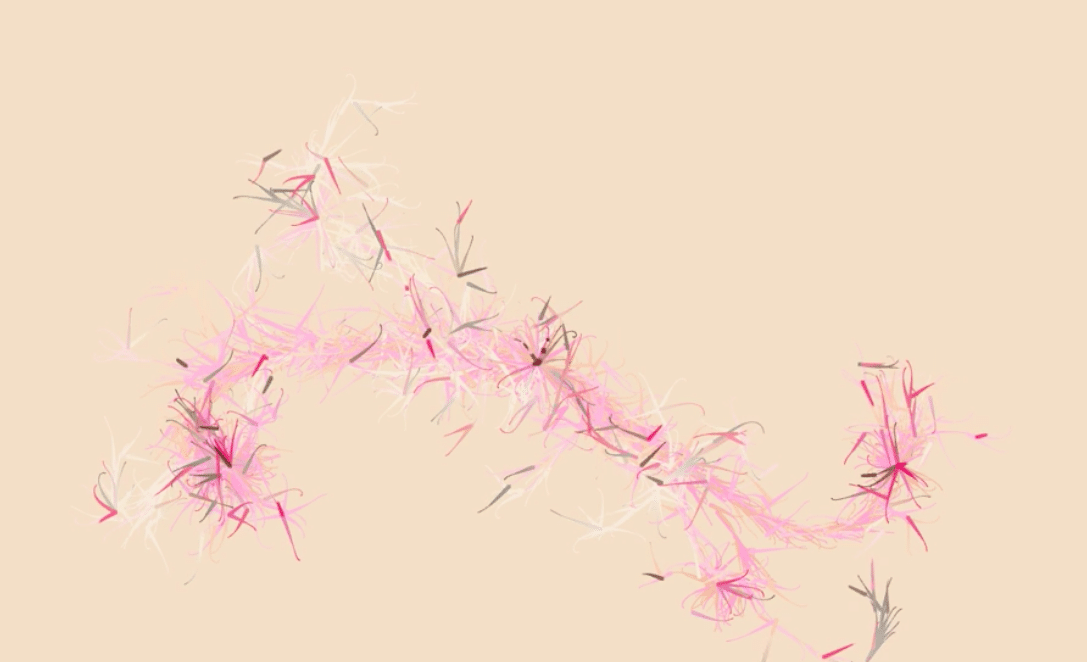
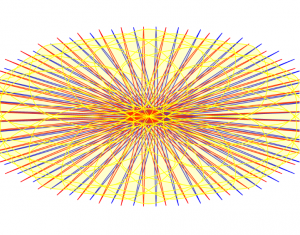
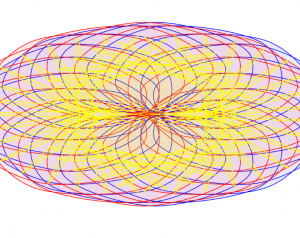
My process for this project was to find a curve I wanted to start with, I started working with a lemniscate and realized I can make flowers out of the infinity symbol. I wanted to make something infinity symbol related but I realized flowers are pretty and work well with the shape. I then made the sizes of the flowers change and the colors change based on the mouseX and mouseY positions.

sketchDownload
function setup() {
    createCanvas(480, 480);
}
function draw() {
  background(66,49,148);
  var P=color(mouseX,0,mouseY);    //small flowers
  var R=color(0,mouseX,mouseY);    //big flower
  push();
  fill(P);
  push();
  translate(width/(4/3),height/4);
  scale(.5);
  rotate(radians(45));
  drawCurve();    //small flower top right
  push();
  rotate(radians(90));
  drawCurve();    //small flower top right
  pop();
  pop();
  push();
  translate(width/(4),height/4);
  scale(.5);
  rotate(radians(45));
  drawCurve();    //small flower top left
  push();
  rotate(radians(90));
  drawCurve();    //small flower top left
  pop();
  pop();
  push();
  translate(width/(4/3),height/(4/3));
  scale(.5);
  rotate(radians(45));
  drawCurve();    //small flower bottom right
  push();
  rotate(radians(90));
  drawCurve();    //small flower bottom right
  pop();
  pop();
  push();
  translate(width/(4),height/(4/3));
  scale(.5);
  rotate(radians(45));
  drawCurve();    //small flower bottom left
  push();
  rotate(radians(90));
  drawCurve();    //small flower bottom left
  pop();
  pop();
  pop();
  push();
  fill(R);
  translate(width/2,height/2);
  push();
  drawCurve();   //big flower
  pop();
  push();
  rotate(radians(90));
  drawCurve();    //big flower
  pop();
}

function drawCurve() {
  var a=constrain(mouseX/2,0,width);
  strokeWeight(3.5);
  beginShape();
  var nPoints=360;
  for(var i=0; i<nPoints; i++){
    var t=map(i,0,nPoints,0,PI);    //lemniscate formulas
    x=(a*cos(t))/(1+sin(t)^2);
    y=(a*sin(t)*cos(t))/(1+sin(t)^2);
    vertex(x,y);
  }
  endShape(CLOSE);
  push();
  beginShape();
  scale(.67)
  var nPoints=360;
  for(var i=0;i<nPoints;i++){
    var r=map(i,0,nPoints,0,-PI);    ///other half of lemniscate
    x=(a*cos(r))/(1+sin(r)^2);
    y=(a*sin(r)*cos(r))/(1+sin(r)^2);
    vertex(x,y);
  }
  endShape(CLOSE);
  pop();
}

Project-07-Curves

sketch
//Ian Lippincott
//ilippinc
//Section D


//orange
//fill(240, 147, 109);
//blue
//fill(49, 57, 75);
//cream
//fill(255, 255, 226


var nPoints = 500;
var angle = 30;

function setup() {
    createCanvas(480, 480);
}

function draw() {
    background(49, 57, 100);
    //draw 2 sets of 36 hypotrochoids 
    for (var x = 80; x <= 400; x += 64) {
        for (var y = 80; y <= 400; y += 64) {
            push();
            translate(x, y);
            rotate(mouseX/20);
            drawEpitrochoid();
            pop();
        }
    }
}

function drawEpitrochoid() {
    var a = map(mouseX, 0, 480, 0, 120); 
    var b = map(mouseX, 0, 480, 0, 40); 
    var h = map(mouseY, 0, 480, 0, 40); 
    strokeWeight(4);
    //Cream Stroke
    stroke(255, 255, 226);
    //Orange Fill
    fill(240, 147, 109); 
    //Draw Epitrochoid
    beginShape(); 
    for (var i=0; i<nPoints; i++) {
        var angle = map(i, 0, 80, 0, TWO_PI);
        x = (a+b) * cos(angle) - h * cos(((a+b)/b) * angle);
        y = (a+b) * sin(angle) - h * sin(((a+b)/b) * angle);
        vertex(x, y);
    }
    endShape();
}

LO-07: Expression of Elements

Artist: Nicholas Felton
Piece: Elements
Date: 2017-Present

Felton with his piece “Elements” created a better experience for learning. In a concept like the periodic table, many elements are hard to visualize. Felton creates impressive 3D renderings to show what each element looks like in its natural state. Felton described the purpose of this piece is to practice techniques needed to show different states of matter. Additionally, with some elements only having slight differences between one another, the level of detail needed is a good way for him to practice micro-details in renderings. Felton’s artistic sensibilities are shown through the attention to detail and the interpretation of elements that are not easily visualized. The best example is hydrogen. Hydrogen is not an element seen by the human eye, but by utilizing computational tools, Felton was able to create an accurate depiction of the element. The piece also shows the position on the periodic table as well as the electron shells. The artwork not only is creative in its interpretations, but scientifically accurate. Creations like this are improving education and understanding of difficult concepts.

http://feltron.com/Elemental.html

Feltron: Elemental
Visual Representation of Hydrogen

Looking Outwards 07

Nicholas Feltron is an artist who uses code and computation to create his art. This piece I would like to talk about is on his website labeled BikeCycle. It shows a couple of different scenes that focus on the activity, popular routes, stations, bikes, and cyclist demographics within New York city. I admire this piece because I grew up being in the city weekly, it seems very cool to see my second home mapped out via bike schedules and routes. This piece was commissioned by the MoMA store. I am not sure how this dataset was collected and what algorithms were used in the making of this piece. This artist has a variety of computer generated informational art, as this seems to be his main artistic style.

http://feltron.com/BikeCycle.html

Looking Outwards 07: Information Visualization

Facebook Stories: Virality by Rachel Binx
https://rachelbinx.com/Facebook-Stories-Virality
jwesthei, Section B

This project is a play on the concept of going “viral” and how this can be visualized. Aesthetically very similar to the “Self-Dividing Line” project I reviewed last week, this one visualizes how one a piece of media (in this case three of the most shared images on Facebook) ends up being shared hundreds of thousands of times on a social media platform.

A screenshot of one of the videos from Rachel Binx’s “Facebook Stories: Virality” project (2013).

The pieces start as a single person and split off into branches as the media is shared. As the piece becomes shared and re-shared, the project visualizes the gender of the person sharing it as well as the relative age of the share as time progresses. The artist worked with Zach Watson to create the algorithm using the WebGL framework and animate this. I could not find a lot of information about the specifics of the algorithm used, but I would imagine it is similar to that of the “Self-Dividing Line,” where instead of randomly generated midpoints to split from, the time and number of branches come from actual data defining a shared media.

Project : 07

sketch For this project, I decided to use three different kinds of curves and represent them in different ways in order to create an interesting hierarchy of visuals and different point on the canvas.
//Aadya Bhartia
//Section A 
//abhartia@cmu.edu

/*The code aims to use three main types of curves and modify them based on the X and Y position the mouse
Each set of curves are represented in different ways making the code more visually interesting */

var angle = 0;
var numP = 10000;

function setup() {
    createCanvas(480, 480);
}

function draw() {
	background(245, 211, 200);
	var midX = width/2;
	var midY = height/2;
	var currentX = constrain(mouseX, 0, midX);
	var currentY = constrain(mouseY, 0, midY);
	noFill();
	translate(midX, midY); //transa;lting origin to centre of canvas 
	var m = map(constrain(mouseX, 0, width), 0, width, 0,width/60);
	push();
	rotate(radians(angle));
	angle +=mouseY/4; // making the set of curves rotate based on mouse position
	drawHypotrochoid1(currentX,currentY); 
	pop();
	drawHypotrochoid2();
	drawRose(m);
}
//Rose rhodonea curve set mapped with rectangles
function drawRose(m){
	fill(2, 58, 80); //dark blue 
	noStroke();
	var roseW = 18;
	for(var i = 0; i < numP/10;i++){ // reducing density of points 
		var roseMap = map(i, 0, numP/10, 0, TWO_PI);
		//The design chnages based on MouseX 
		var n = int(map(mouseX, 0, width, 1, width/15));
		var radius = -m*cos(n*roseMap);
		var x = roseW*radius*cos(roseMap);
		var y = roseW*radius*sin(roseMap);
		rect(x-1,y-1,4,4); // makinf the shape out of smaller rectangles instead of curves 
	}
}
// Hypotrochoid curve set 1
function drawHypotrochoid1(currentX,currentY){
	var a = 5;
	for(var k = 0;k<=PI*2;k+= PI/10){
		for(var i = 0; i<width/40;i++){
			push();
			strokeWeight(2);
			//every alternate stroke uses a different shade of blue 
			if(i%2 == 0){
				stroke(3, 168, 155);
			}
			else{
				stroke(188, 248, 236 );
			}
			rotate(k);
			ellipse(currentX + a*i, currentY + a*i, 2*mouseX/2, 2*mouseY/2);
			pop();
		}
	}
}
// Hypotrochoid curve set 2
function drawHypotrochoid2(){
	stroke(115, 75, 94); //maroon
	noFill();
	strokeWeight(3.5);
	var hypoMapY = map(mouseY, 0 , height, 0, width/4); //curve shape evolves based on Mouse Y 
	//Mouse X controls the size of the curve 
	var a = map(constrain(mouseX,0,width), 0 , width , 0, width/2);
	var b = a/20;
	beginShape();
	for(var i = 0; i<numP; i++){
		var hypoMap = map(i,0,100,0,PI);
		var x = (a - b) * cos(hypoMap)+ hypoMapY* cos(((a-b)/b)*hypoMap);
		var y = (a-b) * sin(hypoMap) - hypoMapY * sin(((a - b)/b)*hypoMap);
		vertex(x,y);
	}
	endShape();
}

LO 07 – Information Visualization

The Rhythm of Food, a project lead by Moritz Stefaner and the Google News Lab, investigates seasonal patterns in food searches. By looking at Google search data and plotting over 130,000 data points, this team was able to create a radial “year clock” chart which reveals the seasonal trends for various food/drinks. For the visualiation, each year is represented by a different color, and the segmented block’s distance from the center represents the relative search interest. the project was built using ES2015, webpack, react, Material UI, and d3 v4. I particularly enjoy the evolution of the visualization, and how the team organically found their way to the seasonal trends. It can be a daunting task when attempting to investigate a complex cultural phenomenon, but when done well, it becomes easy to appreciate the simplicity of presentation.

Looking Outwards – 07

The project I chose is called Facebook Flowers by Stamen Design. Their work shows the activity of a Facebook post going viral. It takes on the form of a flower that blooms as the post gets reshared from person to person. Every new share creates a branch and reshares of that share show as an extension of the branch. I admire this piece because of the way it shows data while still creating an art piece in a way. I also really like how motion is used in this data visualization, which is not always included in other works. It is fascinating to watch how the data grows through this plant-like visualization.

Project 07: Composition with Curves

I used a series of three hypocycloid curves (based on the hypocycloid pedal formula) to model an interactive color wheel. I wanted to juxtapose the complex curves and forms with the simplicity of primary colors.

colorwheel
var nPoints = 100	//number of points in each curve

function setup() {
    createCanvas(480, 480);
}

function draw() {
	var halfWide = width/2
	var halfTall = height/2
	background('white')
	push();
	translate(halfWide+10, halfTall)	//move center of curves to center of canvas, offset by 10 tp create overlap later
	HypocycloidBlueCurve()	//draw blue curve
	pop();
	translate(halfWide-10, halfTall);	//move center of curves to center of canvas but offset the other way so overlaps with blue
	HypocycloidCurve()	//draw red curve
	translate(5, 0)	//move back to true canvas center to draw yellow curve over both red and blue
	HypocycloidYellowCurve()	//draw yellow curve
}

function HypocycloidCurve(){
    var a1 = constrain(mouseY, 0, 300, 150, 180); //size changes as vertical mouse position changes
    var b1 = 45;
    var n1 = int(mouseY / 6)	//number of cusps of the curve varies with vertical mouse position

    stroke('red');	//change stroke color to red
    strokeWeight(1);
    fill(255, 0, 0, 20);	//change fill to transparent red

    //create curve, using https://mathworld.wolfram.com/HypocycloidPedalCurve.html base formula for Hypocycloid Pedal Curve
    //map points of curve to circle
    beginShape();
    for (var i = 0; i < nPoints; i++) {
        var theta = map(i, 0, nPoints, 0, TWO_PI);     
        var x1 = a1*(((n1-2)*(cos(theta)-cos((1-n1)*theta)))/(2*n1))
        var y1 = a1*(((n1-2)*(cos(theta*(1-0.5*n1))*sin(0.5*n1*theta)))/(2*n1))
        curveVertex(x1, y1);
    }
    endShape(CLOSE); 
}

//draw blue hypocycloid, same as red but in blue
function HypocycloidBlueCurve(){
    var a1 = constrain(mouseY, 0, 300, 150, 180); //size changes as vertical mouse position changes
    var b1 = 45;
    var n1 = int(mouseY / 6)	//number of cusps of the curve varies with vertical mouse position
    fill(0, 0, 255, 20)	//fill transparent blye
    stroke('blue');	//set stroke color to blue
    strokeWeight(1);
    //create curve, using https://mathworld.wolfram.com/HypocycloidPedalCurve.html base formula for Hypocycloid Pedal Curve
    //map points of curve to circle
    beginShape();
    for (var i = 0; i < nPoints; i++) {
        var theta = map(i, 0, nPoints, 0, TWO_PI);     
        var x1 = a1*(((n1-2)*(cos(theta)-cos((1-n1)*theta)))/(2*n1))
        var y1 = a1*(((n1-2)*(cos(theta*(1-0.5*n1))*sin(0.5*n1*theta)))/(2*n1))
        curveVertex(x1, y1);
    }
    endShape(CLOSE); 
}
//draw yellow hypocycloid
function HypocycloidYellowCurve(){
    var a1 = constrain(mouseY, 0, 300, 150, 180); //size changes as vertical mouse position changes
    var b1 = 45;
    var n1 = int(mouseY / 10)	//number of cusps of the curve varies with vertical mouse position
    fill(255, 255, 0, 50)	//set fill color to a transparent yellow
    stroke('yellow');	//set stroke color to yellow
    strokeWeight(1);
	//create curve, using https://mathworld.wolfram.com/HypocycloidPedalCurve.html base formula for Hypocycloid Pedal Curve
    //map points of curve to circle
    beginShape();
    for (var i = 0; i < nPoints; i++) {
        var theta = map(i, 0, nPoints, 0, TWO_PI);     
        var x1 = a1*(((n1-2)*(cos(theta)-cos((1-n1)*theta)))/(2*n1))
        var y1 = a1*(((n1-2)*(cos(theta*(1-0.5*n1))*sin(0.5*n1*theta)))/(2*n1))
        curveVertex(x1, y1);
    }
    endShape(CLOSE); 
}

Project-07 – Curves

sketch
//Dreami Chambers; Section C; dreamic@andrew.cmu.edu; Assignment-05-Project

function setup() {
    createCanvas(480, 480);
    background(220);
}

function draw() {
	background(250, 190, 200) //pink background
	//calls column with 5 hearts
    for (var x = 40; x <= width; x += 200) {
        for (var y = 40;y <= height; y+= 100) {
        	push()
            translate(x, y)
            drawheart2()
            drawheart()
            pop()
        }
    }
    //cals collumn with 4 hearts
    for (var x = 140; x <= width; x += 200) {
        for (var y = 100;y <= height; y+= 100) {
        	push()
            translate(x, y)
            drawheart2()
            drawheart()
            pop()
        }
    }
}

//draws pink hearts
function drawheart(){
	fill(230, 80, 120)
	strokeWeight(0)
	push()
    beginShape();
    rotate(radians(180))
    for (var i = 0; i < TWO_PI; i+=0.1) {
    	var mx = constrain(mouseX/300, 0.7, 1.2) //multiplier based on mouseX
    	var my = constrain(mouseY/300, 0.7, 1.2) //multiplier based on mouseY
        var x = mx*16*pow(sin(i),3)
        var y = my*13*cos(i) - 5*cos(2*i) - 2*cos(3*i) - cos(4*i)
        vertex(x,y); 
    }
    endShape(CLOSE);
    pop()
}

//draws white hearts
function drawheart2(){
	var t = constrain(mouseX/3, 50, 80) //transparency based on mouseX
	fill(255, 255, 255, t)
	strokeWeight(0)
	push()
    beginShape()
    scale(2)
    rotate(radians(180))
    for (var i = 0; i < TWO_PI; i+=0.1) {
        var x = 1.2*16*pow(sin(i),3)
        var y = 1.2*13*cos(i) - 5*cos(2*i) - 2*cos(3*i) - cos(4*i)
        vertex(x,y); 
    }
    endShape(CLOSE);
    pop()
}

For this project, I wanted to create a wallpaper again, but this time with curves. I decided to use hearts for this, in which the size changes with the mouse coordinates. The white hearts in the background also change in transparency depending on the coordinate of the mouse.

Screenshot of my wallpaper