//Ian Lippincott
//ilippinc@andrew.cmu.edu
//Section: D
//Project 11

var hill = [];
var mountains = [];
var trees = [];
var c1;
var c2;
var noiseParam = 0;
var noiseStep = 0.03;

function setup() {
    createCanvas(400, 240);
    //Define background colors
    c1 = color(228, 90, 41);
    c2 = color(221, 197, 75);
    strokeWeight(1);
    frameRate(20);
    for (var i = 0; i < (width / 5) + 1; i++) {
      var n = noise(noiseParam);
      var value = map(n, 0, 1, 50, 200);
      hill.push(value);
      noiseParam += noiseStep;
    }
}

 // create an initial collection of mountains
    for (var i = 0; i < 10; i++){
        var rx = random(width);
        mountains[i] = makemountain(rx);
    }

// create an initial collection of trees
    for (var i = 0; i < 10; i++){
        var r = random(width);
        trees[i] = maketree(r);
    }

function draw() {
  setGradient(c1, c2);
  strokeJoin(BEVEL);
  stroke(0);
  strokeWeight(4);
  fill(63, 77, 44);
  hill.shift();
  var n = noise(noiseParam);
  var value = map(n, 0, 1, 50, 150);
    hill.push(value);
    noiseParam += noiseStep;
    beginShape();
    vertex(0, height);
    for (var i = 0; i < (width / 5) + 1; i++) {
      vertex(i * 5, hill[i]);
    }
    vertex(width, height);
    endShape();

    //Ground
    fill(95, 110, 73);
    rect(0, 199, width, height);

    //mountains
    updateAndDisplayMountains();
    removeMountainsThatHaveSlippedOutOfView();
    addNewMountainsWithSomeRandomProbability();

    //Trees
    updateAndDisplayTrees();
    removeTreesThatHaveSlippedOutOfView();
    addNewTreesWithSomeRandomProbability();
}

//mountains
function makeMountain(birthLocationX) {
    var mntn = {x: birthLocationX,
                breadth: 70,
                speed: -5.5,
                nFloors: round(random(2,8)),
                move: mountainMove,
                display: mountainDisplay}
    return mntn;
}

// method to update position of mountain every frame
function mountainMove() {
    this.x += this.speed;
}

// draw the mountain
function mountainDisplay() {
    var floorHeight = 8;
    var cHeight = this.nFloors * floorHeight;

    strokeWeight(4);
    stroke(0);
    fill(156, 119, 76);
    push();
    translate(this.x, height - 40);

    //Mountain
    triangle(-7,0,this.breadth/2,-cHeight-20,this.breadth + 7,0);
    //Shadow
    fill(87, 66, 42);
    triangle(-7,0,this.breadth/2,-cHeight-20,20,0);
    //Snow
    pop();
}

function updateAndDisplayMountains(){
    // Update the mountain's positions, and display them.
    for (var i = 0; i < mountains.length; i++){
        mountains[i].move();
        mountains[i].display();
    }
}

function removeMountainsThatHaveSlippedOutOfView(){
  var mountainToKeep = [];
  for (var i = 0; i < mountains.length; i++){
    if (mountains[i].x + mountains[i].breadth > 0) {
        mountainToKeep.push(mountains[i]);
    }
  }
  mountains = mountainToKeep; // remember the surviving mountain
}

function addNewMountainsWithSomeRandomProbability() {
    // With a very tiny probability, add a new cabin to the end.
    var newMountainLikelihood = 0.02;
    if (random(0,1) < newMountainLikelihood) {
        mountains.push(makeMountain(width));
    }
}


//trees
function makeTree(birthLocationX) {
    var tr = {x: birthLocationX,
                breadth: 70,
                speed: -6.0,
                nFloors: round(random(2,8)),
                move: treeMove,
                display: treeDisplay}
    return tr;
}

// method to update position of tree every frame
function treeMove() {
    this.x += this.speed;
}

// draw the tree
function treeDisplay() {
    var floorHeight = 8;
    var cHeight = this.nFloors * floorHeight;

    strokeWeight(4);
    stroke(0);
    fill(71, 145, 80);
    push();
    translate(this.x, height - 40);

    //Tree
    triangle(0, 0, 10,-cHeight, 20, 0);
    triangle(0, -8, 10,-cHeight, 20, -8);
    triangle(0, -16, 10,-cHeight, 20, -16);
    pop();
}

function updateAndDisplayTrees(){
    // Update the tree's positions, and display them.
    for (var i = 0; i < trees.length; i++){
        trees[i].move();
        trees[i].display();
    }
}

function removeTreesThatHaveSlippedOutOfView(){
  var treeToKeep = [];
  for (var i = 0; i < trees.length; i++){
    if (trees[i].x + trees[i].breadth > 0) {
        treeToKeep.push(trees[i]);
    }
  }
  trees = treeToKeep; // remember the surviving mountain
}

function addNewTreesWithSomeRandomProbability() {
    // With a very tiny probability, add a new cabin to the end.
    var newTreeLikelihood = 0.08;
    if (random(0,1) < newTreeLikelihood) {
        trees.push(makeTree(width));
    }
}

//Makes Gradient Background
function setGradient(c1, c2) {
  noFill();
  for (var b = 0; b < height; b++) {
    var inter = map(b, 0, height, 0, 1);
    var c = lerpColor(c1, c2, inter);
    stroke(c);
    line(0, b, width, b);
  }
}Author: smudged bison
LO 11 – A Focus on Women Practitioners
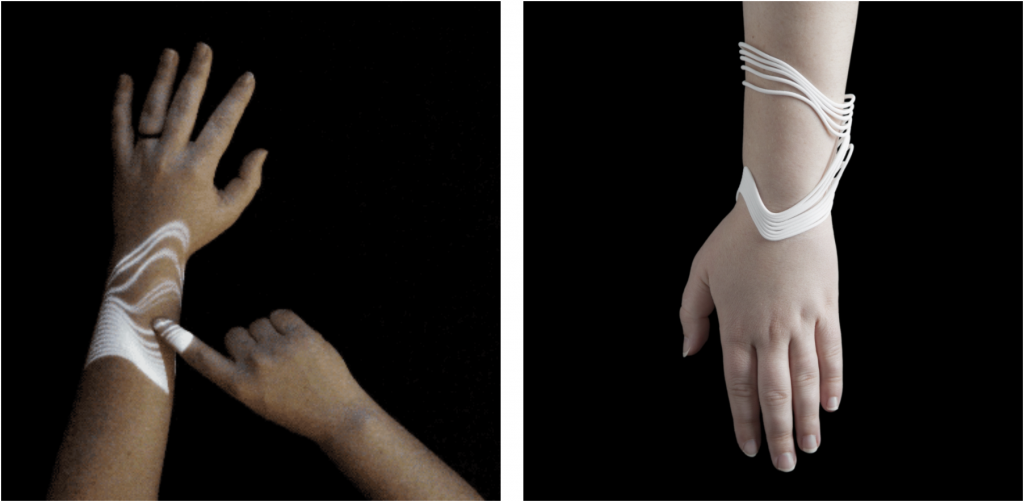
Madeline Gannon is a designer of interactive tools for digital fabrication at Madlab. The project I am highlighting is called Tactum, which is an augmented modeling tool that is used to design 3D printed wearables. This tool uses depth-sensing and projection mapping to sense different inputs and in turn, project touch gestures on the user’s skin. This is a very ingenious method of rapid prototyping that allows anybody to design a 3D printed wearable, and see real-time feedback throughout the process. It is very interesting to see the limitations of a program with a finite amount of possible creations (due to the given size and number of bands). I would really like to explore this tool and discover new methods of interaction and how they would produce different outcomes.
LO 9
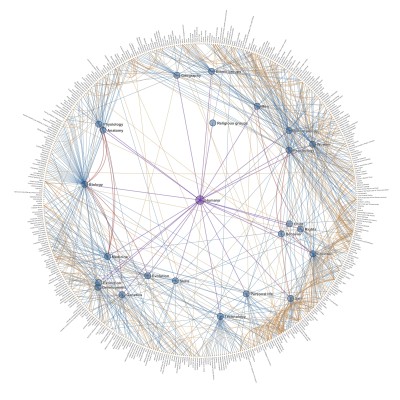
This week I am going to look at my good pal Jubbies’ blog post on Chris Harrison’s “Clusterball”. This data visualization uses the connections between different Wikipedia pages through a common denominator to create an almost woven ball of links. I too played many rounds of “Wikiracing” as a kid, so I can easily connect to Jubbies’ outlook on this project. I enjoy seeing the ways in which these structures of interconnections have been made and where these lines are drawn. While taking part in “Wikiracing” I never truly paused to think about what connects various words and articles (as my only care at that time was winning the game). I agree with Jubbies’ statement on how amazing it is to see how every word does its part to add to this organic system. I would be interested to see this directly applied to “wikiracing” and be able to give two wikipedia pages as inputs and see how you could navigate from one page to the other.
https://www.chrisharrison.net/index.php/Visualizations/ClusterBall
My Portrait
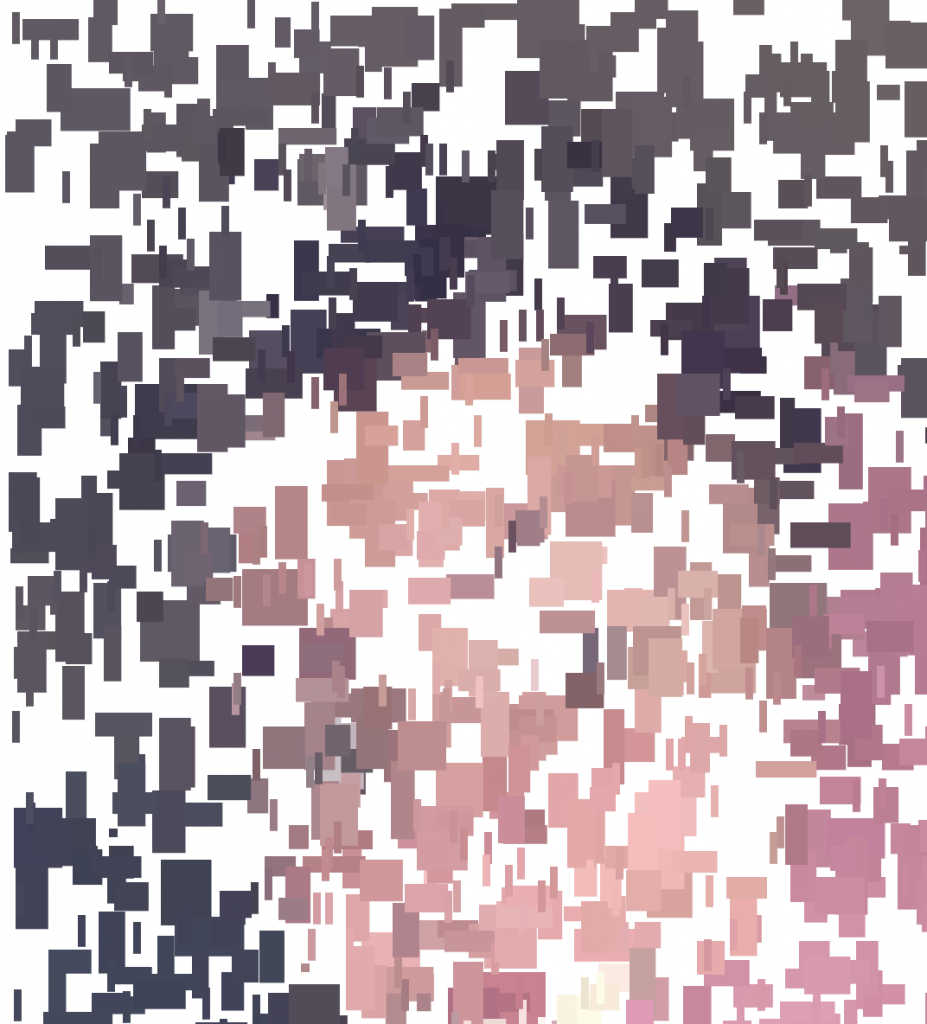
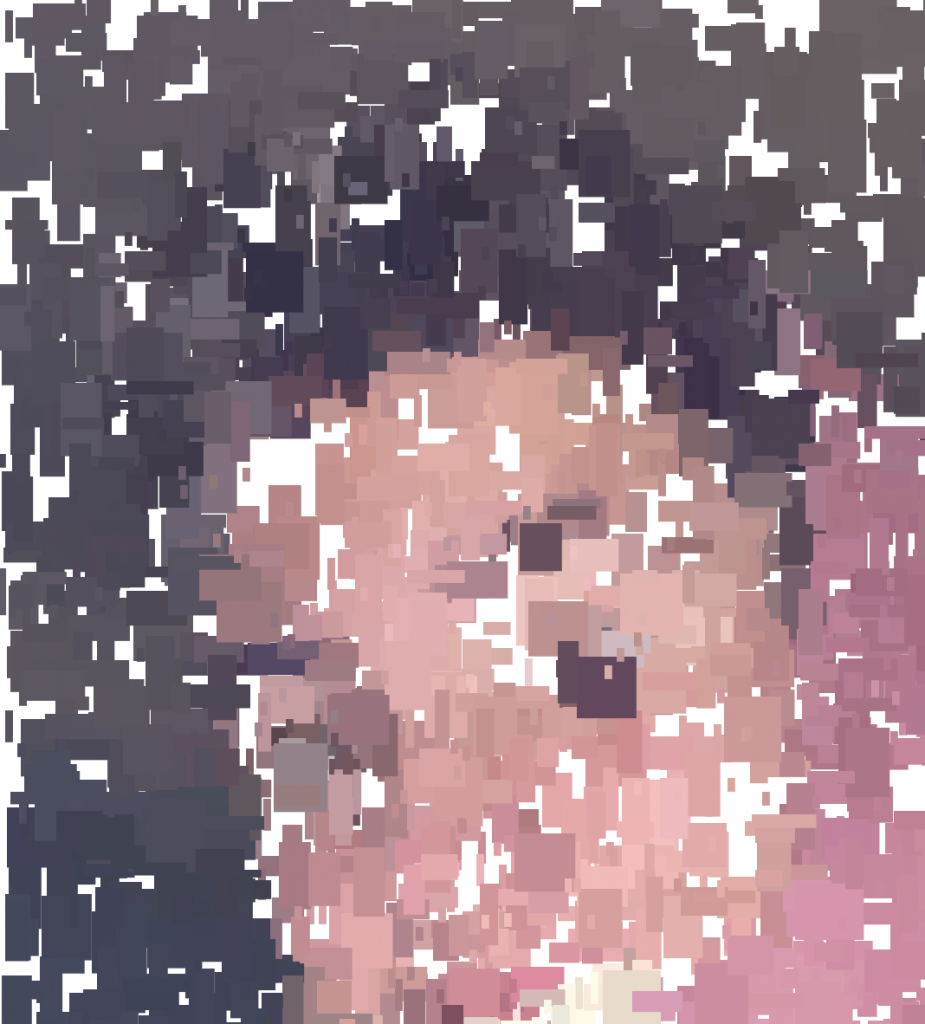
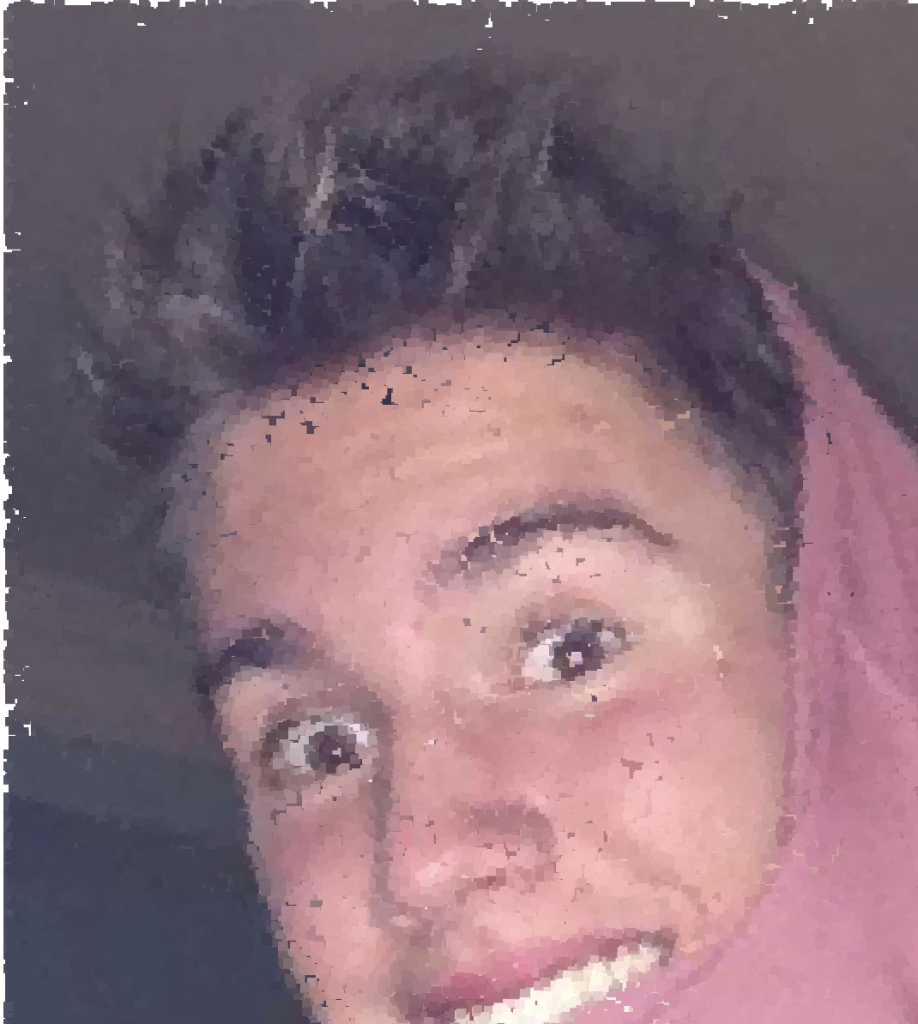
I wanted to create a portrait that used random points from the canvas to generate the image, while being modified by the cursor position.
let img;
let thin, thick;

function preload() {
  img = loadImage('https://i.imgur.com/l7MihtV.jpg');
}

function setup() {
  createCanvas(536, 600);
  thin = 5;
  thick = 45;
  imageMode(CENTER);
  noStroke();
  background(255);
  img.loadPixels();
}

function draw() {
  //Maps mouseX and mouseY to 5 and 45 to scale both dimensions of the rectangle
  let sizeX = map(mouseX, 0, width, thin, thick);
  let sizeY = map(mouseY, 0, height, thin, thick)
  //Picks random points from the image and stores them in x and y
  let x = floor(random(img.width));
  let y = floor(random(img.height));
  //Gets the exact pixel
  let pixel = img.get(x, y);
  //Draws rectangle according to randomly chosen position
  //and cursor position
  fill(pixel, 128);
  rect(x, y, sizeX, sizeY);
}
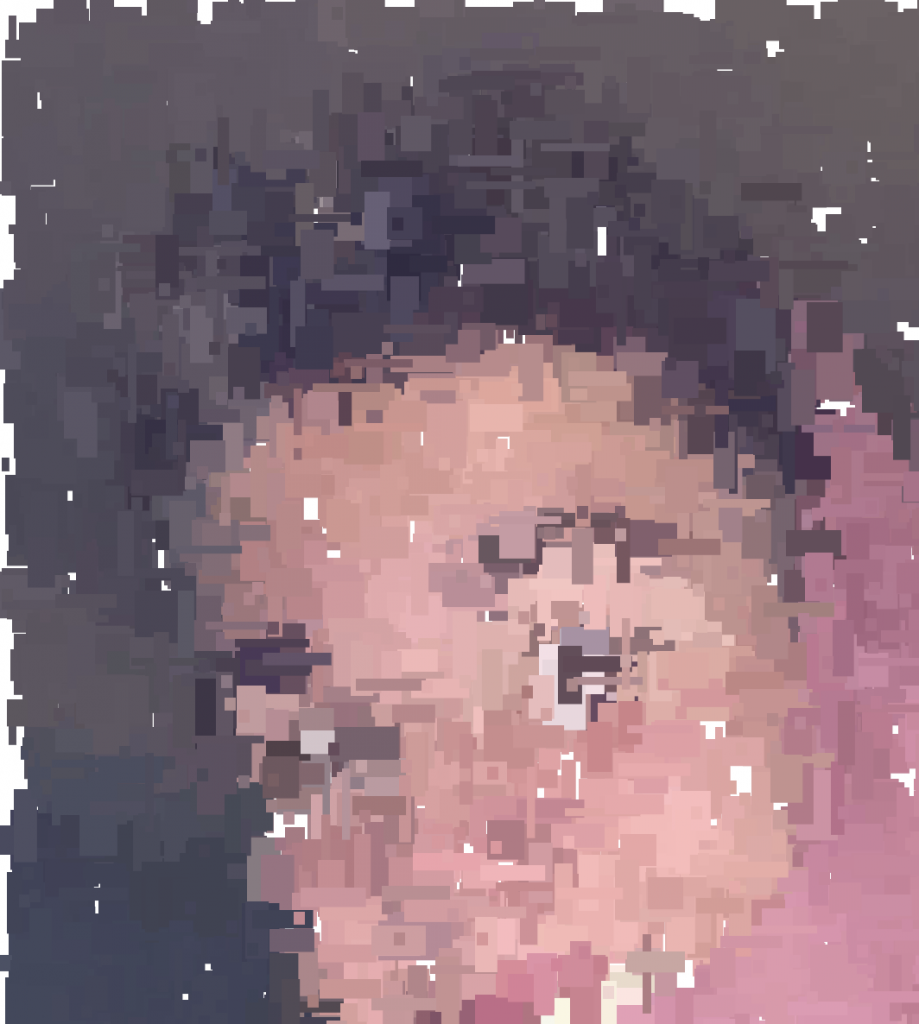
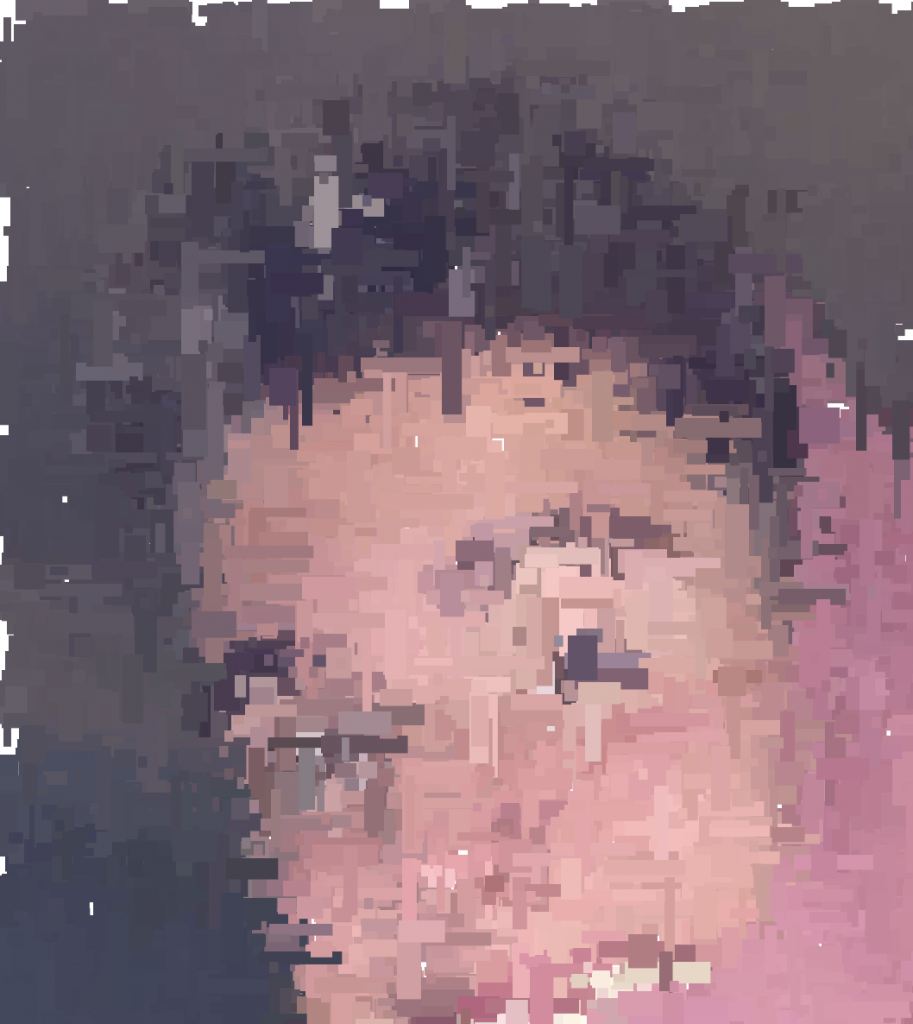
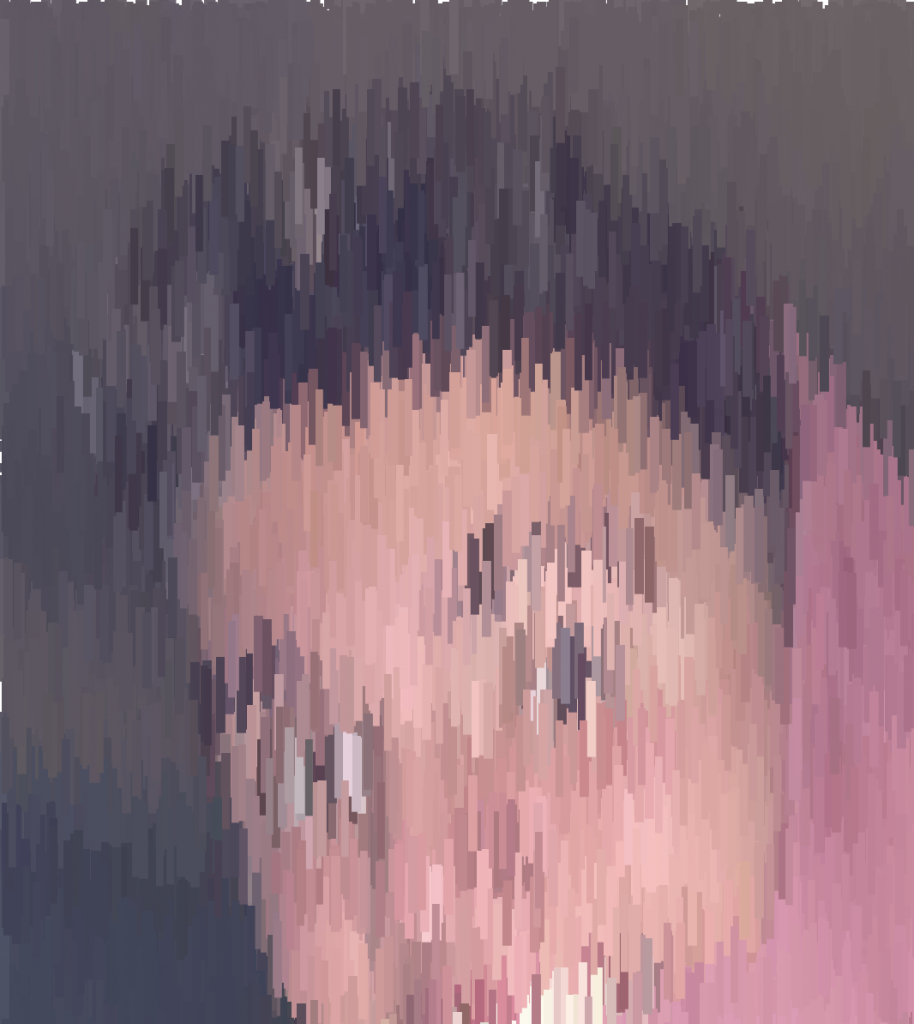
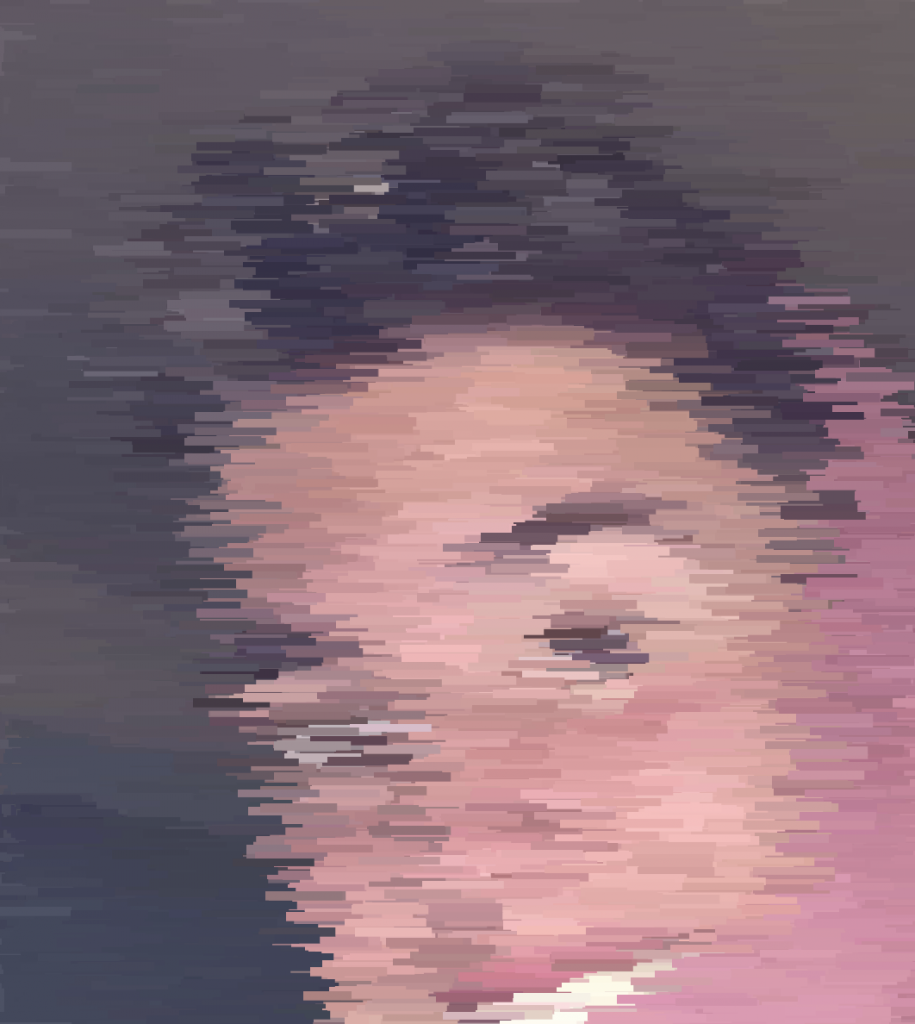
LO 8 – Eyeo Speaker
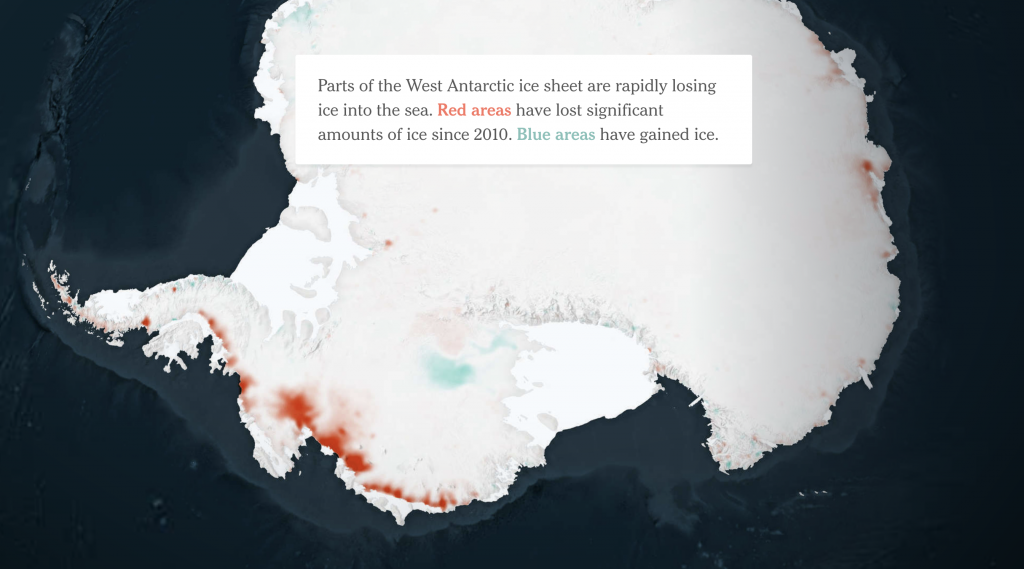
Derek Watkins is a Graphics Editor at the New York Times and is a designer, developer, reporter, and geographer. He studied Geography for both his Bachelors and Masters degrees and seems to have learned graphics programming on his own (I am not 100% certain about this, but I don’t see any explicit education in programming). Watkins presents himself as a journalist first, and a designer, cartographer, geographer, developer second. His main goal is to understand the considerations of the reader and to effectively present the story, so he finds himself with the initial job of storytelling and uses his skill set to do so. I enjoy Watkins’ work largely because of his use of low-level interaction and how when done well, can give the reader control of the article. The cognitive shift from reading a story to controlling a motion graphic can be a lot, and I appreciate the fine line between being too ambitious and just ambitious enough that Watkins is able to walk along to create an enjoyable and meaningful experience all at once. The projects that stand out to me the most are his animations for the 2016 Rio Olympics and his dispatch about the current climate science on the Antarctic ice sheet. These projects vary greatly when it comes to content and the amount of information being shared, but they both include simple ways in which the reader can interact with the article.

Project-07-Curves
//Ian Lippincott
//ilippinc
//Section D


//orange
//fill(240, 147, 109);
//blue
//fill(49, 57, 75);
//cream
//fill(255, 255, 226


var nPoints = 500;
var angle = 30;

function setup() {
    createCanvas(480, 480);
}

function draw() {
    background(49, 57, 100);
    //draw 2 sets of 36 hypotrochoids
    for (var x = 80; x <= 400; x += 64) {
        for (var y = 80; y <= 400; y += 64) {
            push();
            translate(x, y);
            rotate(mouseX/20);
            drawEpitrochoid();
            pop();
        }
    }
}

function drawEpitrochoid() {
    var a = map(mouseX, 0, 480, 0, 120);
    var b = map(mouseX, 0, 480, 0, 40);
    var h = map(mouseY, 0, 480, 0, 40);
    strokeWeight(4);
    //Cream Stroke
    stroke(255, 255, 226);
    //Orange Fill
    fill(240, 147, 109);
    //Draw Epitrochoid
    beginShape();
    for (var i=0; i<nPoints; i++) {
        var angle = map(i, 0, 80, 0, TWO_PI);
        x = (a+b) * cos(angle) - h * cos(((a+b)/b) * angle);
        y = (a+b) * sin(angle) - h * sin(((a+b)/b) * angle);
        vertex(x, y);
    }
    endShape();
}
LO 07 – Information Visualization
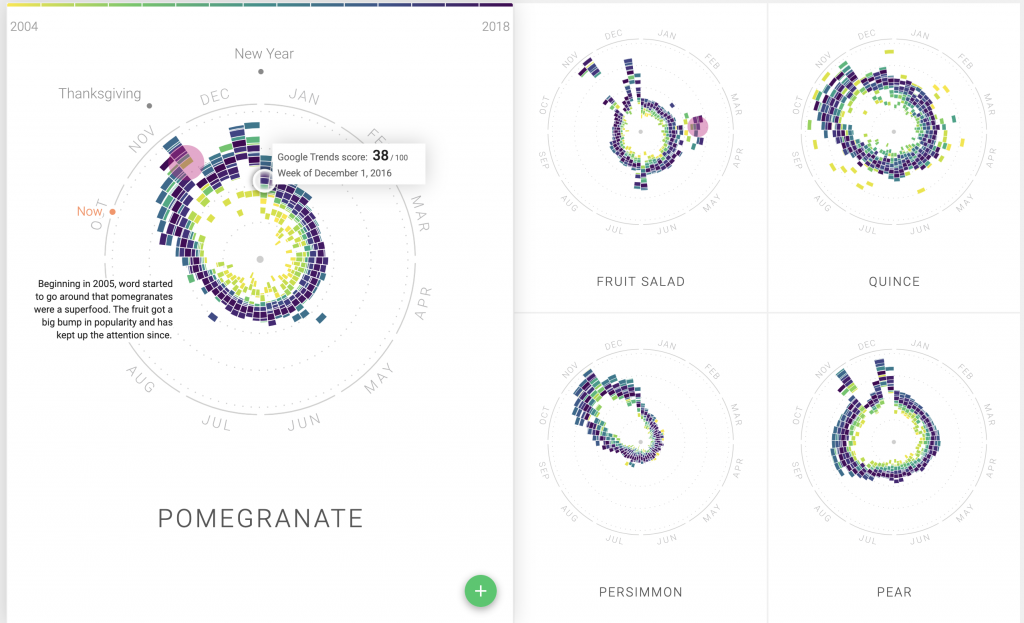
The Rhythm of Food, a project lead by Moritz Stefaner and the Google News Lab, investigates seasonal patterns in food searches. By looking at Google search data and plotting over 130,000 data points, this team was able to create a radial “year clock” chart which reveals the seasonal trends for various food/drinks. For the visualiation, each year is represented by a different color, and the segmented block’s distance from the center represents the relative search interest. the project was built using ES2015, webpack, react, Material UI, and d3 v4. I particularly enjoy the evolution of the visualization, and how the team organically found their way to the seasonal trends. It can be a daunting task when attempting to investigate a complex cultural phenomenon, but when done well, it becomes easy to appreciate the simplicity of presentation.
Abstract Clock
//Ian Lippincott
//ilippinc@andrew.cmu.edu
//Section: D
//Project-06-A

var c1;
var c2;
var s = second();

function setup() {
    createCanvas(480, 480);
    //Define background colors
    c1 = color(17, 19, 42);
    c2 = color(84, 17, 102);

}


function draw() {
	//Background
	setGradient(c1, c2);
	//Stars
	stroke(255);
	strokeWeight(2);
	point(30, 50);
	point(400, 80);
	point(250, 30);
	point(35, 200);
	point(100, 420);
	point(10, 370);
	point(400, 400);
	point(270, 430);
	noStroke();
	//Moon base
	//Light Moon Color
	fill(253, 242, 199);
	circle(240, 240, 320);

	//Moon shadow
	//Dark Moon Color
	fill(226, 199, 145);
	beginShape();
	vertex(240, 80);
	bezierVertex(25, 87, 25, 393, 240, 400);
	bezierVertex(100, 393, 100, 87, 240, 80);
	endShape();

	//Dark Spots
	circle(220, 260, 60);
	circle(320, 200, 25);
	circle(240, 140, 10);
	circle(180, 180, 10);
	circle(200, 200, 10);
	circle(340, 270, 20);
	circle(320, 290, 8);
	circle(290, 340, 20);
	circle(180, 330, 15);

	//Light Spots
	fill(253, 242, 199);
	circle(130, 220, 50);
	circle(145, 165, 20);
	circle(155, 320, 40);

	//Hour Counting Shadow
	fill(226, 199, 145, 170);
	beginShape();
	vertex(240, 80);
	bezierVertex(25, 87, 25, 393, 240, 400);
	bezierVertex(25 + hour() * (320 / 24), 393, 25 + hour() * (320 / 24), 87, 240, 80);
	endShape();

	//Minute Counting Cloud
	drawCloud(minute() * 8, 350);

	//Second Counting Witch
	drawWitch(-60 + second() * 480 / 60, 300);


}


//Makes Gradient Background
function setGradient(c1, c2) {
	noFill();
	for (var b = 0; b < height; b++) {
		var inter = map(b, 0, height, 0, 1);
		var c = lerpColor(c1, c2, inter);
		stroke(c);
		line(0, b, width, b);
	}
}


function drawCloud (x, y) {
	push();
	fill(80, 58, 96);
	translate(x, y);
	rect(0, 0, 120, 30, 12);
	rect(10, 10, 170, 30, 10);
	rect(-20, 20, 100, 30, 15)
	rect(30, 30, 100, 30, 20);
	rect(100, 20, 100, 20, 15);
	rect(100, 30, 140, 10, 15);
	pop();
}

function drawWitch (x, y) {
	translate(x, y);
	fill(39, 27, 53);
	ellipse(36, 48, 48, 20);
	strokeCap(ROUND);
	strokeWeight(4);
	stroke(39, 27, 53);
	line(36, 48, 140, 48);
	strokeCap(SQUARE);
	strokeWeight(1);
	beginShape();
	vertex(36, 38);
	bezierVertex(27, 36, 18, 40, 0, 47);
	bezierVertex(18, 55, 27, 60, 40, 50);
	endShape();
	angleMode(DEGREES);
	push();
	rotate(30);
	ellipse(95, -5, 32, 18);
	pop();
	push();
	rotate(-35);
	ellipse(60, 75, 32, 18);
	pop();
	beginShape();
	vertex(89, 18);
	bezierVertex(82, 26, 65, 29, 50, 28);
	bezierVertex(60, 30, 70, 38, 75, 45);
	endShape();
	beginShape();
	vertex(106, 21);
	vertex(108, 28);
	vertex(110, 34);
	vertex(102, 40);
	vertex(100, 38);
	vertex(95, 21);
	endShape();
	push();
	rotate(80);
	rect(40, -98, 25, 3);
	pop();
	push();
	rotate(30);
	rect(95, -40, 5, 3);
	pop();
	push();
	rotate(20);
	ellipse(105, -29, 12, 15);
	pop();
	beginShape();
	vertex(105, 15);
	bezierVertex(98, 10, 95, 8, 95, 3);
	bezierVertex(95, 4, 100, 6, 106, 2);
	endShape();


}
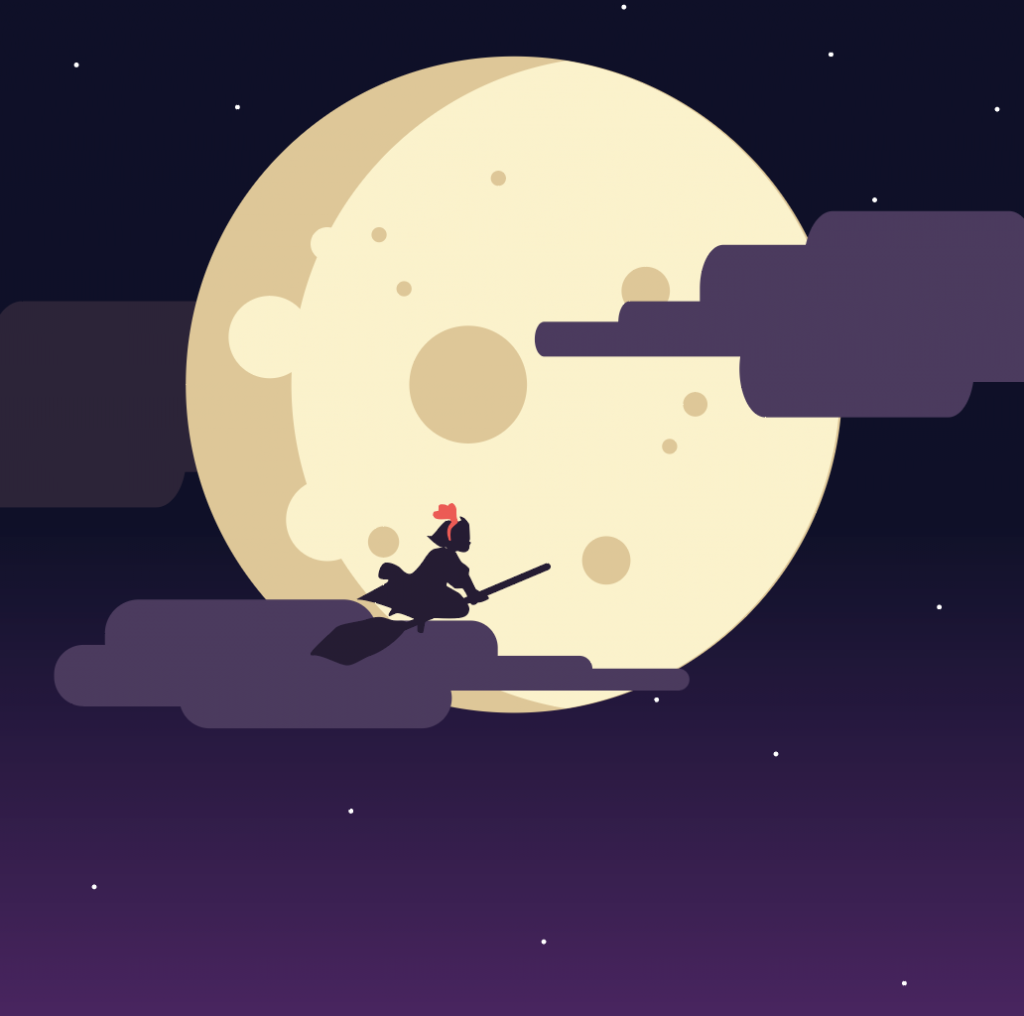
For this project, I wanted to create a clock that took inspiration from the Studio Ghibli movie Kiki’s Delivery Service. I make my design first in Illustrator.
LO 06 – Randomness
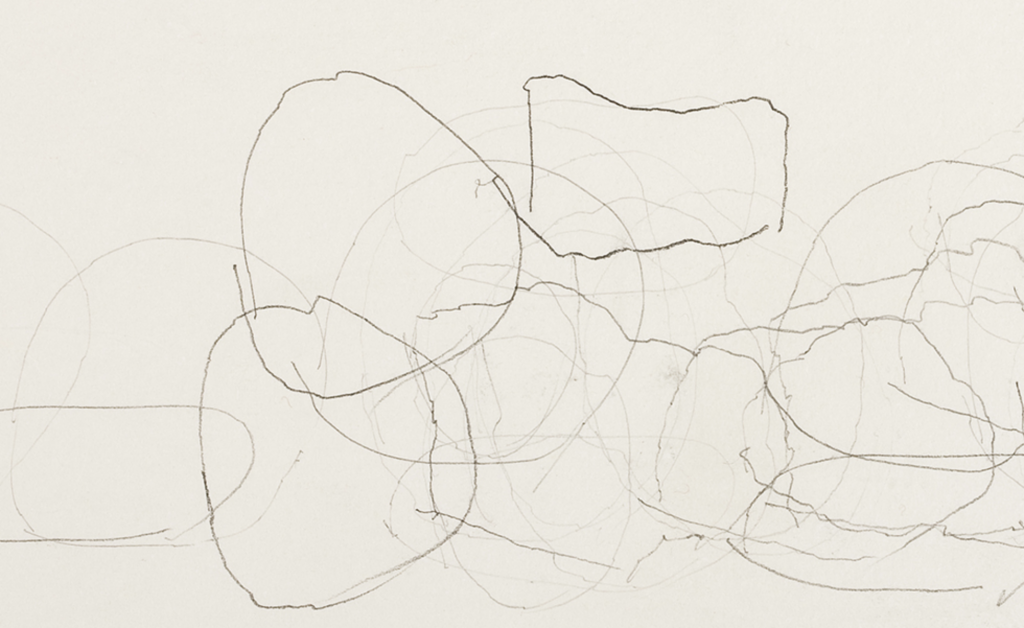
John Cage was an American composer who was one of the leading figures of the post-war avant-garde. While most of his work involved music and non-standard use of musical instruments, he also produced visual art. One project titled “Rocks” used randomness to determine the tools and placement of the objects being painted. Cage used computer-generated random numbers from a list which determined what group of stones would be used in his drawing/painting. He would then go through the same process to choose the brush/pencil he would use, and the position of the rocks. After this “seed” has been chosen, Cage would trace the rocks in their random positions. I particularly enjoy this work because of the simplicity in the randomness. While these pieces of art do not use complex algorithms to produce random results, they use random number generators to select the materials, and Cage is still able to physically contribute to the pieces. This is certainly a contrast to the work of Jackson Pollock, which appears to be completely random, but in the end, Pollock is controlling every splatter of paint. In the work of John Cage, his work looks so controlled, yet every aspect of it, aside from the shape of the rocks, is random.
Link: http://hanesgallery.wfu.edu/portfolio-item/johncagerocks/
LO 5 – 3D Computer Graphics
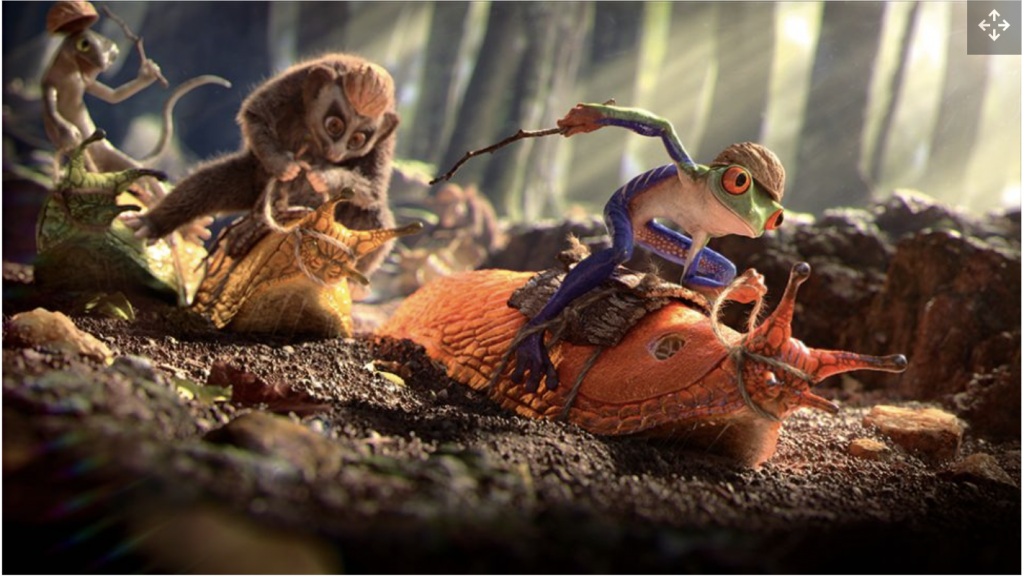
Brazilian 3D artists Fabricio Moraes and Guilherme Formenti teamed up to create a whimsical scene called “Slug Race”. The inspiration came from a walk in the woods and the sights to see in a damp forest. Fabricio had wanted to try a technique called photogrammetry, so on his walk, he scanned a lot of trees, rocks, and ground to create a realistic representation of what he saw. Agisoft PhotoScan was used for the collection of assets for the process of photogrammetry, 3ds max and Zbrush were used for modeling and lighting, V-Ray was for rendering, and Nuke was for compositing (Moraes typically uses Photoshop for compositing). I particularly enjoy how these artists created such a whimsical scene that is closely based on reality. The process of photogrammetry is also very intriguing as it is a technique that I would also like to try.
![[OLD FALL 2020] 15-104 • Introduction to Computing for Creative Practice](../../wp-content/uploads/2021/09/stop-banner.png)