Looking Outwards : 07

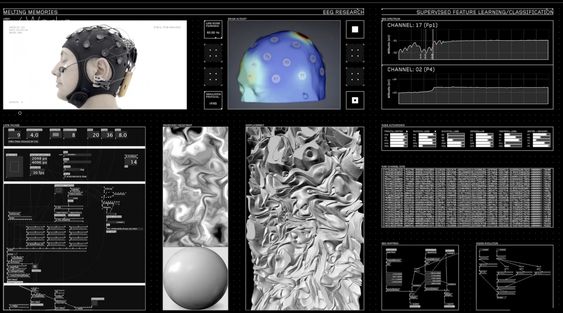
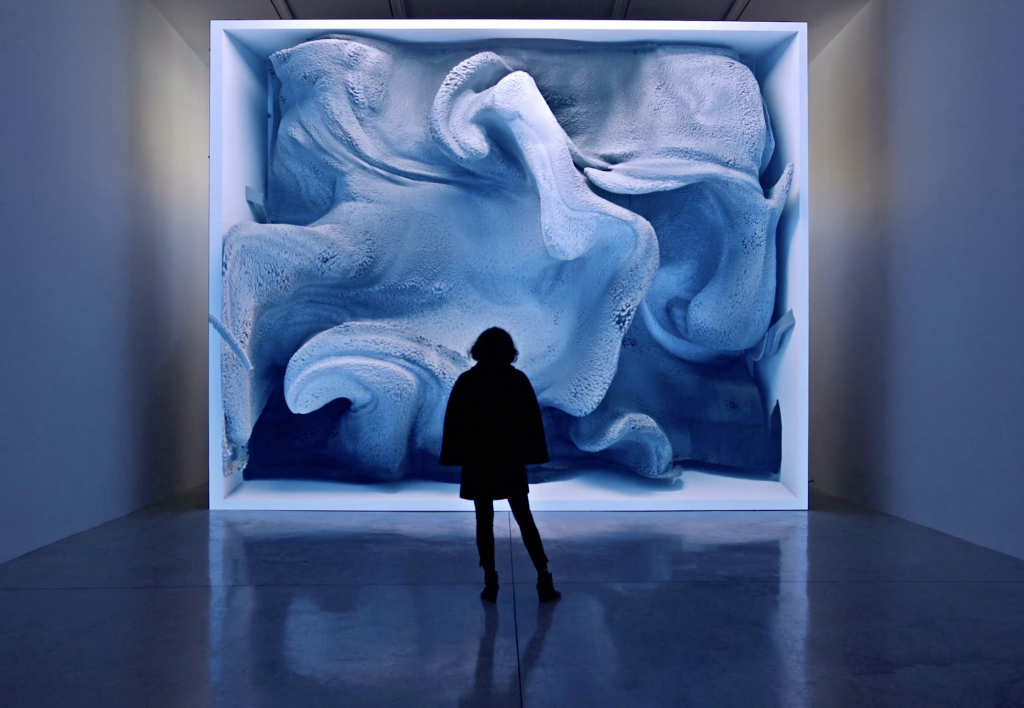
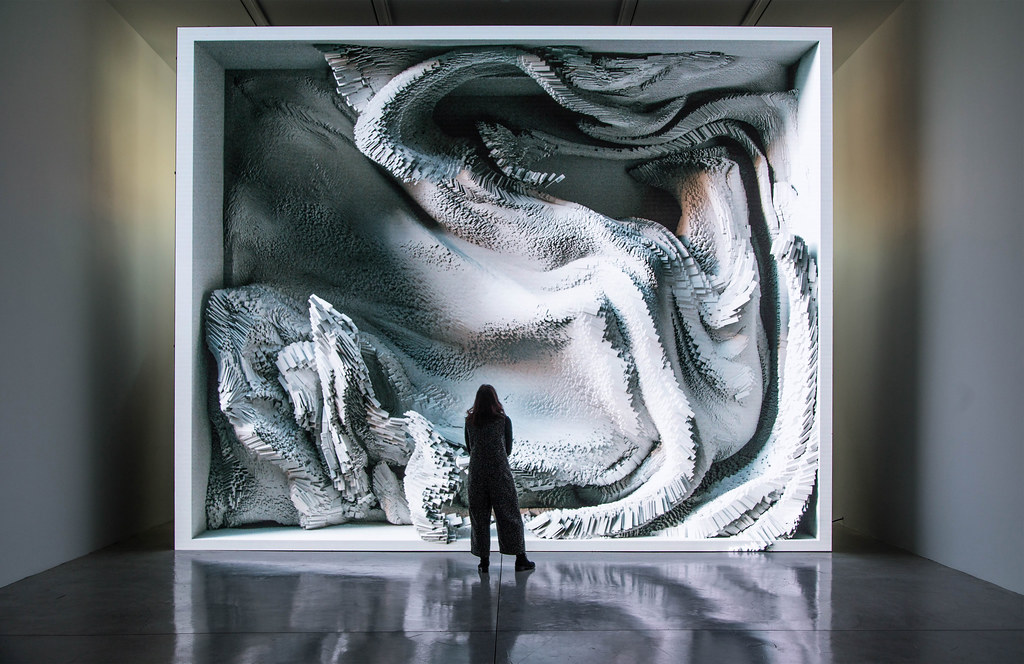
Conceived by Refik Anadol Studio “Melting Memories” offers new insights into the representational possibilities emerging from the intersection of advanced technology and contemporary art. A series of artworks are created by visualising different EEG(electroencephalogram) data collected. By representing the EEG data gives it a tactility that emphasises the materiality of memory. EEG data measures changes in brain wave activity and provides evidence of how the brain functions over time.

Anadol showcases his creative vision of “recollection” by translating the elusive process of memory retrieval into data collections. Melting Memories provides the viewer with revealing and contemplative works through the augmented data sculptures and light projections.

I find the way in which he broke down the various components of EEG data to produce these magnificent drawings which start to take on organic forms is fascinating. And how the title too relates back to the artists own experience with unexpected interconnections among seminal philosophical works, academic inquiries and artworks that take memory as their principal themes.

Project-07-Curves

sketch

var angle=360;

function setup(){
  createCanvas(460,460);
  frameRate(5);
}

function draw(){
  background(43,40,41);
  for (var x = 50; x <= 430; x += 90) {       //curves repetition
    for (var y = 50; y <= 430; y += 90) {
      push();
      translate(x,y);
      stroke(mouseX,100,mouseY);
      curve1();
      stroke(mouseX,200,mouseY);
      curve2();
      pop();
    }
  }
}

function curve1(){     //outer curve
  var x;
  var y;
  var a = map(mouseX, 0, width, 0, 50); 
  var h = map(mouseY, 0, height, 0, 50); 
  var b = a / 10;
  beginShape();
  for (var i = 0; i < angle; i ++) {
    strokeWeight(2);
    noFill();
    var t = map(i, 0, 180, 0, TWO_PI)
    x = (a-b) * cos(t) + h * cos(((a-b)/b) * t);
    y = (a-b) * sin(t) - h * sin(((a-b)/b) * t);
    vertex (x, y)
  }
  endShape(CLOSE);
}

function curve2(){      //inner curve
  var x;
  var y;
  var a = map(mouseX, 0, width, 0, 30); 
  var h = map(mouseY, 0, height, 0, 30); 
  var b = a / 10;
  beginShape();
  for (var i = 0; i < angle; i++) {
    noFill();
    strokeWeight(1);
    var g = map(i, 0, 180, 0, TWO_PI);
    x = (a+b) * cos(g) - h * cos(g * (a+b)/b);
    y = (a+b) * sin(g) + h * sin(g * (a+b)/b);
    vertex(x, y);
  }
  endShape(CLOSE);
}

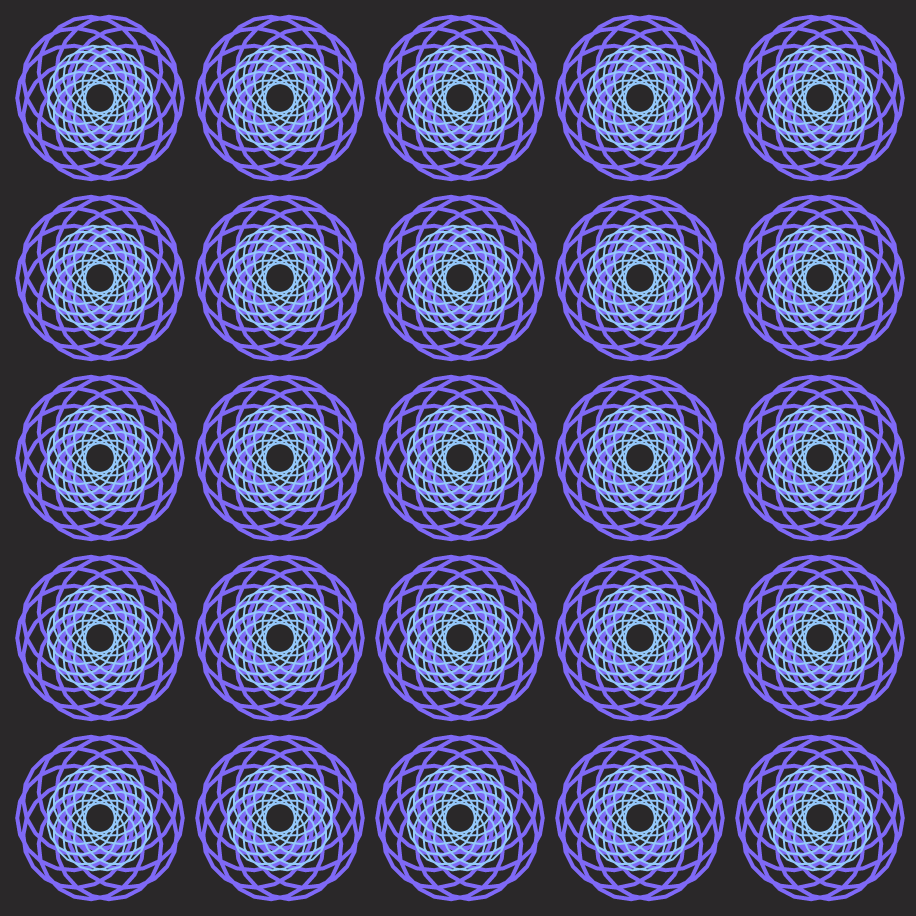
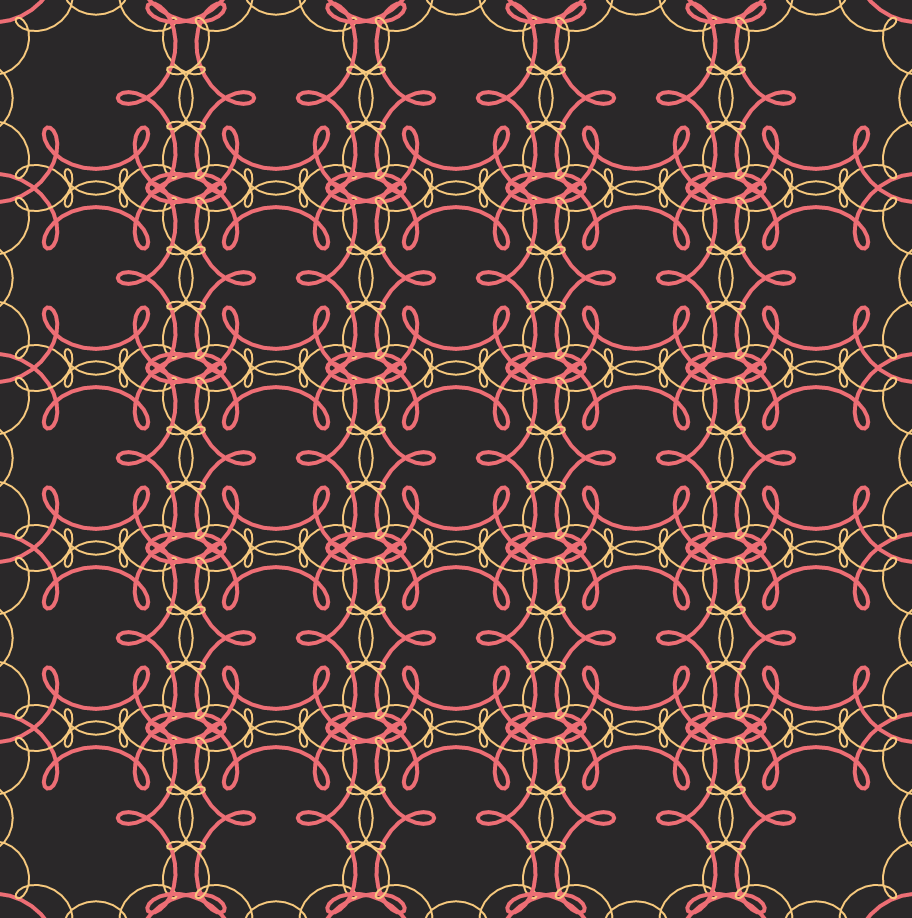
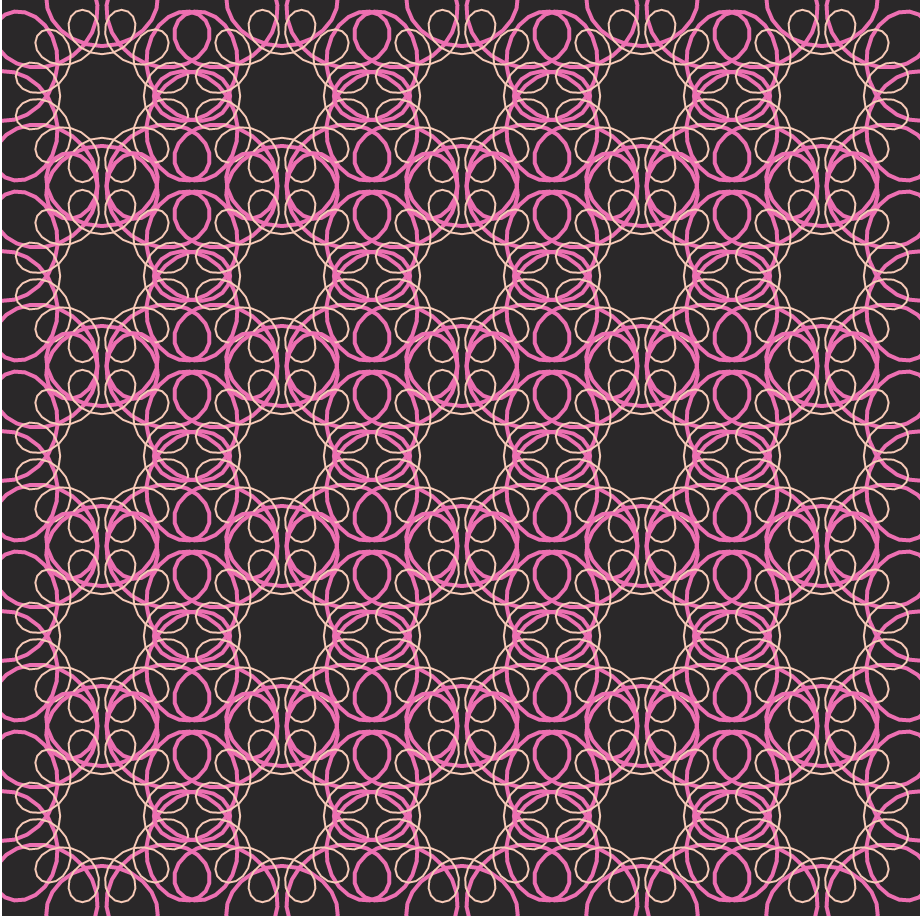
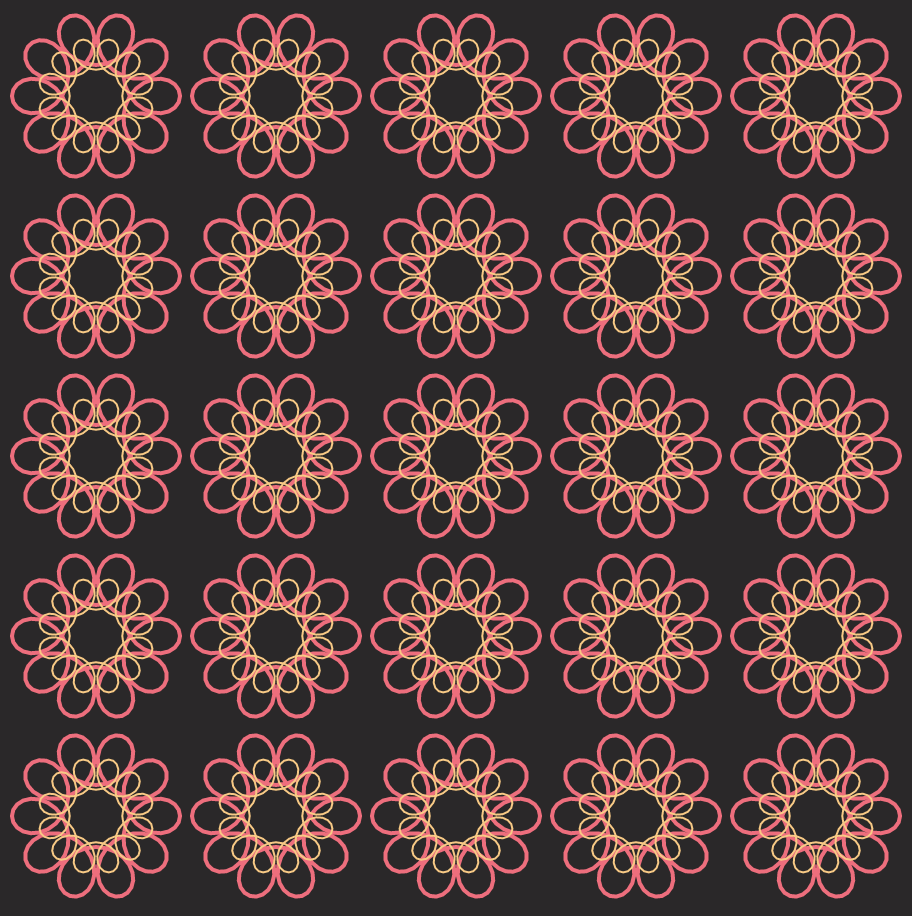
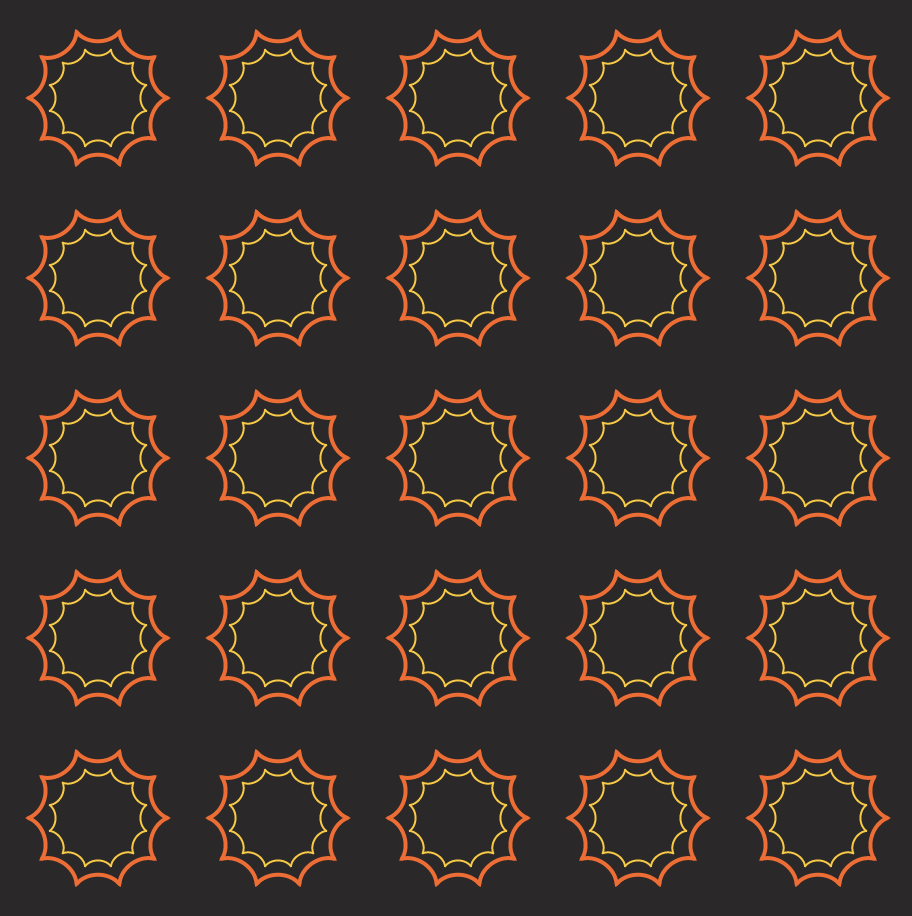
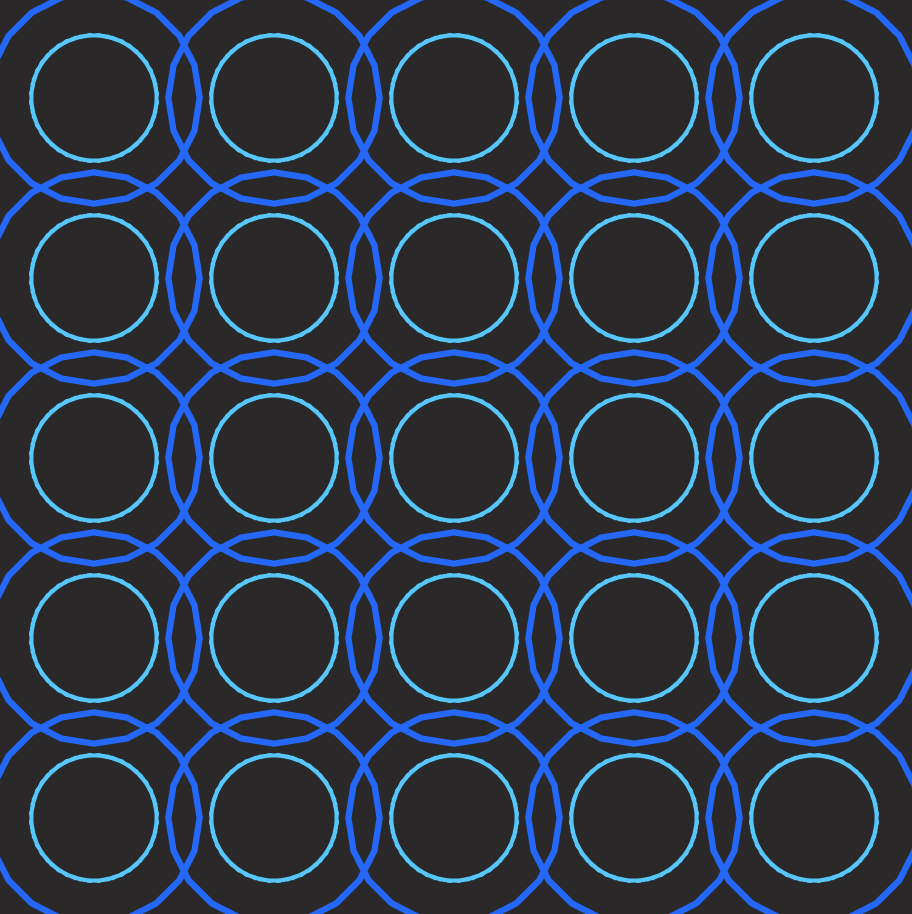
For this project, I wanted show how it would be possible to show diverse configurations only using two shapes. I tried to play around with the curves to create wallpaper-like patterns. For the interaction, when the mouseX/Y leads to top-right/bottom-left areas, it presents the simplest form while the curves show the most complicated form or nothing when the mouse is on the opposite areas. (color Blue and Orange also resembles the opposite tone of the ocean and the sun)

Looking Outwards – 07

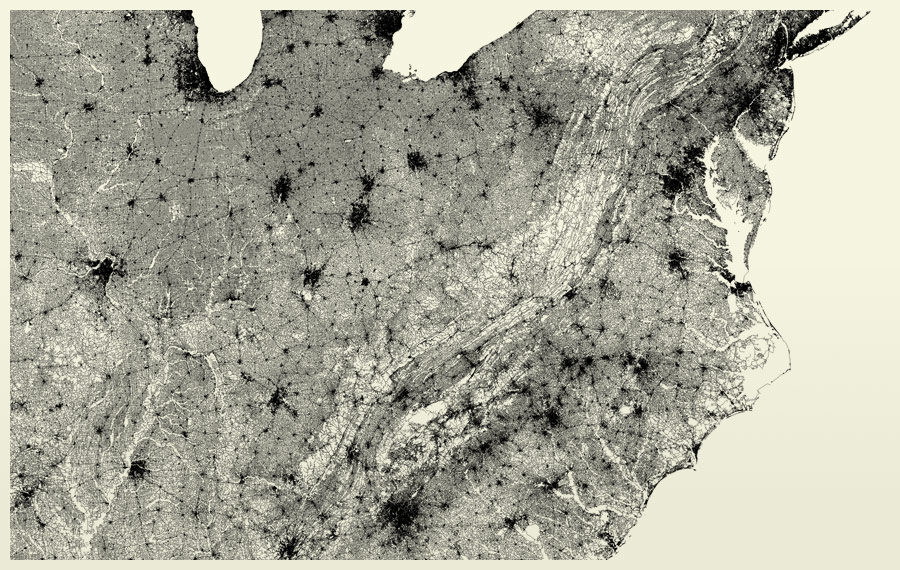
Ben Fry’s piece called All Streets was created on April 24, 2008. It is compilation of 240 million segments of road compressed into the shape of the United States continent. Ben was joined by three teammates – Katy assembled high-resolution images for offset printing, James made sure that the prints’ densities were appropriate for the piece, and Chris helped write software. This software created tiles that could be combined into a high-quality, HD image.

All Streets by Ben Fry (April 24, 2008)

I admire this aspect of the project because compiling such an enormous amount of images into one is a feat, considering that most software has a hard time dealing with images more than 30,000 pixels wide. The software program that he developed is called Processing, an open source programming environment that allows for computational design and interactive media. His artistic sensibility in processing and visualizing data is clearly manifested in the final form of this piece. His interactions with informational data is transformed into piece that takes millions of individual road segments into one unified artwork.

A closer look at All Streets – roadless terrain creates the topography of the Appalachian Mountains

LO-07

Ben Fry is a leading member of Fathom, a team that creates programs and applications to visualize, analyze, and understand data of all sorts. They have a wide range of projects, such as COiN, which helps people read and understand contracts. The program breaks the document down into sections, provides definitions, and allows the reader to switch back and forth easily throughout the “living” document.
I like this project because everybody will have to sign multiple contracts and agreements in their lifetimes and most people will have questions as they are going through them. These would traditionally be directed to a lawyer, which can get expensive. This program provides a more even playing field for the average person, without needing to add the expense of a lawyer.
The algorithms that generated the work most likely focus on data analysis and key words that break the document into sections. While the creators do not have much artistic day in data, they were able to use creativity to determine how the agreements are presented in the program. Overall, this program has the potential to serve any adult who has access to a computer, making contracts less daunting overall.

COiN, a project by Fathom, founded in 2010

LO – 07 – Information Visualization

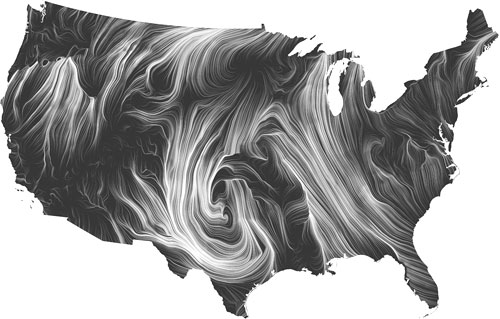
Fernanda Viegas, Wind Map, 2012. 

Fernanda Viegas’ “Wind Map”.

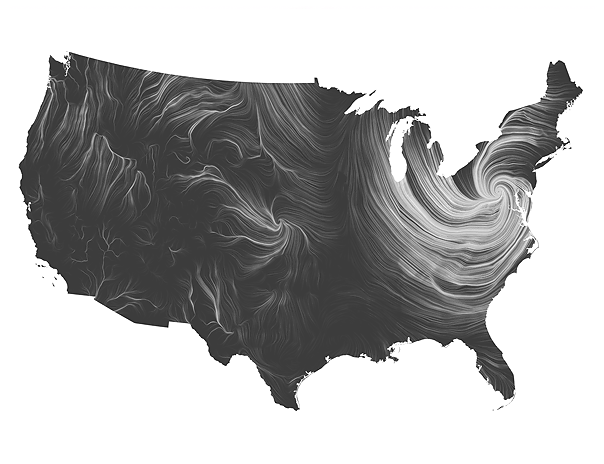
This project creates a real-time, or a “living portrait”, wind map of the United States during the winter months and uses the data to visualize an art piece in the process. The project uses motion of white lines over a black map of the U.S. to show the wind motions and heaviness by layering the white wind lines. 

Viegas notes that while it was an artistic endeavor originally, the map provides a variety of functions where people have used it for bird migration patterns, bicyclists, etc. Viegas uses data for this project from the National Digital Forecast Database and combines it with computational circulations that project the data in an abstracted, artistic way. The Wind Map uses “comet-like trails” to show the motion of the wind lines. The map is made entirely in HTML and JavaScript. 

Hurricane Sandy, October 30 Wind Map.

This project is successful in its multi-purpose presentation of wind data in the U.S. and its additional artistic purpose. Computationally creating the Wind Map creates a direct way to have updates to the data sets as the wind directions, intensity, etc. changes from day to day. This conveys accurate data for the day but also creates an art piece that is mesmerizing because of its constant movement. The Wind Map additionally impressively communicates the forecast data in a simplistic and easy to understand map consisting of two main elements; the base map and the wind lines.

Project 07: Butterfly Curve

sketchDownload

var n = 100; //Number of points
var r = 50; //Radius

var x = [] //List of X values
var y = [] //List of Y values
var t = [] //Parameter 


function setup() 
{
	createCanvas(480, 480);
	frameRate(60)
	//Initialize Butterfly curve by assigning X, Y and T values
    for (let i = 0; i < n; i++) {
        t[i] = random(0, 180);
        //Equations taken from https://mathworld.wolfram.com/ButterflyCurve.html
        x[i] = r * sin(t[i]) * (exp(cos(t[i])) - 3 * cos(4 * t[i]) - pow(sin(t[i] / 10), 5));
        y[i] = r * cos(t[i]) * (exp(cos(t[i])) - 3 * cos(4 * t[i]) - pow(sin(t[i] / 10), 5));
    }
}


function draw() 
{

    background(0);
    //Make (0,0) center of canvas
    translate(width / 2, height / 2);


    let my = map(mouseY,0,height,18*PI,6*PI); //Map mouse Y to number of rotation iterations of butterflies
    push();
   	noFill();
    stroke(100)
    strokeWeight(0.25)

    //Begin curve for butterfly
    beginShape();
    for (let i = 0; i < my; i += 0.01)
    {
    	//Equations taken from https://mathworld.wolfram.com/ButterflyCurve.html
      	let bx = r * sin(i) * (exp(cos(i)) - 3 * cos(4 * i) - pow(sin(i / 10), 5));
      	let by = r * cos(i) * (exp(cos(i)) - 3 * cos(4 * i) - pow(sin(i / 10), 5));
      	//Vertex has X and Y points corresponding to parametric equations
      	vertex(bx,by)
    }
    endShape();
    pop();

    //Draw flying circles
    push();
    fill(255);
    noStroke();
    //Loop for number of circles
    for (let i = 0; i < n; i++) 
    {
    	let mx = map(mouseX,0,width,-0.005,0.005); //Map mouse X to speed at which parameter changes (from negative to positive speeds)
        t[i] += mx; //Add mapped mouse X to parameter

        //Reset parameter if it exceeds 180 degrees
        if (t[i] > 180)
        {
        	t[i] = 0;
        }

        //Equations taken from https://mathworld.wolfram.com/ButterflyCurve.html
        x[i] = r * sin(t[i]) * (exp(cos(t[i])) - 3 * cos(4 * t[i]) - pow(sin(t[i] / 10), 5));
        y[i] = r * cos(t[i]) * (exp(cos(t[i])) - 3 * cos(4 * t[i]) - pow(sin(t[i] / 10), 5));

        //Draw circle
        circle(x[i], y[i], 3);
    }
    pop();
}

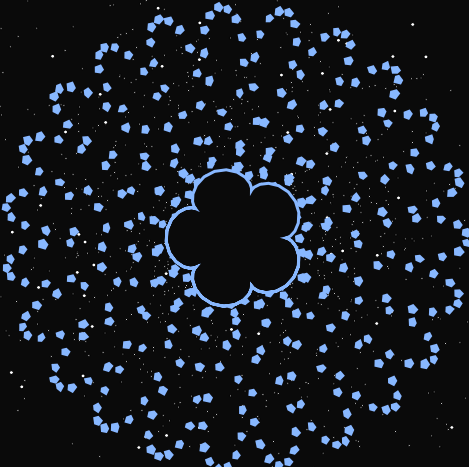
The Butterfly curve seemed really similar to the Lorentz attractor curves I was looking for last week’s Looking Outwards. I initially wanted to make a circle follow the trail of the curve and have the mouseX determine the speed, however I realized that it was actually easier to have multiple circles follow the path.

MouseX controls speed and direction of circles, MouseY controls amount of curve iterations of the butterfly curve.

Looking Outwards 7:

Nathalie Miebach combines her love of art, science, and data analysis to create interesting sculptures that reflect the primal forces of nature. She transforms data taken from massive storms and turns them into 3-dimensional sculptures. Meteorological data is taken and then transformed into sound, which is then arranged into a “musical score” built entirely of weather data. This score is then combined with the sounds of human experiences and interpretations of the weather, creating a juxtaposition of objective and subjective data. This musical composition is then turned into a sculpture that reflects both the empirical data, and nuanced human emotions of a storm.

I really appreciate the subjective, sensational effect the sculptures have. Some of them look like actual buildings being torn apart by the wind, and some look like the distortions and disturbances in the air as a storm rips through.

Nathalie Miebach's Sculptural Soundtracks for Storms – Brain Pickings
The chaos of a storm ripping through a city
Colorful Basket Weaving Sculptures by Nathalie Miebach Transform Weather  Data into Visual Art | Colossal
The volume and density of a hurricane

Project – 07 – Curves

sketch
/* 
 * Amy Lee 
 * amyl2
 * Section B 
 */ 

// Array variables for star X and Y positioning 
var starX = []; 
var starY = []; 
var r = 5; 
var r2 = 10; 
var nPoints = 5; 
var nPoints2 = 10; 
var separation = 120; 

function setup() {
    createCanvas(480,480);
    // Random placement of stars
    for (i = 0; i < 60; i++){
    	starX[i] = random(10,470); 
    	starY[i] = random(10,470); 
    }
    frameRate(7); 
}

function draw() {
	background(10); 

	// Time variable for stars 
	var s = second(); 

	// Setting randomGaussian ellipses in the background 
    push(); 
    translate(width/2,height/2); 
    for (var i = 0; i < 1000; i++){
    	fill(255); 
    	ellipse(randomGaussian(0,120),randomGaussian(0,120),2.2,2.2);
    }
    pop(); 

    // New star every second
    for( i = 0; i < s; i++){
    	fill(255); 
    	ellipse(starX[i],starY[i],4,4); 
    }

	// Calling on Hypotrochoid Function
    push(); 
    noStroke(); 
    translate(width/2,height/2); 
    drawHypotrochoid(); 
    pop();

    // Calling on Ranuculus Function
	drawRanuculus();

	// Drawing hidden alien, only appears when mouse distance from center is < 50
	push(); 
	for(var y = 200; y < 280; y += 5){
		for (var x = 200; x < 280; x += 5){
			noStroke(); 
			fill(173,212,173); 
			if(nearMouse(x,y) == true){
				// Face
				ellipse(241,240,70,70); 
				// Eye 
				fill(255); 
				ellipse(241,240,40,40); 
				// To make eye follow mouseX when mouseX is near 				
				fill(173,212,173); // green iris
				if (mouseX < 256 & mouseX > 230){ 
					ellipse(mouseX,240,25,25);
				} else {
					ellipse(241,240,25,25); 
				}
				// Pupil 				
				fill(0) 
				if (mouseX < 256 & mouseX > 230){ 
					ellipse(mouseX,240,20,20);
				} else {
					ellipse(241,240,20,20); 
				}				
				fill(255); 
				ellipse(248,230,10,10); 
			}
		}
	}
	pop(); 
} 


function drawHypotrochoid() {
	// Setting Hypotrocoid Variables
	for (var t = 0; t < 360; t++){
  		var h = map(mouseY, 0, height/4, height/2, height/4);
    	var a = 150;
    	var b = map(mouseY,0,height/2,1,2);

	var x = (((a-b)*cos(radians(t))) + h*cos(((a-b)/b)*radians(t))); 
	var y = (((a-b)*sin(radians(t))) - h*sin(((a-b)/b)*radians(t)));

	// Draw pentagons 
    beginShape();
    for (var i = 0; i < nPoints; i++) {
    	noStroke(); 
    	// Pentagons change color as mouseY changes 
		if (mouseY <= 80){
			fill(255,142,157); //Red 
		} else if (mouseY > 80 & mouseY <= 160){
			fill(255,210,142); // Orange 	
		} else if (mouseY > 160 & mouseY <= 240){
			fill(255,252,142); // Yellow 	
		} else if (mouseY > 240 & mouseY <= 320){
			fill(192,255,142); // Green 
		} else if (mouseY > 320 & mouseY <= 400){
			fill(142,188,255); // Blue 	
		} else if (mouseY > 400 & mouseY <= 480){
			fill(157,142,255); // Purple	
		} else {
			fill(random(255),random(255),random(255)); 
		}	
		// Setting variables for pentagons
        var theta = map(i, 0, nPoints, 0, TWO_PI);
        var px = r * cos(theta);
        var py = r * sin(theta);
        // Draw pentagon shape with random jitter 
        vertex(x+px + random(-1, 1), y+py + random(-1, 1));
   	}
    endShape(CLOSE);
	}
}

function drawRanuculus() {
	push(); 
	translate(2 * separation, height/2);
	// Setting stroke colors according to how mouseY changes 
		if (mouseY <= 80){
			stroke(255,142,157); //Red 
		} else if (mouseY > 80 & mouseY <= 160){
			stroke(255,210,142); // Orange 	
		} else if (mouseY > 160 & mouseY <= 240){
			stroke(255,252,142); // Yellow 	
		} else if (mouseY > 240 & mouseY <= 320){
			stroke(192,255,142); // Green 
		} else if (mouseY > 320 & mouseY <= 400){
			stroke(142,188,255); // Blue 	
		} else if (mouseY > 400 & mouseY <= 480){
			stroke(157,142,255); // Purple	
		} else {
			stroke(random(255),random(255),random(255)); 
		}	
	strokeWeight(3); 
	fill(10); 
	beginShape();
    for (var i = 0; i < nPoints2; i += 0.1){
      var px2 = r2 * (6 * cos(i) - cos(6 * i));
      var py2 = r2 * (6 * sin(i) - sin(6 * i));
      vertex(px2, py2);
    }
    endShape();
    pop()
}

function nearMouse(x,y){
	if(dist(x,y,mouseX,mouseY) < 50){
		return true;
	} else {
		return false; 
	}
}


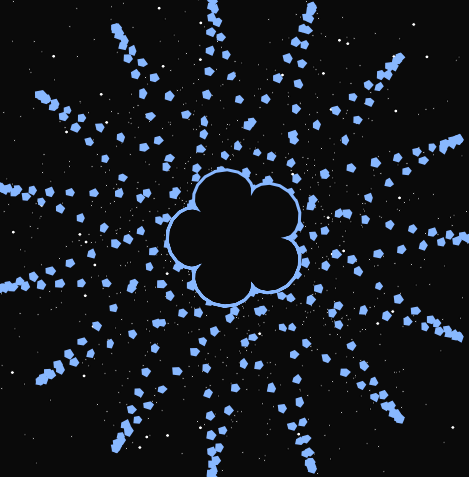
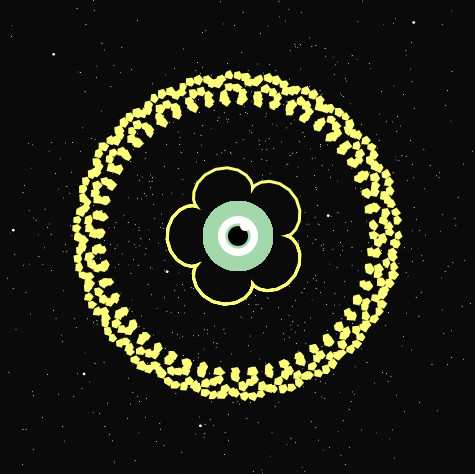
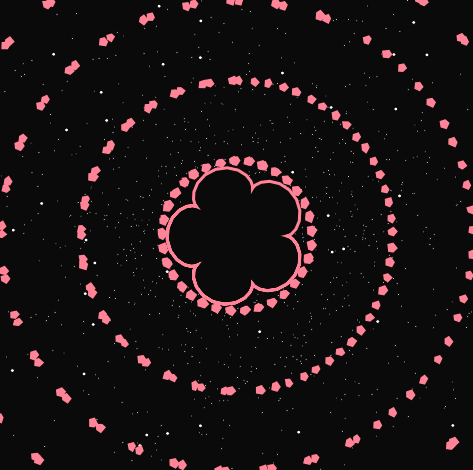
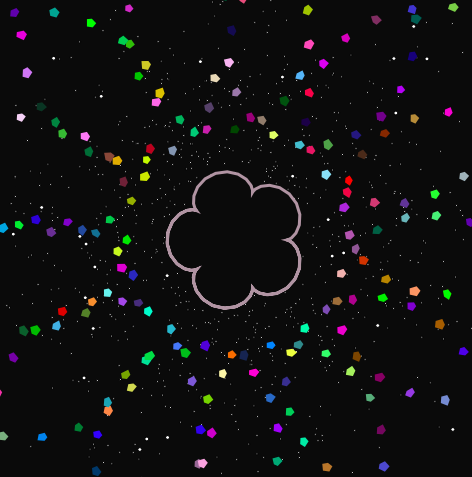
For this project, I played around with the Hypotrochoid and Ranuculus curves to create these designs. I wanted to give this an outer space feel, so I also added a Gaussian distribution of ellipses to resemble stars in the background. When the distance of the mouse is close to the center, an alien eye is revealed. The colors of the curves according to the mouseY position and an additional larger star is added every second. It definitely has a chaotic look to it but I thought that it fit the theme since space is far from organized.
Project-07: Spirographs

Interactive Spirographs with the Heart Curve

{scroll to bottom for final p5.js embed}

https://editor.p5js.org/ssahasra/sketches/HZjqQv5Q2

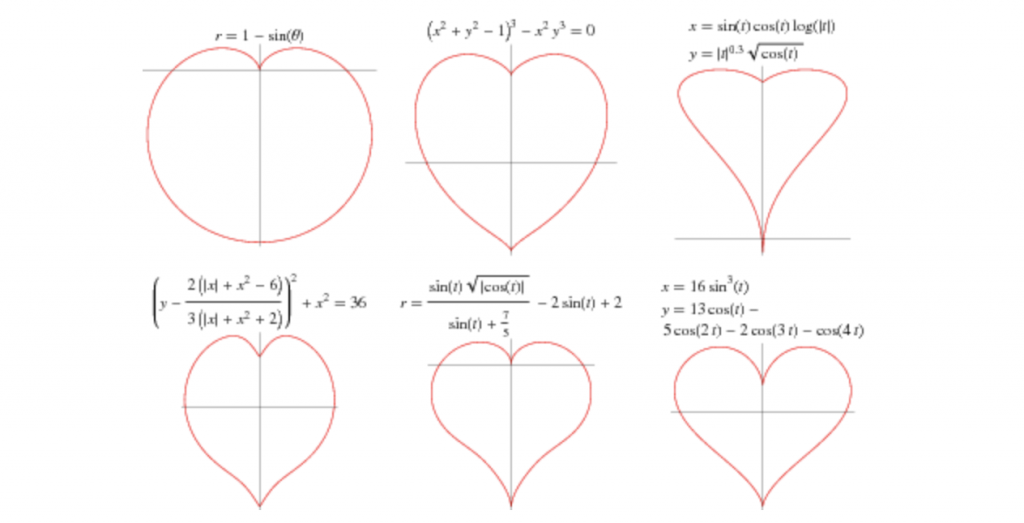
To create my interactive spirograph for this week’s project, my first step was to review existing curves on the Wolfram website and pick one that is simple, but can also give me exciting visuals when I use the combination of mouseX, map(), and constrain() functions.

I chose the Heart Curve, not only because it is an iconic shape/symbol but it’s parametric function allowed me to tweak the shape on all three of it’s curves.

If you notice this image, the cusp or crevice, the tip and the two mirroring bulges are the three curves that can be manipulated.

Using the given starter code, I first replaced the parametric equations and explored different types of curves, including the eight curve and the bean curve.

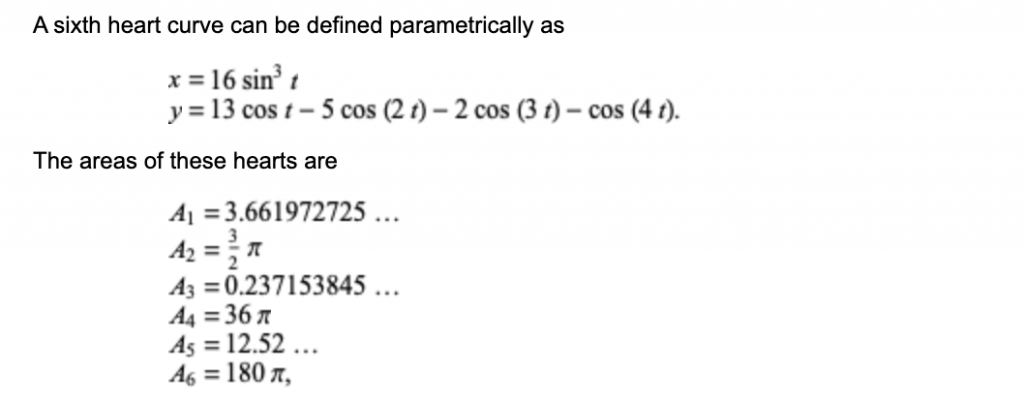
Finally, after fixing on the heart curve, I used the following parametric equations for the value of x and y:

a1 = 16, a2 = 13 and so on.

In the draw function, I set a1, a2 and a3 as variables and then used the mouseX to control the bulge and cusp of the heart.

Furthermore, I also added the rotate() function to setup, to reveal how the shapes create a spirograph. The frameRate() was also used to control the speed, to see the interactions and mouseX induced changes more clearly.

Here, is a video of an intermediate stage of the program:

One more important aspect of this effect is that I activated the alpha value in the fill() function so the mouseX movement also adds dynamic transparencies similar to “onion layers” in flash.

LO 07 – Information Visualization

PENNY

By Stamen Design


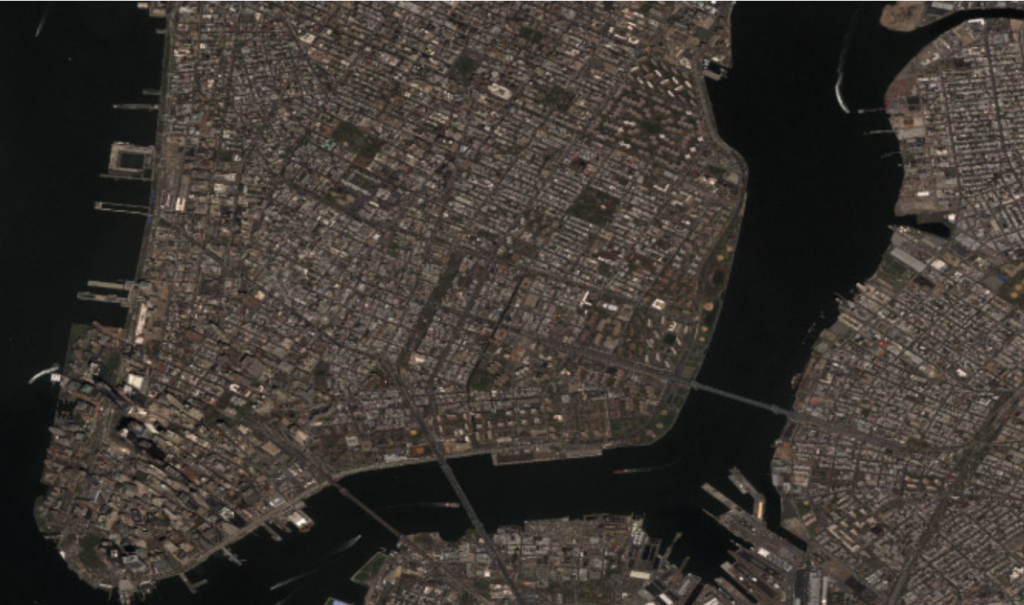
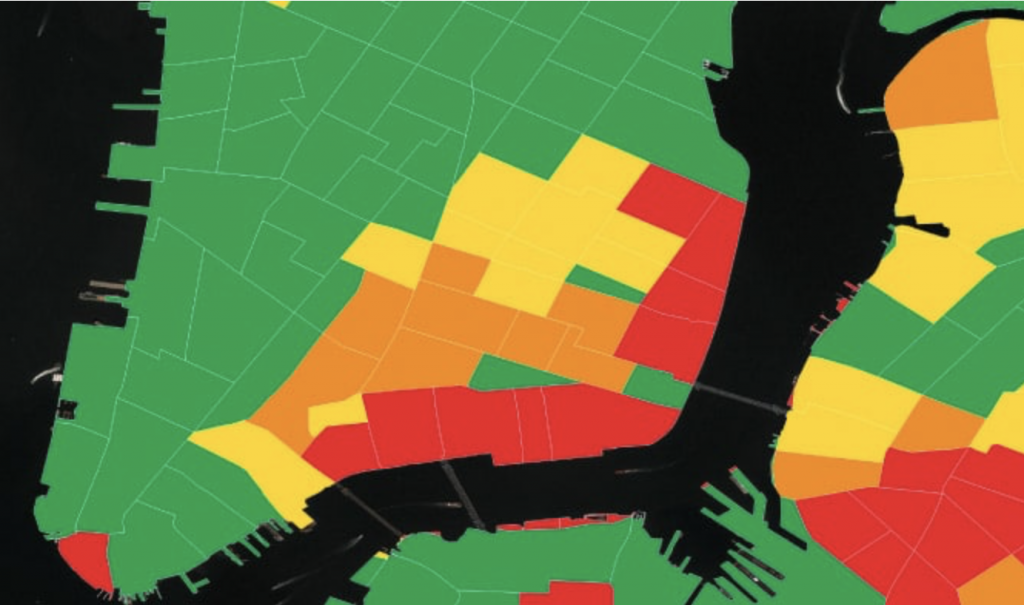
Today, I will be talking about an AI Project called Penny done by Stamen Design. This simple tool is designed to help understand what wealth and poverty look like to a artificial intelligence built on machine learning using neural networks. Penny is built using income data from the U.S. Census Bureau, overlaid on DigitalGlobe satellite imagery. This information was then given to a neural network. Trained to predict the average household incomes in any area in the city using data from the census and the satellite. The AI looks for patterns in the imagery that correlate with the census data, and over time, users are able to ask the model what it thinks income levels are for a place just from a satellite image. This project is really interesting to me because this visualization and AI can be used to improve the quality of life, and physically see the imbalances within a neighborhood for better wealth distribution.

View project here