LO – Sound Art

“Weather Thingy”, the invention by Adrien Kaeser uses real-time climate data to produce sound. The two main components are a weather station mounted on a tripod microphone, and a custom-built controller connected to the weather station. The controller will use variations on the weather, and the user’s input, to constrain or amplify values to produce different sounds on Kaeser’s keyboard. I am interested as to how this technology/application can be taken further. It would be interesting to see how this could be used long-term and produce music based on weekly or yearly weather.

LO-Sound Art

Iris Yip iyip
15-104 Section D
LO-04

A project with an interesting application of sound art is Prélude in ACGT – Sonification of personal (DNA) data by Pierry Jacquillard. The project uses DNA (chromosomes 1-22, XY) and converts it to artificial sound, successfully creating music. His intention was to create an intersection between nature’s “core structure” (DNA) and “artificial, man-made (CODE)”, exploring different interpretations of the idea of one’s personal “data” and deconstruct it to understand the way that these different processes translate into one another.

He created five different interfaces for the intention of simplifying and breaking down the conversion process. I was personally drawn to this project because I was fascinated with the way that it took a natural processes like the structure of our DNA and chromosomes and translated it into sound through the similarities between our biology and the way we’ve intentionally structured and built our coding languages. The way that the artist structured the conversion between our DNA and the four types of molecular bases (ACGT) with code shows a good grasp of both the biological and technological processes involved. The “rationale” (or discussion) behind the piece and how information is retrieved, understood, and maintained in different ways also produced a fascinating conversation about the nature of individuality and the creation of life itself.

Project 4 – String Art

I had a lot of fun changing the colors and locations of the lines based on mouse movement. It was also cool to see the strings and colors overlap and interact together.

Maggie String Art
//Maggie Ma
//Section D

var dx1;
var dy1;
var dx2;
var dy2;
var numLines =100;

function setup() {
    createCanvas(400, 500);
    background(200);
    line(0, 0, 0, 400);
    line(0, 400, 0, 500);
    dx1 = (0)/numLines;
    dy1 = (500-0)/numLines;
    dx2 = (400-0)/numLines;
    dy2 = (500-500)/numLines;
}

function draw() {
	background(mouseX,mouseY,100); //colorful background changes w/ mouse
	strokeWeight(.75);

    var x1 = 0;
    var y1 = 0;
    var x2 = 400;
    var y2 = 400;
    for (var i = 0; i <= numLines; i += 1) {

    	stroke(0,0,255) //bottom left lines (blue)
        line(x1, y1, x2+mouseX, y2);

        stroke(255,0,0); //top right lines (red)
        line(x1+400+mouseX, y1+500, x2-400, y2-400);

        stroke(0,255,0); //top left green lines
        line(x1,y1, x2-400+mouseX, mouseY);

        stroke(mouseY); //moving lines black to white
        line(width/2*(i/20), height/2*(i/20), mouseX*20, mouseY*20);
        line(mouseX,400,i*5,mouseY);
        line(i*5, mouseY, mouseX, 500);
        line(mouseX,i*5, 400, mouseY);

        stroke(mouseX,100,mouseY); //moving lines colorful
        line(0,i*5, mouseX, 0);
        line(0,mouseY, 0, i*10);
     	line(mouseX, i*5, 0, 500);


        x1 += dx1;
        y1 += dy1;
        x2 += dx2;
        y2 += dy2;
    }

}

LO 4 – Sound Art

Images of Ikeda’s Test Pattern sound and light display.

Test Pattern 100m Version

Ryoji Ikeda (2013)

The piece of sound art that I chose to study this week is Ryoji Ikeda’s Test Pattern 100m Version. Ikeda is known for using datasets to create visceral and overwhelming displays of sound and light. The Test Pattern series uses a real-time programming system that converts data such as text, photos, movies, and sounds in barcode patterns of binary 0s and 1s. The purpose of the project is to “examine the relationship between critical points of device performance and the threshold of human perception” (Ryoji Ikeda) by visually displaying intense flickering panels of black and white (which correspond with the barcode patterns) that synchronise perfectly with the audio. The velocity of the moving images is extremely fast, to the point that it’s almost epileptic; viewers stand on the huge flashing screen in a dark room and are enveloped by sound and light.   

Project 4 – String Art

sketch
//simple string art
//hollyl
//section d

var dx1;
var dy1;
var dx2;
var dy2;
var numLines = 25;

function setup(){
	createCanvas(400, 300);
	background(200);
	line(200, 25, 200, 125);
	line(217.67, 132.33, 288.38, 61.17);
	line(225, 150, 325, 150);
	line(217.67, 167.67, 288.38, 238.38);
	line(200, 175, 200, 275);
	line(182.33, 167.67, 111.62, 238.38);
	line(175, 150, 75, 150);
	line(182.33, 132.33, 111.62, 61.17);
	dx1 = (200 - 200)/numLines;
	dy1 = (125 - 25)/numLines;
	dx2 = (288.38 - 217.67)/numLines;
	dy2 = (61 - 132.33)/numLines;
	dx3 = (325 - 225)/numLines;
	dy3 = (150 - 150)/numLines;
	dx4 = (288.38 - 217.67)/numLines;
	dy4 = (238.38 - 167.67)/numLines;
	dx5 = (200 - 200)/numLines;
	dy5 = (275 - 175)/numLines;
	dx6 = (182.33 - 111.62)/numLines;
	dy6 = (238.38 - 167.67)/numLines;
	dx7 = (175 - 75)/numLines;
	dy7 = (150 - 150)/numLines;
	dx8 = (182.33 - 111.62)/numLines;
	dy8 = (132.33 - 61.17)/numLines;
}

function draw(){

	var x1 = 200;									//north-north-east
	var y1 = 25;
	var x2a = 217.67;
	var y2a = 132.33;
	for(var i = 0; i <= numLines; i += 1){
		line(x1, y1, x2a, y2a);
		x1 += dx1;
		y1 += dy1;
		x2a += dx2;
		y2a += dy2;
	}

	var x2b = 288.38;								//north-east-east
	var y2b = 61.17;
	var x3a = 225;
	var y3a = 150;
	for(var i = 0; i <= numLines; i += 1){
		line(x2b, y2b, x3a, y3a);
		x2b -= dx2;
		y2b -= dy2;
		x3a += dx3;
		y3a -= dy3;
	}

	var x3b = 325;									//south-east-east
	var y3b = 150;
	var x4a = 217.67;
	var y4a = 167.67;
	for (var i = 0; i <= numLines; i += 1){
		line(x3b, y3b, x4a, y4a);
		x3b -= dx3;
		y3b += dy3;
		x4a += dx4;
		y4a += dy4;
	}

	var x4b = 288.38;								//south-south-east
	var y4b = 238.38;
	var x5a = 200;
	var y5a = 175;
	for (var i = 0; i <= numLines; i += 1){
		line(x4b, y4b, x5a, y5a);
		x4b -= dx4;
		y4b -= dy4;
		x5a += dx5;
		y5a += dy5;
	}

	var x5b = 200;									//south-south-west
	var y5b = 275;
	var x6a = 182.33;
	var y6a = 167.67;
	for (var i = 0; i <=numLines; i += 1){			
		line(x5b, y5b, x6a, y6a);
		x5b += dx5;
		y5b -= dy5;
		x6a -= dx6;
		y6a += dy6;
	}

	var x6b = 111.62;								//south-west-west
	var y6b = 238.38;
	var x7a = 175;
	var y7a = 150;
	for (var i = 0; i <= numLines; i += 1){
		line(x6b, y6b, x7a, y7a);
		x6b += dx6;
		y6b -= dy6;
		x7a -= dx7;
		y7a += dy7;
	}

	var x7b = 75;									//north-west-west
	var y7b = 150;
	var x8a = 182.33;
	var y8a = 132.33;
	for (var i = 0; i <= numLines; i += 1){
		line(x7b, y7b, x8a, y8a);
		x7b += dx7;
		y7b += dy7;
		x8a -= dx8;
		y8a -= dy8;
	}

	var x8b = 111.62;								//north-north-west
	var y8b = 61.17;
	var x1b = 200;
	var y1b = 125;
	for (var i = 0; i <= numLines; i += 1){
		line(x8b, y8b, x1b, y1b);
		x8b += dx8;
		y8b += dy8;
		x1b += dx1;
		y1b -= dy1;
	}

	noLoop();
}

notes:

LO 4

I have decided to focus on is Christina Kubisch’s Cloud, once piece of the collection I was able to experience SFMOMA. Kubisch’s Cloud sculpture is a snarl of vivid red wires and cable ties suspended in the gallery space. Visitors experience the audio of the piece by wearing headphones that intercept the electromagnetic transmission from the piece, with each movement changing the audio that is transmitted. General areas have sound recorded from the same space but ultimately are still different sounds. In essence, the viewers become human mixers, moving around or turning their heads to create what they want to hear from Cloud, creating real-time compositions.

Kubisch’s Cloud project started in 2011, and the project has become even more sophisticated since then. The sounds of the Cloud are programmed into different sections of the physical Cloud, creating the interaction fo moving around the Cloud to experience different sounds.

Project 4: String Art

string art cb
var dx1;
var dy1;
var dx2;
var dy2;
var numLines = 200;

function setup() {
    createCanvas(400, 300);
    background(200);
    line(0, 0, 0, 300);
    line(0, 300, 400, 300);
    dx1 = (0-0)/numLines;
    dy1 = (300-0)/numLines;
    dx2 = (400-0)/numLines;
    dy2 = (300-300)/numLines;
}

function draw() {
    strokeWeight(.5);
    background(0);

    var x1 = 0;
    var y1 = 0;
    var x2 = 0;
    var y2 = 300;

    for (var i = 0; i <= numLines; i += 1) {

        //bottom left corner
        stroke(mouseX, mouseY, 100);
        line(x1, y1, x2, y2);
        //top right corner
        line(x1 + 400, y1, x2, y2 - 300);
        //moving lines Y
        stroke(mouseY, 100, mouseX);
        line(i*4, mouseY, 400, 0);
        line(0, 300, i*4, mouseY);
        line(i*4, mouseY, 0, 0);
        line(400, 300, i*4, mouseY);
        //moving lines X
        stroke(mouseX, 100, mouseY);
        line(mouseX, i*3, 400, 0);
        line(0, 300, mouseX, i*3);
        line(mouseX, i*3, 0, 0);
        line(400, 300, mouseX, i*3);
      
        x1 += dx1;
        y1 += dy1;
        x2 += dx2;
        y2 += dy2;
    }
}

My approach to this project involved a lot of trial and error but I had fun experimenting with different parts of the code and seeing what I could make. I wanted to make something interactive, so I made the colors change and the lines follow the mouse position.

LO 4 – Sound Art

For this week’s LO, I was inspired by Adrien Kaeser’s “Weather Thingy” (2018), which is a unique sound controller that utilizes real-time climate data to control and produce music. The device consists of a weather station with 3 climate sensors (a rain gauge, wind vane, and anemometer) that is connected to a custom-built controller. The controller has an interface that enables it to assign the parameters received to audio effects, translating the climate data into midi data for interpretation by musical instruments.

I enjoyed learning about this project because of how it functions in real-time using sensors that collect and interpret data to produce new and different sounds. I thought that the music in the video was very calming and nice to listen to. I’m curious about what sounds would be produced by different types of weather, such as a heavy rain/storm or hot, dry day.

“Weather Thingy” demo video
controller

String Art

sketch
//Jasmin Kim
//Section D

var numLines = 70;


function setup() {
    createCanvas(400, 300);
}

function draw(){
    background(0);
    var x1 = -10;
    var y1 = -10;
    var x2 = width;
    var y2 = height;
    var x = constrain(mouseX, 0, width);
    var y = constrain(mouseY, 0, height);

    for(var i = 0; i <= numLines; i += 1) {     
        stroke(i,150,100);
        line(mouseX, y1*i, x2*i, y2*i);         //right top green line
        stroke(200,i,90);
        line(x1*i,mouseY,x2*i,y2*i);            //left bottom red line
        stroke(i,i,190);
        line(mouseX*i,mouseY*i,width,height);   //blue line going over red and green

    }
    for(var i=0; i<= width; i+=30){
        stroke(255,255,0);                      //yellow curve
        line(mouseX, i, i, height - mouseY)
        line(mouseX, i, i, width - mouseX)
        stroke(255);                            //white curve
        line(width-i,y,x,height-i);     


    }
}

While I was processing this coding, I tried to display contrasting lines depending on each other’s position. I also thought about how the lines will move when my mouse moves towards the left or right.

Project04: String Art

sketch
/*
Bon Bhakdibhumi
bbhakdib
Section D
*/
var dx1;
var dy1;
var dx2;
var dy2;
var dx3;
var dy3;
var dx4;
var dy4;
var dx5;
var dy5;
var dx6;
var dy6;
var dx7;
var dy7;
var dx8;
var dy8;
var numLines = 15;

function setup() {
  createCanvas(400, 300);
  text("p5.js vers 0.9.0 test.", 10, 15);
}

function draw() {
  background(255);
   
  var backLines = 20;
  // green and yellow green rays
  strokeWeight(2.5);
  stroke(39, 183, 121);
  line(-24, 171, 30, -2); // green reference line
  stroke(158, 191, 67);
  line(31, -13, 277, 36); // yellow reference line
  
  var dx15 = (30+24)/backLines;
  var dy15 = (-2-171)/backLines;
  var dx16 = (277-31)/backLines;
  var dy16 = (36+13)/backLines;
  var x15 = -24;
  var y15 = 171;
  var x16 = 31;
  var y16 = -13;
  for (var i = 0; i <= backLines; i ++) {
    strokeWeight(0.7);
    // if statement for equal amout of green and yellow green rays
    if (i < backLines/2) {
    stroke(39, 183, 121);
    } else {
      stroke(158, 191, 67);
    }
    line(x15, y15, x16, y16);
    x15 += dx15;
    y15 += dy15;
    x16 += dx16;
    y16 += dy16;
  }
  // lines that make up the octagon
  strokeWeight(3);
  stroke(0, 144, 85);
  line(25, 90, 101, 15); // green line
  
  stroke(241, 233 , 2);
  line(108, 12, 220, 12); // yellow line
  
  stroke(246, 137, 31);
  line(224, 13, 303, 92); // orange line 
  
  stroke(237, 28 ,36);
  line(306, 100, 306, 212); // red line
  
  stroke(122, 53, 148);
  line( 304, 216, 224, 295,); // purple line
  
  stroke(73, 78, 161);
  line(220, 296, 107, 296); // indigo line
  
  stroke(0, 114, 185);
  line(102, 292, 22, 213); // blue line 
  
  stroke(0, 153, 192);
  line(22, 205, 22, 92); // blue green
  
  // delta x & y for all the lines that make up the octagon
  dx1 = (101-25)/numLines;
  dy1 = (15-90)/numLines;
  dx2 = (220-108)/numLines;
  dy2 = (12-12)/numLines;
  dx3 = (303-224)/numLines;
  dy3 = (92-13)/numLines;
  dx4 = (306-306)/numLines;
  dy4 = (212-100)/numLines;
  dx5 = (224-304)/numLines;
  dy5 = (295-216)/numLines;
  dx6 = (107-220)/numLines;
  dy6 = (296-296)/numLines;
  dx7 = (22-102)/numLines;
  dy7 = (213-292)/numLines;
  dx8 = (22-22)/numLines;
  dy8 = (92-205)/numLines;
  
  // x & y coordinates for all the lines that make up the octagon
  var x1 = 25;
  var y1 = 90;
  var x2 = 108;
  var y2 = 12;
  var x3 = 224;
  var y3 = 13;
  var x4 = 306;
  var y4 = 100;
  var x5 = 304;
  var y5 = 216;
  var x6 = 220;
  var y6 = 296;
  var x7 = 102;
  var y7 = 292;
  var x8 = 22;
  var y8 = 205;
  
  // lines that make up the outer layer of the octagon
  strokeWeight(1);
  for (var i = 0; i <= numLines; i ++) {
    // green
    stroke(0, 144, 85);
    line(x1,y1, x2, y2);
    x1 += dx1;
    y1 += dy1;
    x2 += dx2;
    y2 += dy2;
  }
   
  x2 = 108;
  y2 = 12;
  for (var i = 0; i <= numLines; i ++) {
  // yellow
    stroke(241, 233 , 2);
    line(x2, y2, x3, y3);
    x2 += dx2;
    y2 += dy2;
    x3 += dx3;
    y3 += dy3;
   }
  
  x3 = 224;
  y3 = 13;
  for (var i = 0; i <= numLines; i ++) {
    // orange
    stroke(246, 137, 31);
    line(x3, y3, x4, y4);
    x3 += dx3;
    y3 += dy3;
    x4 += dx4;
    y4 += dy4;
  }
  
  x4 = 306;
  y4 = 100;
  for (var i = 0; i <= numLines; i ++) {
    // red
    stroke(237, 28 ,36);
    line(x4, y4, x5, y5);
    x4 += dx4;
    y4 += dy4;
    x5 += dx5;
    y5 += dy5;
  }
  
  x5 = 304;
  y5 = 216;
  for (var i = 0; i <= numLines; i ++) {
    // purple
    stroke(122, 53, 148);
    line(x5, y5, x6, y6);
    x5 += dx5;
    y5 += dy5;
    x6 += dx6;
    y6 += dy6;
  }
  
  x6 = 220;
  y6 = 296;
  for (var i = 0; i <= numLines; i ++) {
    // indigo
    stroke(73, 78, 161);
    line(x6, y6, x7, y7);
    x6 += dx6;
    y6 += dy6;
    x7 += dx7;
    y7 += dy7;
  }
  
  x7 = 102;
  y7 = 292;
  for (var i = 0; i <= numLines; i ++) {
    // blue
    stroke(0, 114, 185);
    line(x7, y7, x8, y8);
    x7 += dx7;
    y7 += dy7;
    x8 += dx8;
    y8 += dy8;
  }
  
  // Lines that make up the inner layer of the octagon
  x1 = 25;
  y1 = 90;
  x5 = 304;
  y5 = 216;
  for (var i = 0; i <= numLines; i ++) {
    // green
    strokeWeight(1);
    stroke(0, 144, 85);
    line(x1, y1, x5, y5);
    x1 += dx1;
    y1 += dy1;
    x5 += dx5;
    y5 += dy5;
  }
 
  x2 = 108;
  y2 = 12;
  x6 = 220;
  y6 = 296;
  for (var i = 0; i <= numLines; i ++) {
    // yellow
    strokeWeight(2);
    stroke(241, 233 , 2);
    line(x2, y2, x6, y6);
    x2 += dx2;
    y2 += dy2;
    x6 += dx6;
    y6 += dy6;
  }
 
  x3 = 224;
  y3 = 13;
  x7 = 102;
  y7 = 292;
  for (var i = 0; i <= numLines; i ++) {
    //red
    strokeWeight(1);
    stroke(237, 28 ,36);
    line(x3, y3, x7, y7);
    x3 += dx3;
    y3 += dy3;
    x7 += dx7;
    y7 += dy7;
  }
 
  x4 = 306;
  y4 = 100;
  x8 = 22;
  y8 = 205;
  for (var i = 0; i <= numLines; i ++) {
    // blue
    stroke(0, 114, 185);
    line(x4, y4, x8, y8);
    x4 += dx4;
    y4 += dy4;
    x8 += dx8;
    y8 += dy8;
  }
  
  // rays coming out of the octagon
  var frontLines = 25;
  
  // yellow and orange rays
  push();
  translate (-30, 0);
  strokeWeight(2.5);
  stroke(255, 199, 9);
  line(202, -25, 450, 100); // yellow
  stroke(241, 90, 34);
  line(450, 120, 198, 340); //orange
  var dx9 = (450-202)/frontLines;
  var dy9 = (100+25)/frontLines;
  var dx10 = (198-404)/frontLines;
  var dy10 = (340-149)/frontLines;
  var x9 = 202;
  var y9 = -25;
  var x10 = 450;
  var y10 = 120;
  for (var i = 0; i <= frontLines; i ++) {
    strokeWeight(0.7);
    if (i < numLines/2) {
    stroke(255, 199, 9);
    } else {
      stroke(241, 90, 34);
    }
    line(x9, y9, x10, y10);
    x9 += dx9;
    y9 += dy9;
    x10 += dx10;
    y10 += dy10;
  }
  pop();
  
  //dark blue and light blue rays
  push();
  rotate(radians(-2));
  strokeWeight(2.5);
  stroke(49, 192, 211); 
  line(17, 88, -16, 258); // dark blue
  stroke(82, 92, 193);
  line(-25, 287, 255, 308); // light blue
  var dx11 = (-16-17)/frontLines;
  var dy11 = (258-88)/frontLines;
  var dx12 = (255+25)/frontLines;
  var dy12 = (308-287)/frontLines;
  var x11 = 17;
  var y11 = 88;
  var x12 = -25;
  var y12 = 287;
  for (var i = 0; i <= frontLines; i ++) {
    strokeWeight(0.7);
    if (i < numLines/2) {
    stroke(49, 192, 211);
    } else {
      stroke(82, 92, 193);
    }
    line(x11, y11, x12, y12);
    x11 += dx11;
    y11 += dy11;
    x12 += dx12;
    y12 += dy12;
  }
  pop();
  
  // red violet and purple rays
  push();
  translate(-65, 210);
  rotate(radians(-50));
  strokeWeight(2.5);
  stroke(210, 18, 131);
  line(326, 196, 249, 346); // red violet
  stroke(115, 54, 232);
  line(314, 348, 76, 276); // purple
  var dx13 = (249-326)/frontLines;
  var dy13 = (346-196)/frontLines;
  var dx14 = (76-314)/frontLines;
  var dy14 = (276-348)/frontLines;
  var x13 = 326;
  var y13 = 196;
  var x14 = 314;
  var y14 = 348;
  for (var i = 0; i <= frontLines; i ++) {
    strokeWeight(0.7);
    if (i < numLines/2) {
    stroke(210, 18, 131);
    } else {
      stroke(115, 54, 232);
    }
    line(x13, y13, x14, y14);
    x13 += dx13;
    y13 += dy13;
    x14 += dx14;
    y14 += dy14;
  }
  pop();
  noLoop();
}

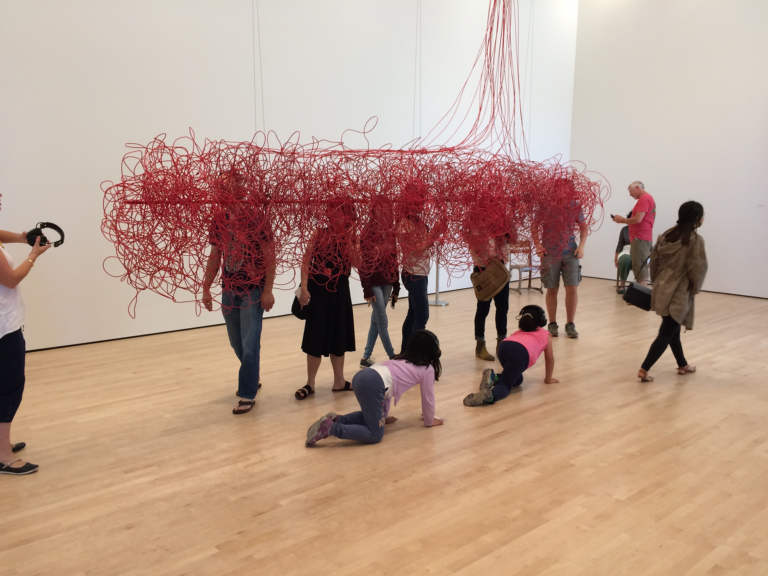
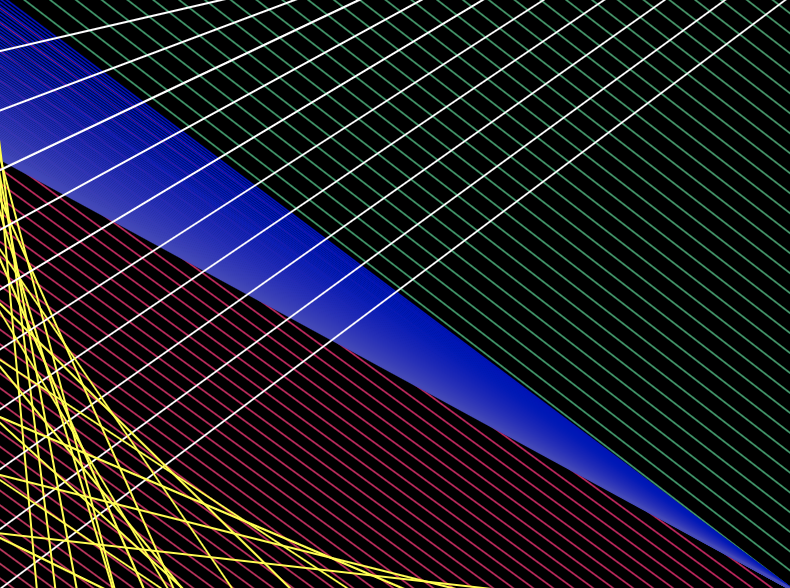
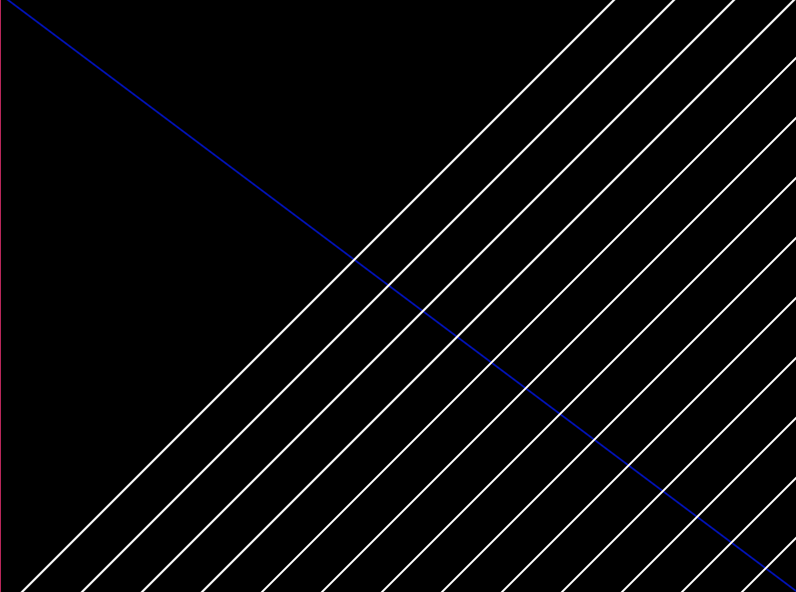
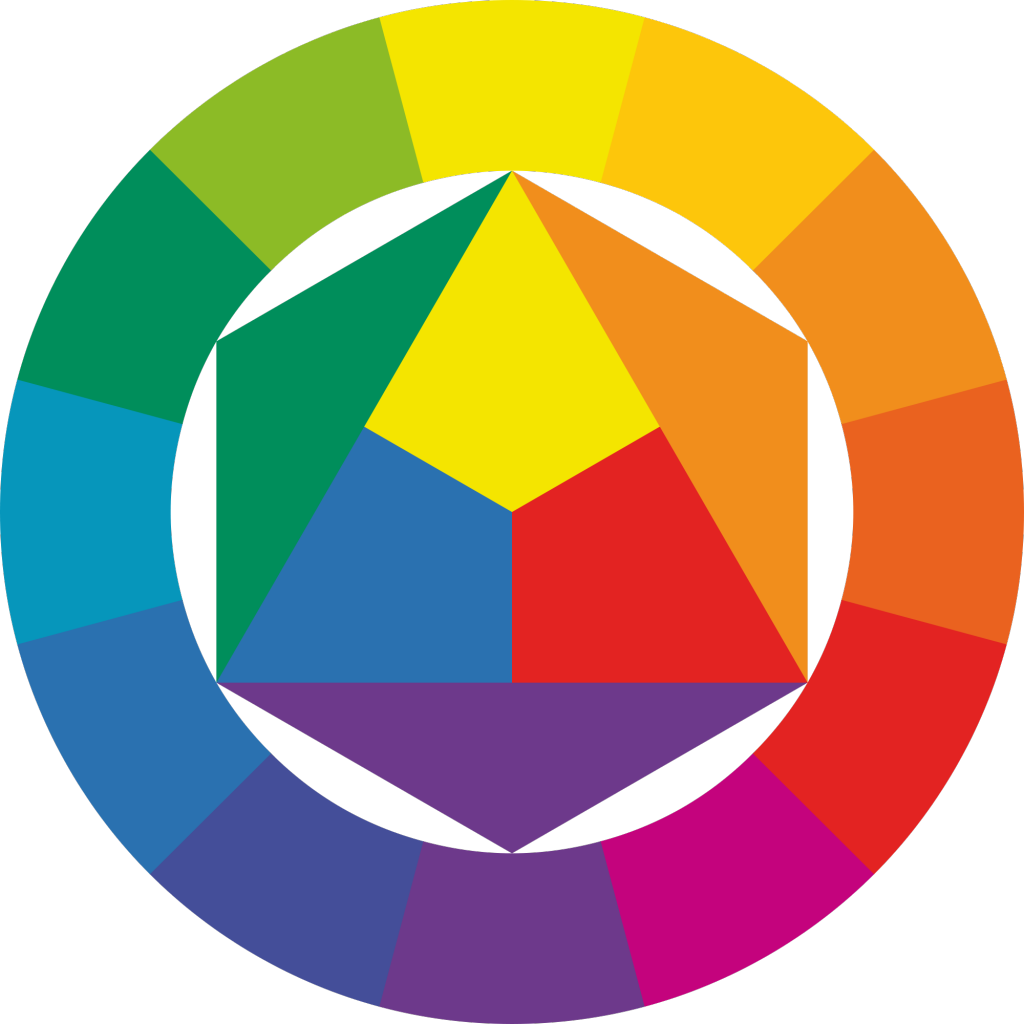
For this project, I reinterpreted Itten’s color wheel. I created the main octagon out of primary and secondary colors. I then added in the rest of the string drawings to show the various outcomes of mixing different colors together.

Itten’s Color Wheel