![[OLD FALL 2019] 15-104 • Introduction to Computing for Creative Practice](../../../../wp-content/uploads/2020/08/stop-banner.png)
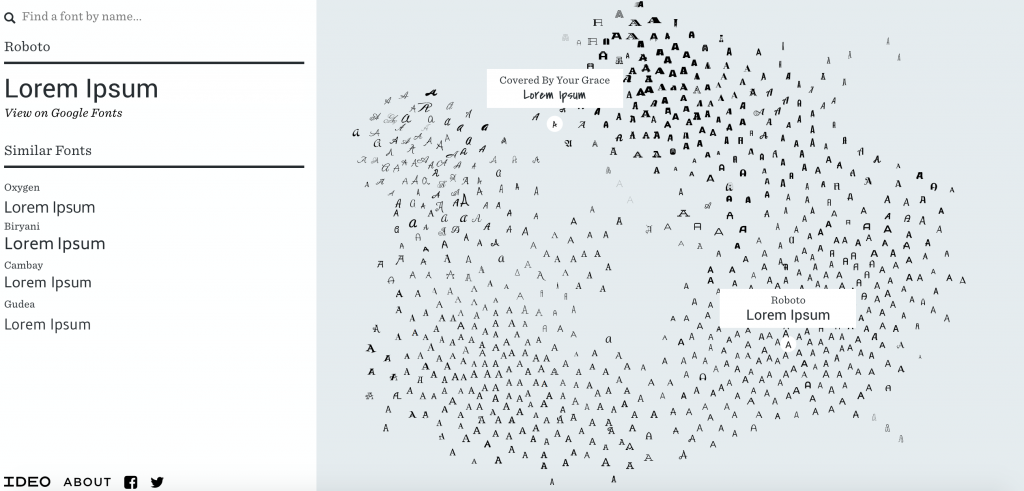
This is a data visualization made by IDEO for mapping a wide variety of fonts. It’s really interesting to see a spectrum of typography laid out in front of you. From calligraphic and more abstract letters to more orderly and well recognized stuff like Roboto or Helvetica, I can imagine this being somewhat useful in helping designers or people working with type to visually see what kinds of fonts they can use. Whats also interesting to note is that the designers at IDEO used an AI that is trained on all kinds of fonts and used it to categorize them in this visualization. While it might be hard for humans to define something mundane like a letter “A”, an artificial intelligence can come up with its own definitions and generate an easy to understand visual for us.