Looking Outwards Week 8

His talk:

One of his works I liked from his instagram:

His website: http://thesystemis.com/

Zach Lieberman describes himself as an “artist, researcher, hacker dedicated to exploring new modes of expression and play.” He studied Fine Arts at Hunter College and has a BFA and MFS in Design and Technology from Parsons, where he currently teaches. His works use technology in a way that augments the body’s ability to communicate, focusing on computer graphics, human-computer interaction, and computer vision.

Throughout the talk, Lieberman was very humorous, genuine, and relatable with his audience. He introduces himself by first talking about his relationship with his father and how his father inspires him. “The world needs stories. Storytelling isn’t about technique, it’s about being fully human.” His personal story is important in contextualizing his work.

I like the way he chose to introduce himself because I feel like it rang true for his work as a whole and the idea of human connection that he works toward.

He uses drawing (live demonstrations of drawing with code) as a vehicle to talk about his projects, as well as introducing other artists and works he likes. For example, using airplane wallpaper to introduce idea of connecting to other places and then connecting that to his project “Play the World”. I liked that project a lot, especially because of the surround sound speakers that serve as a reminder of your physical location in the world.

Ellan Suder Looking Outwards 07

Chris Harrison’s “Word Associations Visualizing Google’s Bi-Gram Data” displays information from a dataset in a really cool and artistic way. The project gathers information from the web to make the graphics.

Here is what Harrison said about how the project processes data: Each of [the rays] represent a different tendency of use (ranging from 0 to 100% in 4% intervals). Words are sorted by decreasing frequency within each ray. I render as many words as can fit onto the canvas. There is a nice visual analogy at play – the “lean” of each ray represents the strength of the tendency towards one of the two terms. As in the word spectrum visualization, font size is based on a inverse power function (uniquely set for each visualization, so you can’t compare across pieces).

One of the visualizations — this one shows the word associations for ‘cold’ and ‘hot’

Words closest to one side are used more for that term (so we can see from the graphic that ‘turkey’ is closely associated with cold, and the ‘water’ is used almost evenly for both cold and hot). I enjoy looking at the graphic and seeing what words usually ‘belong’ together — I imagine something like this is used for predictive text search.

I would also like to see something like this for a different dataset, where instead of gathering word frequencies from the web, you present the terms to many people and ask them to say the first word that comes to their mind.

This was a continuation from his previous Word Spectrum project, which looks more like a typical word cloud. They use the same dataset, but I prefer this one to ‘Spectrum’ since it looks more readable. He has more infographic projects on his site –– I also thought his Wikipedia Top 50 Visualization was interesting to look at.

Project 06 Abstract Clock – Ellan Suder

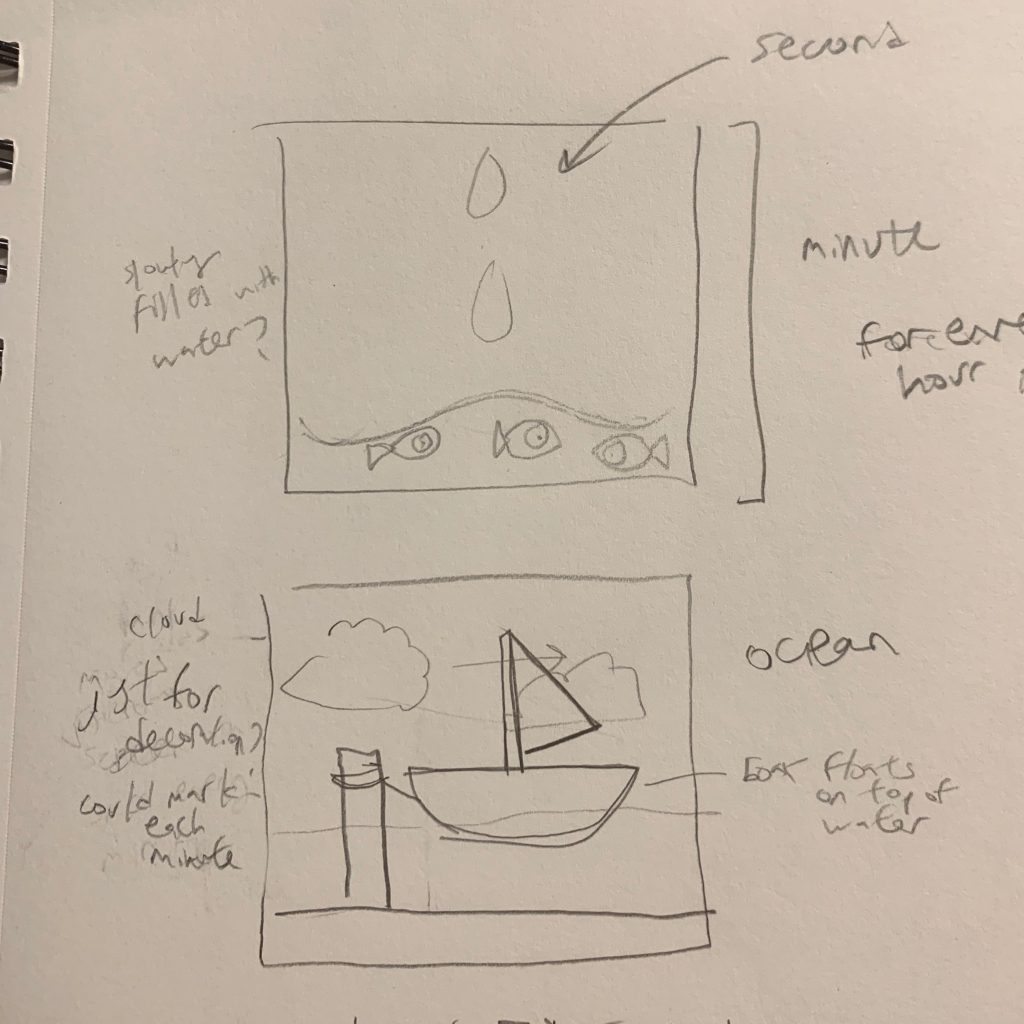
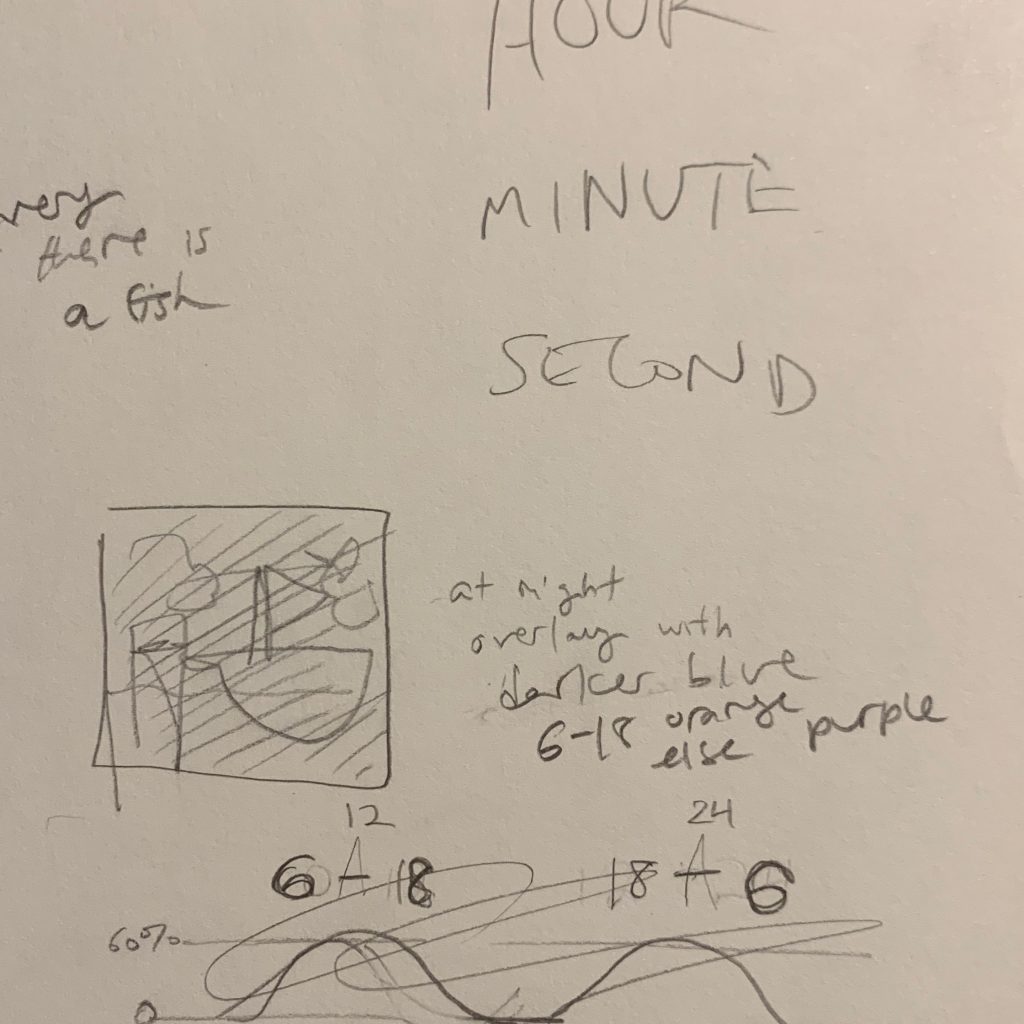
For my clock I made a scene at the ocean. The small clock shows the progression of an hour (when it’s near the end of the screen the hour’s about to change) and the big cloud shows the progression of a minute. The water is controlled by a sin function so it makes a whole cycle in a minute. There is a transparent layer on top of the water (called oceanLight) that also expands and contracts sinusoidally. It has the same x,y value (0,2*height/3+yMin) so that it follows the blue water exactly.

There is also a simple function to make the sky more orange during specific hours (6am to 6pm) and more blue otherwise.

clock

/*
Ellan Suder
15104 1 D
esuder@andrew.cmu.edu
Project-06
*/

var skyColor;
var oceanColor;
var oceanColorLight;
var sandColor;
var logColor;
var notchColor;
var orangeSky;
var purpleSky;
var boatColor;

var prevSec;
var millisRolloverTime;
var hr;

function setup() {
    skyColor = color(140,220,240);
    oceanColor = color(60,140,190);
    oceanColorLight = color(219,222,236,150);
    sandColor = color(220,190,110);
    logColor = color(97,54,35);
    notchColor = color(141,94,43);
    orangeSky = color(248,170,66,40);
    purpleSky = color(129,36,229,40);
    boatColor = color(200,50,50);
    createCanvas(480, 480);
    noStroke();

//gets accurate starting time
    hr = hour() + minute()/60 + second()/60/60;
}

function draw() {
    background(skyColor);  
  
//fetch current time
    var H = hour();
    var M = minute();
    var S = second();
    if (prevSec != S) {
        millisRolloverTime = millis();
    }
    prevSec = S;
    var mils = floor(millis() - millisRolloverTime);
//smooth out seconds and minutes
    var secondsWithFraction = S + (mils / 1000.0);
    var minutesWithFraction  = M + (mils / 60000.0);
    var cloudPositionSec = map(secondsWithFraction,  0, 60, -150, width + 50);
    var cloudPositionMin = map(minutesWithFraction,  0, 60, -75, width + 25);
  
  
//ocean - full cycle every minute
    var seconds = hr + (millis() * 0.001) /60;
    var yMin = sin(seconds * TWO_PI) * height/4; //highest value is 2*height/3 + height/4, lowest is 2*height/3 - height/4. one full cycle is a minute
    var yMin2 = sin(seconds * TWO_PI) * height/20;
    fill(oceanColor);
    rect(0,2*height/3+yMin,
         width,height/4-yMin); //2*height/3 is middle value/start of sin wave. goes up and then down
  
  
//sand + log + light water
    fill(logColor);
    rect(height/4,height/2-30,55,height/2-30,5,5);
    fill(notchColor);
    triangle(height/4+55,2*height/3-5, //top
             height/4+35,2*height/3,
             height/4+55,2*height/3+10);
  
    fill(oceanColorLight);
    rect(0,2*height/3+yMin,
         width,height/20+yMin2);//sits on top of blue water/yMin
  
    fill(sandColor);
    ellipse(width/2,height-30,width+500,70);
    ellipse(height/4+55/2,height-53,120,30);
  
  
//cloud that moves across screen in an hour
    fill(225,235,240);
    drawCloud(cloudPositionMin,height/3,50);
//cloud that moves across screen in a minute
    fill(250,250,250);
    drawCloud(cloudPositionSec,height/5);
  
    boatY=2*height/3+yMin+20;
  
    drawBoat(width/2,boatY);

  
//night and day overlay color
    if(H >= 6 & H < 18) {
      fill(orangeSky);
    } else {
      fill(purpleSky);
    }
      rect(0,0,width,height);
}

function drawCloud(x,y,size = 100) {
    push();
    noStroke();
    //fill(230);
    ellipse(x, y, size, size);
    ellipse(x + size*.5, y + size*.05, size, size);
    ellipse(x + size, y, size, size*.8);
    ellipse(x + size*.3, y - size*.2, size*.8, size*.8);
    ellipse(x + size*.7, y - size*.35, size*.8, size*.8);
    pop();
}

function drawBoat(x=width/2,y=height/2) {
  fill("black");
  rect(x+30,y-220,
       12,220);
  fill("white");
  triangle(x+42,y-220,
           x+150,y-103,
           x+42,y-90);
  fill(boatColor);
  beginShape();
  vertex(x-20, y-80);
  vertex(x+220, y-80);
  vertex(x+170, y);
  vertex(x, y);
  endShape(CLOSE);
}

Ellan Suder Looking Outwards-06

random-art.org by Andrej Bauer generates individual images for user-inputted phrases. “The program accepts the name of a picture and uses it as a seed from which a picture is generated randomly. The same name always yields the same picture.”

It’s a fun, interactive artwork. The inclusion of the gallery where people can submit the images they’ve generated are really interesting because you can see all the different phrases people think of while they experiment with the generator. If you sort the gallery by popular, you can see the images voted ‘most interesting’ — one that I found most interesting was ‘sand dunes’, which by chance generated an image that looked like sand dunes.

I created a few myself:

Here is the artist’s explanation for how the code (Python) works:

The idea is to generate expression trees that describe an image. For each point `(x,y)` of the image we evaluate the expression and get a color. A color is represented as a triple `(r,g,b)` where the red, green, blue components are numbers between `-1` and `1`. In computer graphics it is more usual to use the range `[0,1]`, but since many operations are symmetric with respect to the origin it is more convenient to use the interval `[-1,1]`. I kept the program as simple as possible, and independent of any non-standard Python libraries.

If I changed anything about the project, I would like to see how each inputted word gets broken down and turned into an image.

Ellan Suder – Project – 05

I used the code I wrote for the hexagonal grid as a base for the wallpaper’s tiling pattern. I drew a custom shape in its own function (called ‘flame’) and made it repeat. The triangle/sparks are generated randomly.

flame wallpaper

/*
Ellan Suder
15104 1 D
esuder@andrew.cmu.edu
Project-05
*/

var magentaColor;
var greenColor;
//var blueColor;

function setup() {
    createCanvas(500, 500);
    magentaColor = color(238,116,217);
    greenColor = color(156, 255, 209);
    //blueColor = color(104,142,243);
}


function draw() {
    background(9,9,9);
    var tw = 100;
    var th = 100;
    var oy = 0;
    var ox = 0;
    for (var y = 0; y < 8; y++) {
        for (var x = 0; x < 8; x++) {
          if (y%2 === 0) {
            var px = ox + x * tw;
          } else if (y%2 !== 0 & x < 9) {
            var px = ox +tw/2 + x * tw;
          }
            var py = oy + y * th;
            
            fill(greenColor);
            flame(px,py,20); //outer flame
            fill(magentaColor); //inner flame
            flame(px,py+10,10);
            sparks(px,py,20);
        }
    }
  noLoop();
}
      
function flame(x,y,size) {
    stroke(magentaColor);
    strokeWeight(1.5);
    
    beginShape();
    vertex (x,y-4*size/3);     //1
      vertex (x+size/4,y-size);     //2
        vertex (x+size/3,y-size/3);     //3
      vertex (x+2*size/3,y-3*size/4);     //4
    vertex (x+size,y-size);     //5
      vertex (x+3*size/4,y+size/3);     //6
        vertex (x+size/2,y+3*size/4);     //7
          vertex (x,y+size);     //8
        vertex (x-size/2,y+3*size/4);     //9
      vertex (x-3*size/4,y+size/3);     //10
    vertex (x-size,y-size);     //11
      vertex (x-2*size/3,y-3*size/4);     //12
      vertex (x-size/3,y-size/3);     //13
        vertex (x-size/4,y-size);     //14
    endShape(CLOSE);     //back to 1  
}

function sparks(x,y,size) {
    a = size*random(-1,1);
    b = random(.9,1.1);
    triangle((x+a)*b,(y+a),
             (x+size/5+a)*b,(y+size/5+a),
             (x-size/5+a)*b,(y+size/5+a)*b);
    
    c = size*random(-1,1);
    d = random(.9,1.1);
    triangle((x+c)*d,(y+c)*d,
             (x+size/5+c)*d,(y+size/5+c),
             (x-size/5+c)*d,(y+size/5+c)*d);
  
    e = size*random(-1,1);
    f = random(.9,1.1);
    triangle((x+e)*f,(y+e)*f,
             (x+size/5+e)*f,(y+size/5+e)*f,
             (x-size/5+e)*f,(y+size/5+e)*f);
}

Ellan Suder Looking Outwards-05

I find the use of 3D computer graphics to make “deepfakes” interesting. The most recent big example I found was this video of a deepfaked Schwarzenegger impression on Conan. (2019)

The deepfake begins working at around 10 seconds in, which I wouldn’t have noticed without being told. Many people didn’t even notice the modifications.

The clip was edited by Tom [redacted], a graphic illustrator from the Czech Republic who created the video using free software to learn more about machine learning and artificial intelligence.

My first impression is that it’s really cool and impressive. People already like Facebook/Snapchat filters so much, and more advanced technology in this area will open up new possibilities for artworks. (For example, this Augmented Reality face filter that creates 3D face makeup). It reminds me of this commercial I saw that used CGI to “resurrect” Audrey Hepburn–my highschool teacher thought it was so interesting she showed our whole class. 

However, it is also troubling to consider how easily these videos can fool people. Like the creation of Photoshop meant that photographs would no longer be entirely trustworthy, this kind of software means that videos can no longer be taken at face value either. Lawmakers have been preparing to limit the spread of manipulated videos. Even Tom has commented on the potential malicious use of deepfakes, stating that “he’s sworn off creating political deepfakes or working for someone who wants them … It’s a good thing that not everyone can do it. People on the internet are animals, and they might use it for not very good stuff.”

Ellan Suder – Project 04 – String Art

I first started with drawing several parabolic curves in function draw(). Then after making a shape I liked, I moved it over into its own function like the owl example and used another two for loops to replicate it with different x,y values.

The original shape

string art

/*
Ellan Suder
15104 1 D
esuder@andrew.cmu.edu
Project-04
*/

//I first started with drawing several parabolic curves in function draw().
//Then after making a shape I liked, I moved it over into its own function 
//like the owl example and used another two for loops to replicate it with different x,y values.

var t = 0;

function setup() {
    createCanvas(400, 300);
    t = 0;
}

function draw() {
    background(0);
  
    //changes color based on mouseX, mouseY
    var r = map(mouseX, 0, width, 0, 230);
    var g = map(mouseY, 0, height, 0, 230);
    var b = 230 * noise(t+20);
    stroke(r,g,b);
    t = t + 0.05;
    
    //determines x and y of shapes. I made them overlap each other
    for (var y = -height/2; y < height*2; y += height/2){ 
        for (var x = -height/2; x < width*2; x += height/2) {
            shape(x, y);
        }
	}		
}

function shape(x,y) {
	var n = 20;
    var linespacing = height/(n*2);

    push();
    scale(.5);
    translate(x,y);

	for(var i = 0; i<n; i++)
  {
    strokeWeight(1);
    //stroke("red");
    line(0,0+linespacing*i, //x1, y1. begin at 0,0 and go down linespacing
         0+linespacing*i,height/2); //x2, y2. point goes right along height/2 linespacing each time

    //stroke("black");
    line(height,0+linespacing*i, //x1, y1. begin at height and go down
         height-linespacing*i,height/2); //x2, y2. begin at height,height/2 and go left

    //stroke("green");
    line(height/2,height/2+linespacing*i, //begin at height/2,height/2 and go down
         height-linespacing*i,height/2); //begin at height,height/2 and go left
 
    //stroke("purple");
    line(height/2,height/2+linespacing*i, //begin at height/2,height/2 and go down
         0+linespacing*i,height/2); //begin at 0,height/2 and go right

    //stroke("yellow");
    line(0,0+linespacing*i, //begin at 0,0 and go down
         height/2-linespacing*i,0); //begin at height/2,0 and go left

    //stroke("blue");
    line(height,0+linespacing*i, //begin at height,0 and go down
         height/2+linespacing*i,0); //begin at height/2,0 and go right

    //stroke("brown");
    line(height,height/2+linespacing*i, //begin at height,height/2 and go down
         height-linespacing*i,height); //begin at height,height and go left

    //stroke("orange");
    line(0,height/2+linespacing*i, //begin at 0,height/2 and go down
         0+linespacing*i,height); //begin at height/2 and go right
    }
    pop();
}

Ellan Suder Looking Outwards-04

Rhinoceros 3D / Grasshopper Pipes
Children interacting with the sculptures

The outdoor sound installation “Sonic Playground” (2018), created by Yuri Suzuki Design, features 6 colorful, trumpet-like sculptures that mod

The outdoor sound installation “Sonic Playground” (2018), created by Yuri Suzuki Design, features 6 colorful, trumpet-like sculptures that modify and transmit sound playfully. The software used to develop/optimize the installation was created by Luca Dellatorre in Grasshopper.

Though Grasshopper is a 3D geometrical software and not necessarily meant for sound, he was able to use Rhino 3D environment for acoustic applications because soundwaves can be simulated using ray tracing techniques. His software is meant to mimic the design techniques generally used in concert halls to “maximise the sound that reaches the audience and provide envelopment, strong lateral reflections, etc.” Using Rhino3D, Dellatorre evaluated different shapes for the mirrors and how the sound effect was changed — bells were especially effective in capturing and spreading sound.

I like the appearance of the sculptures. They’re very loopy and colorful, almost reminiscent of some Dr. Seuss illustrations. I think it could have been interesting if, instead of presenting the sculptures as 6 different objects, they designed them to overlap and possibly even intersect.

Ellan Suder Project-03: Dynamic Drawing

I first began with a really simple script that made the circle 50px wide on the right of the screen and 10px otherwise. Then I used the += to gradually add to the width, which made the circle have a more interesting transition as it crossed the x-axis.

dynamic drawing

/*
Ellan Suder
15104 1 D
esuder@andrew.cmu.edu
Project-03
*/

var angle;
var circleWidth;
var circleHeight;

function setup() {
    createCanvas(600, 400);
    var angle = 0;
}

function draw() {
    background(255, 90);
    fill(150);
    noStroke();
  
//if mouse crosses to right side, 
//circle adds value of mouseX to diameter
//gets bigger as it gets further from middle x axis
    if (mouseX > width/2) {
      circleWidth = 50 + (width/2 - mouseX);
    } else {
      circleWidth = 50 + (width/2 - mouseX);
  }
  
//if mouse goes to bottom half, 
//circle becomes black
    if (mouseY > height/2) {
      fill(0);
    } else {
      fill(200);
  }
  
//circle
    ellipse( 
      mouseX, 
      mouseY, 
      circleWidth,
      circleHeight);

// rectangle that changes angle according to mouseX
// rectangle moves further out as mouseY becomes bigger
    push();
    rotate(radians(angle));
    rect(5,mouseY, 50, 50);
    pop();
    angle = mouseX + 5;
}

Ellan Suder LookingOutwards-03

The Shenzen Bao’an International Airport, designed by Massimiliano Fuksas and Knippers Helbig (2013), is a large scale building designed with parametric fabrication.

I was actually in this airport before, but I didn’t know how it was designed until I looked up parametric design. According to this article, the building is meant to evoke the image of a manta ray, “a fish that breathes and changes its own shape, undergoes variations, turns into a bird to celebrate the emotion and fantasy of a flight.” It’s really incredible in person — the honeycomb-like windows and smooth silver curves look organic and futuristic. The sheer number of windows is lovely to look at.

I couldn’t find more information about the exact algorithms used to design the space, but the purpose of Helbig’s algorithm was to place the 60,000 panels onto a free form design. “Due to the free form design and varying dimensions of the façade panels a parametric development of the geometry was necessary.”