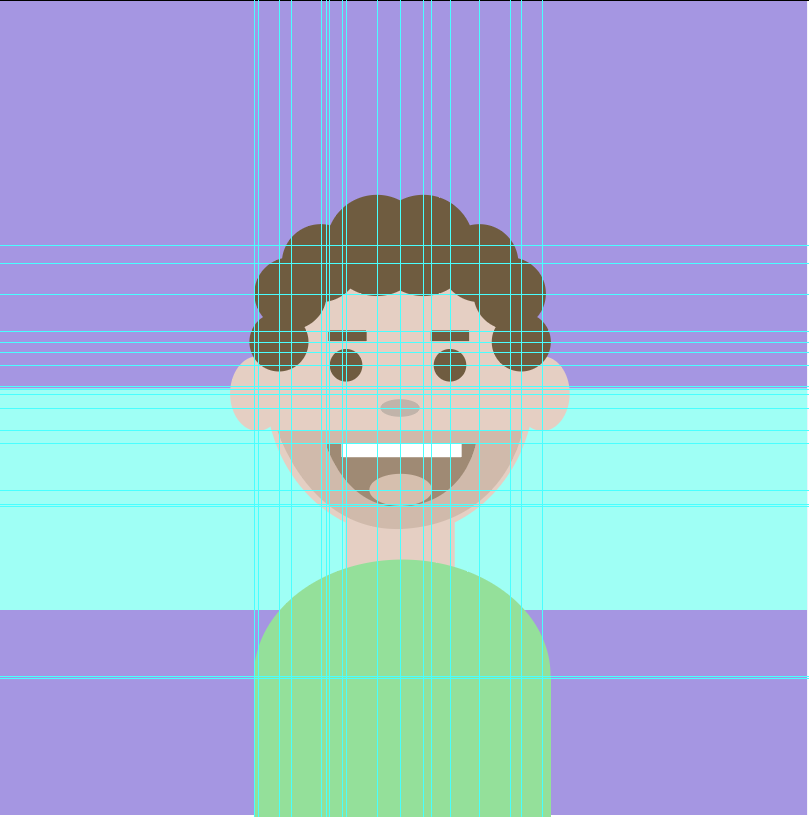
function setup() {
    createCanvas(600, 600);
    background('#A596E2');
    noStroke ();
    fill ('#9FFFF5');
    rect(0, 286, 600, 162.98);

    fill ('#E5CFC3');
    rect (259, 371, 80.231, 66.118);
    ellipse (300, 284.5, 198.281, 220.094);
    ellipse (300, 260, 192.479, 181.644);
    ellipse (195, 290, 40.059, 54.693);
    ellipse (404, 290, 40.059, 54.693);
    fill ('#6F5C40');
    ellipse (259, 269, 23.682, 23.682);
    ellipse (336, 269, 23.682, 23.682);
    ellipse (210, 252, 43.217, 43.217);
    ellipse (389, 252, 43.217, 43.217);
    ellipse (218, 216.5, 53.026, 53.026);
	ellipse (380, 216.5, 53.026, 53.026);
	ellipse (241, 194, 57.097, 57.097);
	ellipse (358, 194, 57.097, 57.097);
	ellipse (282, 181, 74.301, 74.301);
	ellipse (317, 181, 74.301, 74.301);
	rect (247, 244, 27.915, 7.562);
	rect (322, 244, 27.915, 7.562);
	fill ('#D0BAAB');
	arc(300, 317, 170.641, 145.641, 0, PI, CHORD);
	fill ('#a3917d');
	arc(300, 327, 105.331, 105.331, 0, PI, CHORD);
	fill ('#D6BFAE');
	ellipse (300, 366, 45.802, 23.332);
	fill ('white');
	rect (256, 327, 88.326, 9.965);
	fill ('#C1B4AA');
	ellipse (300, 301, 28.596, 12.596);
	fill ('#94E09A');
	ellipse (300, 498, 218.357, 170.905);
	rect (192, 500, 218.569, 132.986);
}

This was a super fun image to make. I used Illustrator to sketch the shapes I wanted to use and plot the coordinates so I could translate that into the code I wanted. The most difficult part was figuring out how to create and place arcs, but I eventually worked it out.
![[OLD FALL 2019] 15-104 • Introduction to Computing for Creative Practice](wp-content/uploads/2020/08/stop-banner.png)