![[OLD FALL 2019] 15-104 • Introduction to Computing for Creative Practice](wp-content/uploads/2020/08/stop-banner.png)
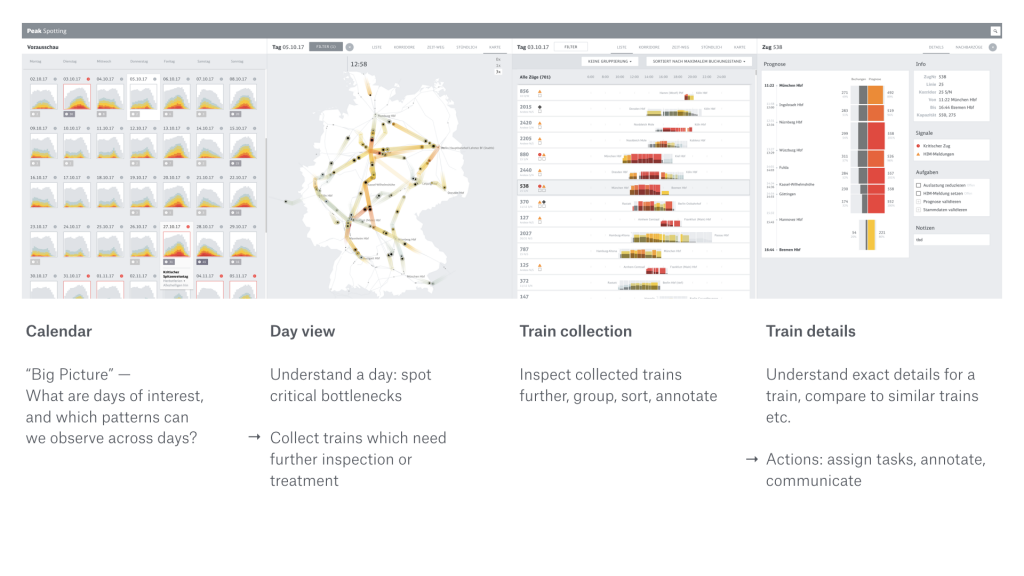
The project Peak Spotting was created by Studio NAND in collaboration with Moritz Stefaner, intended to provide visualization to passenger loads and identify potential bottlenecks early on. This web application collects millions of data-points over 100 days into the future, then these data-points are integrated into custom developed visual tools such as animated maps, stacked histograms, path-time-diagrams and lists with mini visualizations.
The application is split into 4 sections horizontally: Calendar, Day view, Train collection, and Train details. This application was designed with the team at Deutsche Bahn and the later users. According to Stefaner, prototyping with Tableau proved very useful to learn quickly if specific features would prove useful and in which form.
This project had my interest because of it’s various forms of data visualization. Through a combination of graphs and animations, the user is able to grasp data quickly and make judgement early on. The visualizations communicate information while also being aesthetically pleasing to the eye.