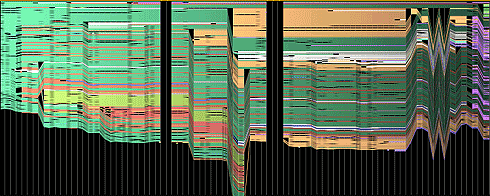
In collaboration with Fernanda Viegas, the set of visualizations titled History Flow are representations of the edit history of Wikipedia articles. With these visualizations, it is interesting to see how a pattern emerges. For example, with the abortion visualization above, the zig zag pattern on the right delineates an argument of differing opinions. The black columns that cut through the graph shows when the article was erased and instead substituted with something offensive, which Wattenberg states is not uncommon on controversial topics. I’m curious to see what the colors in each visualization represent, and if it was words that were plotted onto the graph or ideas.
![[OLD FALL 2019] 15-104 • Introduction to Computing for Creative Practice](wp-content/uploads/2020/08/stop-banner.png)