//Sammie Kim
//Section D
//sammiek@andrew.cmu.edu
//Project 07 - Curves
var nPoints = 360;

function setup() {
    createCanvas(480, 480);
}

function draw() {
    background(0);
    drawHypotrochoid();
    drawAstroid();
}

function drawHypotrochoid() {
    //constraining mouse within the canvas size
    var x = constrain(mouseX, 0, width);
    var y = constrain(mouseY, 0, height);
    //stroke color will also change based on the direction of mouse
    var rColor = map(mouseX, 0, width, 0, 230)
    var gColor = map(mouseY, 0, height, 0, 230)
    stroke(rColor, gColor, 200);
    strokeWeight(2);
    noFill();
    //Setting the parameters for the hypotrocoid
    push();
    translate(width/2, height/2); //starting the shape at the center of canvas
    var a = map(mouseX, 0, width, 0, 200); //the radius range of circle
    var b = map(mouseY, 0, height, 0, 50);
    var h = map(mouseX, 0, height, 0, 50);
    beginShape();
    //Hypotrochoid formula
    //http://mathworld.wolfram.com/Hypotrochoid.html
    for(var i = 0; i <= nPoints; i++) {
        var x = (a - b) * cos(i) + h * cos((a - b) / b * i);
        var y = (a - b) * sin(i) - h * sin((a - b) / b * i);
        vertex(x, y);
    }
    endShape();
    pop();
}

function drawAstroid(){
    var x = constrain(mouseX, 0, width);
    var y = constrain(mouseY, 0, height);
    push();
    noFill();
    strokeWeight(4);
    stroke("pink");
    translate(width / 2, height / 2);
    var a = map(mouseX, 0, width, 20, width / 3);
    beginShape();
    //Astroid formula
    //http://mathworld.wolfram.com/Astroid.html
    for (var i = 0; i < nPoints; i+= 0.5){
        var x = a * pow(cos(i), 3);
        var y = a * pow(sin(i), 3);
        vertex(x, y);
    }
    endShape();
    pop();
}
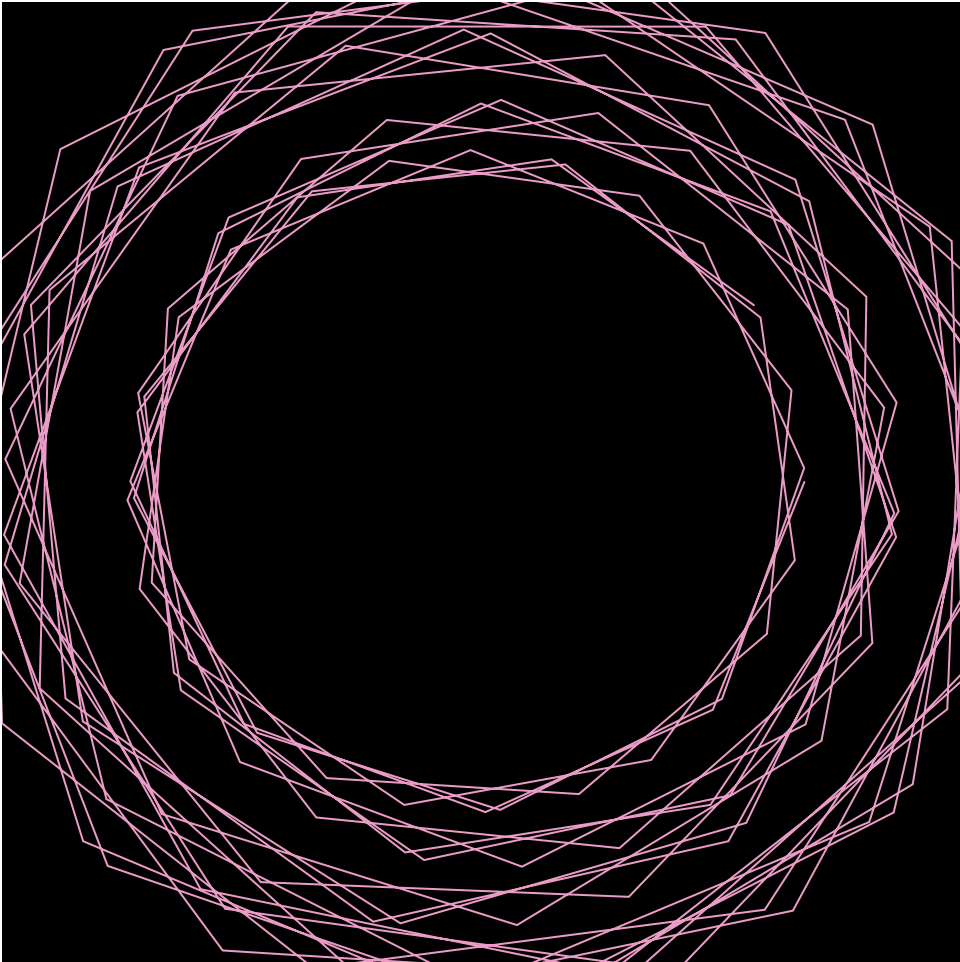
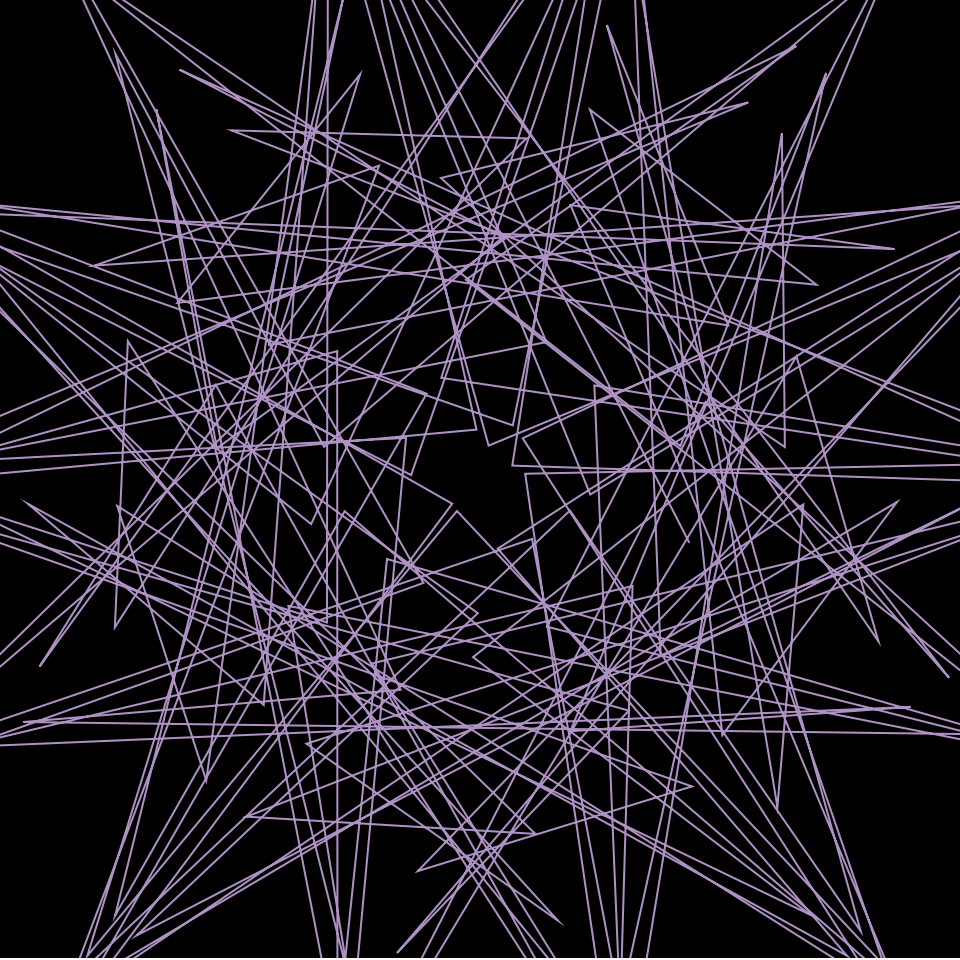
This project was challenging as I had to incorporate an interactive element within the hypotrochoid shape. It initially took a while to understand how I could flexibly use the map function, substituting different numbers to play with the range of mouse X and Y, then seeing the effects on screen. I also added a change to color as another element, where the R and G values would change depending on the mouse’s location. Afterwards, I created an astroid in the center that playfully interacts with the surrounding hypotrochoid. What intrigued me the most was how unexpected the shape would vastly change by rotating my mouse around the canvas, creating diverse shapes through intersection of lines.


![[OLD FALL 2019] 15-104 • Introduction to Computing for Creative Practice](wp-content/uploads/2020/08/stop-banner.png)