![[OLD FALL 2019] 15-104 • Introduction to Computing for Creative Practice](wp-content/uploads/2020/08/stop-banner.png)
//Gretchen Kupferschmid
//Section E
//gkupfers@andrew.cmu.edu
//Project-07-Curves

function setup() {
    createCanvas(480,480);
}
 function draw (){
    //gradient picking color
    var gradient1 = color(255, 238, 87);
    var gradient2 = color(247, 119, 179);
    createGradient(gradient1, gradient2);

    push();
    //moves all objects to center of canvas
    translate(width/2, height/2);
    //rotates shapes with movement of mouse X value from values 0 to pi
    rotate (map(mouseX, 0, width, 0, 10));
    circlePedal();
    deltoidCata();
    hypotrochoid();
    pop();
 }

function deltoidCata(){
    //mapping colors to mouse
    colorR = map(mouseX, 0, width, 200, 255);
    colorB = map(mouseY, 0, height, 200, 255);

    //mapping factor of deltoid to mouse
    g = map(mouseX, 0, width, 0, 100);
    g = map(mouseY, 0, height, 25, 50);

    //stroke & fill
    strokeWeight(5);
    fill(colorR, 250, colorB);
    stroke(0);


    // creating deltoid catacaustic
    beginShape();
    for (var i = 0; i < 200; i ++) {

        var angle = map(i, 0, 200, 0, 2*(TWO_PI));
        //formula for deltoid catacaustic
        x= ((2 *(cos(angle))) + (cos(2*angle)))*g ;
        y= ((2 *(sin(angle))) - (sin(2*angle)))*g ;
        vertex(x,y);
    }
    endShape();
}

function circlePedal(){
    //mapping colors to mouse X & Y
    colorR = map(mouseX, 0, width, 80, 200);
    colorG = map(mouseX, 0, width, 0, 50);
    colorB = map(mouseY, 0, height, 70, 170);

    //mapping factor multiplied by to mouse X & Y
    t = map(mouseX, 0, width, 150, 250);
    t = map(mouseY, 0, height, 130, 200);

    //stroke & fill
    strokeWeight(2);
    fill(colorR, colorG, colorB);
    stroke(255);

    //creating circle pedal
    for (var i = 0; i < 500; i ++) {

        var angle = map(i, 0, 500, 0, 2*(TWO_PI));
        //formula for circle pedal
        var x1 = cos(angle);
        var y1 = sin(angle);
        var x2 = t *((cos(angle)) -( y1 * cos(angle) * sin(angle)) + (x1 * pow(sin(angle),2)));
        var y2 = (.5* (y1 + (y1 * cos(2*angle))+ (2*sin(angle))- (x1 * sin(2*angle)))) * t;
        vertex(x2,y2);
    }
    endShape();

}

function hypotrochoid(){
    //mapping size of hypotrochoid to mouse
    a = map(mouseX, 0, width, 200, 350);
    b = map(mouseY, 0, height, 100, 200);
    h = map(mouseY, 0, height, 2, 105);

    //stroke & fill
    strokeWeight(2);
    noFill();
    stroke(255);

    // creating hypotrochoid
    beginShape();
    for (var i = 0; i < 500; i ++) {
        // hypotrochoid formula
        angle = map(i, 0, 500, 0, TWO_PI);
        var x = (a - b) * cos(angle) + h * cos((a - b) / b * i);
        var y = (a - b) * sin(angle) + h * sin((a - b) / b * i);
        vertex(x, y);
    }
    endShape();
}

//function gradient
function createGradient(top, bottom) {
    for(var i = 0; i <= height; i++) {
      var mapColor = map(i, 0, height, 0, 1);
      var interA = lerpColor(top, bottom, mapColor);
      stroke(interA);
      line(0, i, width, i);
    }
}
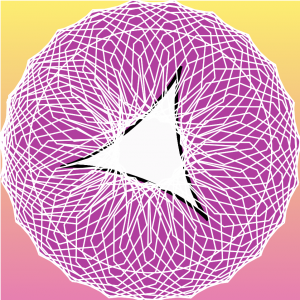
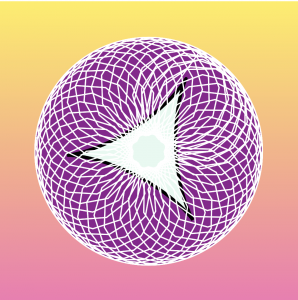
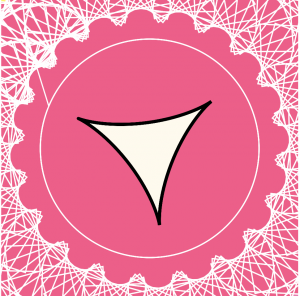
I started the project with just creating the deltoid curve and the circle pedal curve, but realized that just them two together weren’t creating a very interesting composition even though the formulas to create them were pretty complex. Even with altering numbers, mapping values, and angle amounts, I still wasn’t getting anything particularly interesting or complex looking. So, I decided to add a more circular and dynamic curve of the hypotrochoid, which can be altered by various radii values and its repeating structure.