![[OLD FALL 2019] 15-104 • Introduction to Computing for Creative Practice](wp-content/uploads/2020/08/stop-banner.png)

Drawing Water by David Wicks 
The first precedent project I found relevant to my final project was Drawing Water by David Wicks. The project is a data visualization overlaid on a map of the US that shows the relationship between where rain initially falls and where urban water is most consumed. The result is a series of curves with varying saturations and opacities to further represent the patterns and movement of water. To create the project, Wicks pulled Water consumption data from the USGS and rainfall data from the NOAA/NWS. This data was then input into a series of python scripts to create the final visualization.
Earth by Cameron Beccario
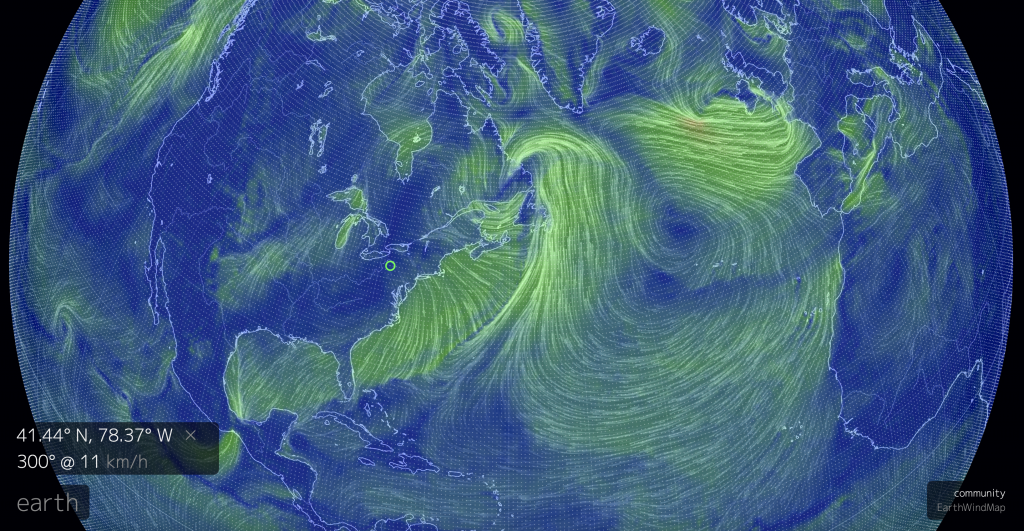
The second precedent project, Earth by Cameron Beccario, is a near realtime weather visualization on a global scale. Similarly to the previous project, Earth also generates dynamic linear paths that in this project represent wind patterns as well as changing colors to represent various other weather conditions. Earth also pulls weather data but from a wider array of sources and makes use of supercomputers to create and constantly update the visualization.