shariqs-a7-project
// Name: Shariq M. Shah
// Andrew ID: shariqs
// Section: C
// Project 07

//defining global variable for number of points

var nPoints = 500;


function setup() {
  createCanvas(400, 400);
}

function draw() {


  //stroke colors will be a function of mouseX location

  var r = map(mouseX, 0, width, 80, 250);
  var g = map(mouseY, 0, height, 80, 250);
  var b = map(mouseX, 0, width, 80, 250);


  //call drawEpitrochoidCurve function

  background(g, b * 2, r * 2);
  push();
  noFill();
  stroke(b, g, r);
  strokeWeight(0.5);
  translate(width/2, height/2);
  drawEpitrochoidCurve();
  rotate(radians(frameRate));
  pop();


  //call drawFermat function
  push();
  noFill();
  stroke(r, g, b);
  strokeWeight(0.5);
  translate(width/2, height/2);
  drawFermat();
  pop();

}


function drawEpitrochoidCurve() {

    // Epicycloid:
    // http://mathworld.wolfram.com/Epicycloid.html

    var x;
    var y;

    var a = map(mouseX, 0, width, 0, width/2);
    var b = a / 2;
    var h = height / 4;
    var ph = mouseX / 10;

    beginShape();
    for (var i = 0; i < nPoints; i++) {

        var t = map(i, 0, nPoints, 0, PI * 2);

       // defining curves as function of i

        x = (a + b) * cos(t) - h * cos(i * (a + b) / b);
        y = (a + b) * sin(t) - h * sin(i * (a + b) / b);


        vertex(x, y);


    }
    endShape(CLOSE);

}

function drawFermat() {

    var x;
    var y;

    var a = map(mouseX, 0, width, 0, width);
    var b = a / 2;
    var h = height / 2;
    var ph = mouseX / 10;


    beginShape();
    for (var i = 0; i < nPoints; i++) {

        //defining angle variable for function

        var angle = map(i, 0, nPoints, 0, TWO_PI);


        x = (a - b) * sin(angle) - b * sin(angle * (a - b));
        y = (a - b) * cos(angle) - b * cos(angle * (a - b));

        vertex(x, y);


    }
    endShape(CLOSE);

}
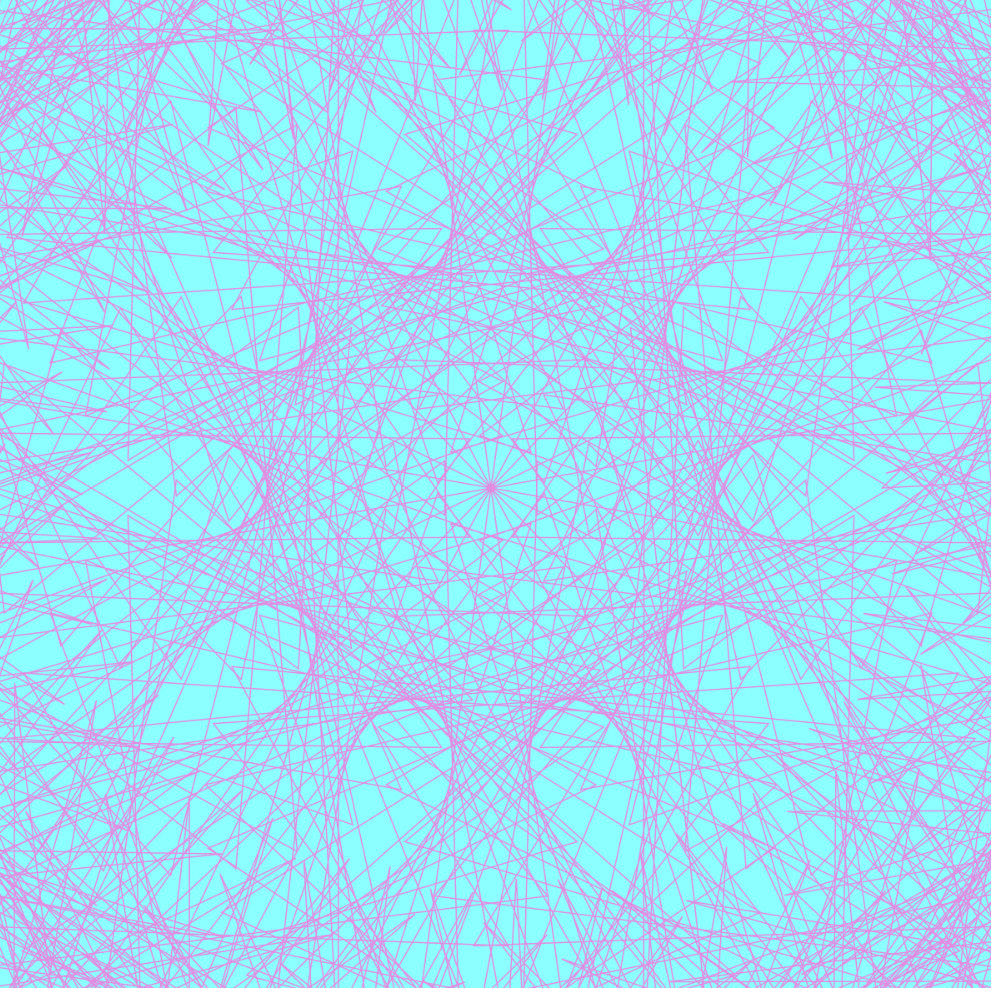
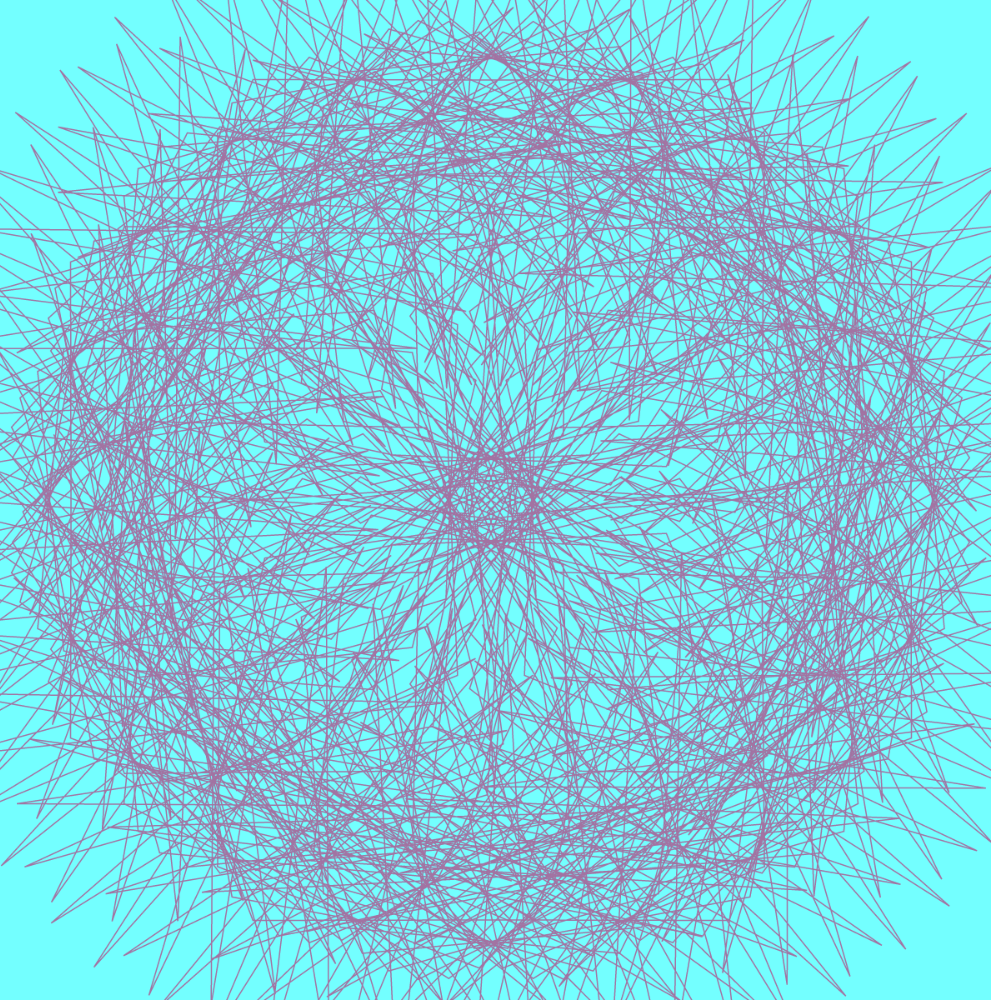
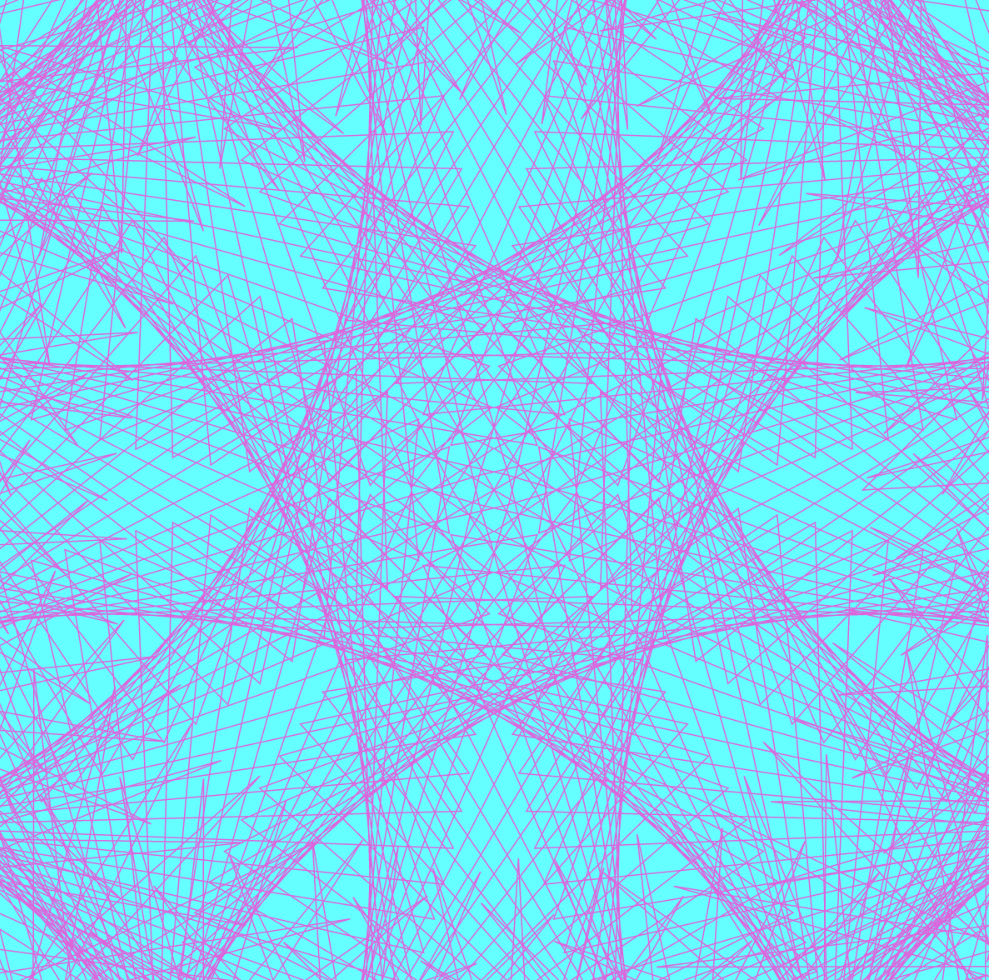
In this project, I was able to use curve equations to generate highly complex and articulated line patterns that change with the location of the mouse. By using mapped numbers and for loops that iterate upon the functions the line patterns become layered and produce interesting effects as the overall patterns change. From there, I was able to use variables to change the color of the lines as the mouse position changes, and subsequently the background to match the line colors as they adapt. By using variables for many of the inputs, the results become highly varied and complex.
![[OLD FALL 2019] 15-104 • Introduction to Computing for Creative Practice](../../wp-content/uploads/2020/08/stop-banner.png)