Looking Outward-08

https://ahprojects.com/

https://megapixels.cc/

https://vframe.io/

For this blog post I researched Adam Harvey.

Adam graduated from the Interactive Telecommunications Program at NYU in 2010. He also studied engineering and photojournalism at PSU. Currently, he is based in Berlin as a digital fellow at Weizenbaum Institut and a research fellow at Karlsruhe HfG. Adam’s work revolves around themes of privacy and surveillance technologies.

In Adam’s Eyeo talk, he walked us through two large projects: frame.io and megapixels.cc. In this talk, Adam broke down what facial recognition and facial detection mean and the deeply rooted flaws in these concepts. He repeatedly asked the question, “What is a face?” When breaking down this question, Adam said, “The face of today is not the face of tomorrow because the very word “face” is abstract, unstable, and inflationary.” There is no universal definition of what particular aspects define a “face” and because of this, facial detection technologies are vastly different and vastly inaccurate. Biometrics are not absolute yet technology is, so this creates a strong mismatch when it comes to these technologies.

Through walking us through megapixels, Adam shared different datasets of facial images that are being used by defense institutions for research. One dataset was of students at the University of Colorado Colorado Springs in which they specifically documented that they did not request permission nor inform students of their involvement in this project. Learning about these datasets made me increasingly more weary of my privacy than I already was.

A big part of Adam’s work is bringing transparency to the ways people are being surveilled and breaking down the technologies for how it’s done. This is something I strongly admire and appreciate. A presenting tactic that Adam used that I found quite successful was presenting all the facts in a strictly formal way and then letting the viewers come to their own conclusion about what it all meant. I think we all came to the same conclusion, but by doing this instead of him explaining what his conclusion was, the conclusion felt genuine and accurate. I also appreciated how he asked questions throughout the presentation. This forced me to stop and think and really be involved in what he was talking about.

I was interested in this lecture because of the rise in talk about facial recognition and spoofing these technologies related to the BLM protests that have been ongoing for the past several months. I had actually heard about Adam’s project CV Dazzle on twitter a few months ago to help protestors avoid being recognized and eventually going to jail. This project was about adding specific shapes and elements to your face to spoof the technology.

I’m curious to see how these technologies evolve and how we can increase people’s privacy. I understand the desire for technological advancement, but at what cost.

Looking outwards 08

Dan Shiffman is a professor at the ITP (interactive telecommunications program) at the New York University’s Tisch school of art. He is known for his youtube channel Coding Train where his focus is trying to make coding and scripting more accecible to people. He is also known to have co-created an open source graphics library called Processing, which is based on the JAVA language but aims to teach non-programmers the fundamentals of the world of programming. To me what is most admirable of Shiffman is his approachability and down to earthness. Programmers and computer scientists are stereotypically seen as these whizzes that are unapproachable residing in the ivory towers of whatever institution they are part of. But with shiffman, his ideals and actions break that stereotype and brings code to the people. Not only are his youtube tutorials funny and engaging, he isn’t afraid of making mistakes on camera. This is evident in the intro video of his youtube channel where he has a supercut of him saying “whoops” during his live and regular tutorials.

https://shiffman.net/

Looking Outwards: 08

Mike Tucker and his company, Magic Leap, are working on a unique variation of augmented reality: Spatial computing. Magic Leap One is a head-mounted virtual retinal display that superimposes digital imagery over real world objects through projecting digital “light fields” into the user’s eye. The device is stand-alone, and does not require an external computer / processing unit. The software can actively scan and create a digital representation of the surrounding environment to accurately superimpose 3D geometry over objects. Mike’s work often involves elevating spatial experiences, and creating new forms of interacting with spaces, something that I also explore as an architecture student.

Mike Tucker’s Eyeo festival presentation mainly focused on his installation work in San Francisco; The Microsoft Infinity Room. The room visualizes the data of a simple quarter, and how such a small, seemingly insignificant amount of currency can create effects that cascade into large changes that can affect the global economy. The experience is a 360-degree virtual tour that visualizes concepts and topics that aren’t easy to grasp.

Mike’s work does the talking for him. His presentations are clear and concise, condensing complex topics into digestible, relatable sentences. The accompanying behind-the-scenes visuals and images further convey the concepts he discusses.

LO-8: The Creative Practice of an Individual

The person I chose was Janelle Shane, an artificial intelligence researcher. She is based in Boulder, Colorado, and studied electrical engineering at Michigan State University for her undergraduate degree.
She is essentially a researcher who focuses her work on showing the shortcomings of machine learning and AI through humor.
I admire Shane because her projects are very lighthearted and creative. AI is something that can be very daunting to many because of how “human-like” it’s becoming so I love how she focuses on its struggles in a humorous way to show how it still has a long way to go to actually think like a human.
The work that piqued my interest was Neural Candy Hearts. I thought this project was very creative and funny since she uses AI to recreate the famous Valentine’s Day candy hearts.
Shane’s presentation style is just like the projects she works on. She talks very casually about her works and presents them highlighting the humorous aspects to engage her audience. Based on the way she presents her projects, I think that it is very important to basically let the projects themselves do the “talking.” In other words, I think it’s important to show what your project does rather than try to explain it bit by bit.

Janelle Shane at Eyeo 2018

LO-08 (the creative practice of an individual)

Taeyoon Choi is an artist, educator, and activist who works in New York and Seoul. He studied in the Art Institute of Chicago and Korea Advanced Institute of Science and technology and holds a BFA and MS respectively. He presents his work as an intersection between art and technology, physical technology as a platform for understanding life and the experience of it. He presents his technological work as a design and artistic process where he pursues creative moments when they’re provided to him. For instance, the project he started with was the creation of a computer from scratch. He educated himself in the language of computers and through practice and innovation eventually created his own version of what a computer could/should be. And further extending from that was experimentation of time and computing in which he created a machine that would capture the users own sense of time. After watching him present his work and process, I’ve gained a deeper appreciation for the contemporary integration of technology and artistic expression.

LookingOutwards-07

Designed by Frederic Vavrille, Musicovery is an interactive music service program that personalize music recommendations to various types of listeners by algorithms.

Listeners can start by choosing a mood or a radio as the initial metrics. Then the sound navigate the listeners to navigate between different artists.

Many music service engines are only based on collaborative filtering and user’s context, facing problem such as creating clones of playlist with very few artists, repetitively shuffling highly popular songs and cold start issues. To allow listeners to wander strategically out of their song/artist preferences, Musicovery optimize the system with more customized metrics to measure diversity. By concentrating less on the tops of the playlist, increasing higher variety and disparity, the service provides not only users based playlist but also context based playlist with more different navigations on genre. It also measures metrics including skips to analyze listeners’ level of engagement to each music. This increase the accuracy of the listeners’ preferences significantly.

Project-07-Curves

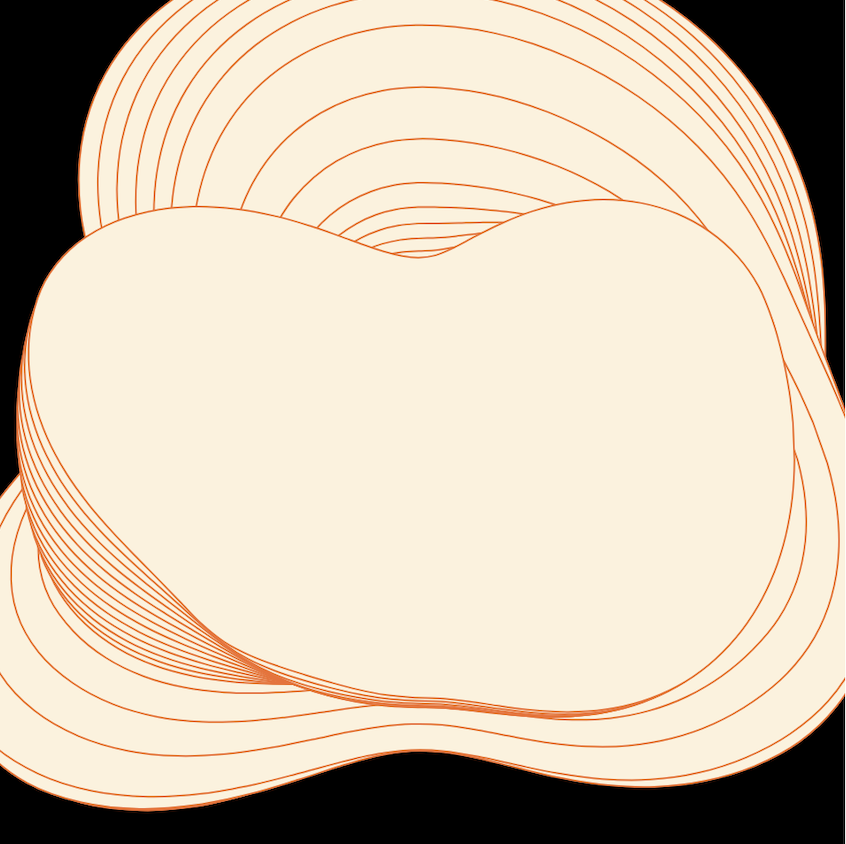
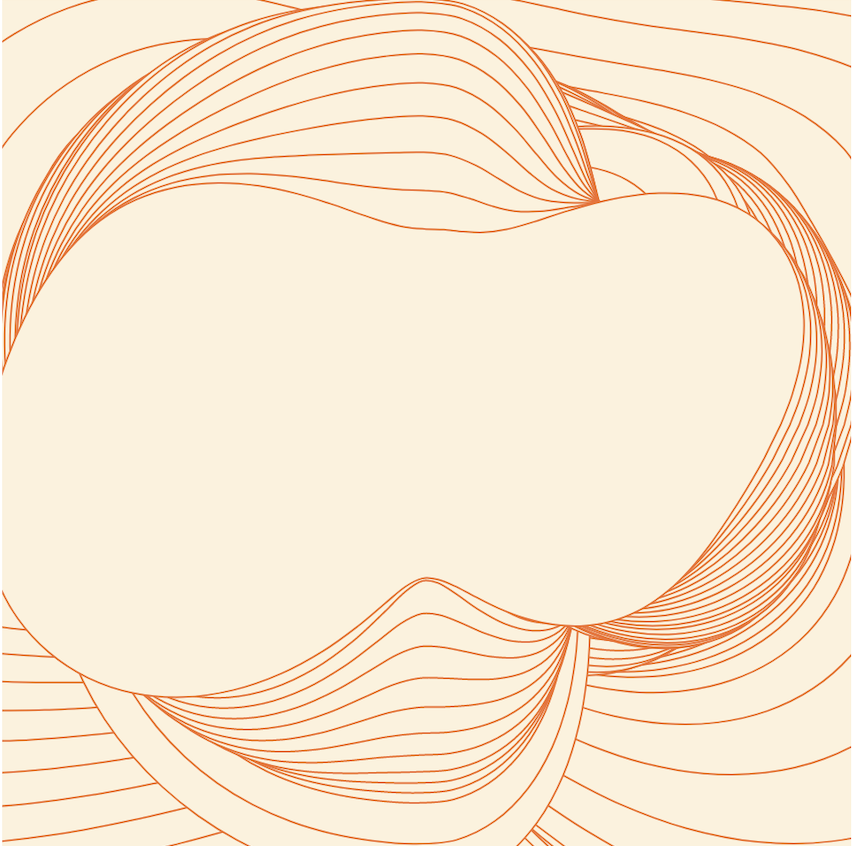
The project is based on the idea of using movement to capture the growing motion of a natural organism such as a sea creature or a human body part. Each of the new shape are overlap over the previous shape which show a processional motif on the canvas. I also add noise value into the function to allow the curves to offset and performing in a flowing state. 

sketchDownload
//Isabel Xu
//yuexu@andrew.cmu.edu
//Section A
//Project-07
var yoff = 0;
var max_radius = 100;
var angle_incr = 0.1;
var max_noise = 100;

function setup() {
    createCanvas(480, 480);
    background(0);
    frameRate(20);

}

function draw() {
	let max_radius = dist(mouseX,mouseY,width/2,height/2);
	let max_noise = max_radius;

	noiseDetail(1, 0.8);
	fill(253,242,220);
	translate(width/2, height/2);

	for (let radius = 0; radius < max_radius; radius += 1){
		beginShape();
		stroke(244,109,41);
		for (let a = 0; a < TWO_PI; a += angle_incr){
			//Use mouseX and mouseY to define offset value
			let xoff = cos(a) + 1;
			let offset = map(noise(xoff, sin(a) + 1 + yoff), 0 , 1,-max_noise, max_noise);
		
		
			let r = radius + (offset * map(radius,0,max_radius, 0.1, 1));
			let x = r * cos(a);
			let y = r * sin(a);


			curveVertex(x,y);
	}


	}
	endShape(CLOSE);

	yoff += 0.06

}

Project 7: Curves

For this project, I was really inspired by some of the curves and the fact that the hypocycloid resembled the outline of a flower! I wanted to create something that was a cross between something resembling Tyler the Creator’s ‘golf wang’ line and a bed of moving flowers in the wind.

I therefore came up with my final product, which has flowers with centers that move and rotate depending on the user’s mouse position:

sketchDownload
// Susie Kim
// susiek@andrew.cmu.edu
// Section A, 15-104
// Assignment 7

// set global variables
var angle = 0;

function setup() {
    createCanvas(480, 480);
    frameRate(15);
}

function draw() {
	background(247, 202, 201); // sets background to pink tone

    // create grid of flowers, starting at 40, 40. results in a 5x5 grid of flowers.
	for(var x = 40; x <= 480; x+= 100) {
		for(var y = 40; y <= 480; y+= 100) {
			push();
			translate(x, y);

			// have flowers rotate depending on mouse X pos
			rotate(radians(angle));
	        angle += mouseX;

	        // call upon flower functions to draw flower outer and center
	        drawHypocycloid();
	        drawAstroid();

	        pop();
		}
	}
}

// draw blue flower exterior
function drawHypocycloid() {
	// set local variables
	var a = int(map(mouseX, 0, width, 15, 40));
	var b = int(map(mouseY, 0, height, 8, 13));
	
	// set colors and strokes
	fill(145, 168, 209); 
	strokeWeight(2);
	stroke(255);

	beginShape();
   
	// draw hypocycloids, with size increasing for mouse X and number of petals increasing with mouseY 
	for (var i = 0; i < 250; i++) { 
		var subAngle = map(i, 0, 110, 0, TWO_PI);
		var x = a*((b - 1)*cos(subAngle) + cos(subAngle) + cos((b - 1)*subAngle)) / b;
		var y = a*((b - 1)*sin(subAngle) + sin(subAngle) + sin((b - 1)*subAngle)) / b;
		vertex(x,y);
	}
	endShape();
}

// draw yellow center of the flowers
function drawAstroid() {
    // set colors and strokes
	fill(255, 255, 0);
	strokeWeight(.1);
	stroke(255);

	beginShape();

	// draw for each astroid, with size increasing with mouse X position
	for (var i = 0; i < 300; i++) {
		var subAngle = map(mouseX, 0, width, 7, 15); // changes size with X pos
		var x2 = subAngle*pow(cos(i), 5);
		var y2 = subAngle*pow(sin(i), 5);
		vertex(x2, y2);
	}
	endShape();
}
my inspiration image!

Project 07: Curves

This project was a really fun experience with using different curves to simulate weather, along with arrays and shifting elements in the array. It was difficult to actually get the weather to move the way I wanted it to but I’m still unhappy with how some of the rain function works. It took a bit to get the curves working but from there it wasn’t too hard to get the grids working the way I wanted, although there were some pretty funny interactions with the direction and speed with which the curves moved and fell.

weather

var nPoints = 100
var curveX = []
var curveY = []
var numCurves;


function setup() {
    createCanvas(480, 480);
}


function draw() {
	numCurves = width
	for (y = 0; y < width; y += 40){ ////sends data to arrays to translate for curves
    for (x = 0; x < height; x += 40){
            curveY.push(y)
            curveX.push(x)
        }
    }
	background(0, 0, 255, 4)
	if (mouseIsPressed) { ///changes curve and color when mouse is held down
		rain()
	} else {
	    wind()
	}
}

function drawGrid() { ///establishes moving pattern of neiods for the rain() function
curveX.shift()
curveY.shift()
for(n = 0; n <= numCurves; n++){
	translate(curveX[n], curveY[n])
	drawNeoid()
}
}


function drawSecond() {  ///establishes moving pattern of curves for the wind() function
curveX.shift()
curveY.shift()
for(k = 0; k <= numCurves; k++){
	translate(curveX[k], curveY[k])
	drawLituus()
    }
}
function drawNeoid() { ///draws a neiod curve based on the mouse location
	var x
	var y
	var r
	var a = mouseX / 10
	var b = mouseY / 5
	beginShape()
	   for (var i = 0; i < nPoints; i++) {
            var t = map(i, 0, nPoints, 0, TWO_PI); ///converts to terms of pi
            r = (a * t) + b ////neiod formula
            x = r * cos(t)
            y = r * sin(t)
            vertex(x, y)
        }
    endShape()        
}

function drawLituus() { ///draws a lituus curve based on the mouse location, similar process to drawNeiod() with a different formula
    var x
	var y
	var r
	var a = (mouseX / 10) + (mouseY / 5)
	beginShape()
	   for (var i = 0; i < nPoints; i++) {
            var t = map(i, 0, nPoints, 0, TWO_PI);
            r = sqrt(sq(a) / t) ///lituus formula in terms of r
            x = r * cos(t)
            y = r * sin(t)
            vertex(x, y)
        }
    endShape()
}

function rain(){ ///draws a pattern of blue neiods like rain
	drawGrid()
	stroke(0, 0, 255)
	background(236, 236, 236, 4)
}

function wind(){ ////draws white lituuses like wind
	drawSecond()
	stroke(255, 255, 255)
	}

LO 07: Data Visualization

For this week’s LO, I researched the 24 hour movement of air traffic over Europe, called Europe 24, found on Visual Complexity. It is a beautiful array of data, set over a geographically accurate representation of Earth to better reflect where each plane is going. Europe 24 was made by NATS, the leading organization in air traffic control in the UK, which oversees all airports in the country, especially the busiest airport in Europe, in Heathrow. The visualization is particularly important for a company such as NATS as it provides a representation of how flights move over the space they work to keep safe and allows them to identify areas of high traffic which could prove to be dangerous. It is also artistically pleasing, with soft blues and a beautiful almost-photorealistic graphic of the globe below each line. The entirety of the animation is very clean and professional, as befitting such an important organization, and the overall cleanliness of the work makes it more accessible to the public so they might understand the work of NATS in the UK. Individual planes are show as points of light to enhance clarity as they move, and so they are not lost in the blue trails others leave behind, and cities are highlighted so they stand out as well.

The video of Europe 24 running, tracking flights over the continent for a day.