LO 8 – Eyeo Speaker

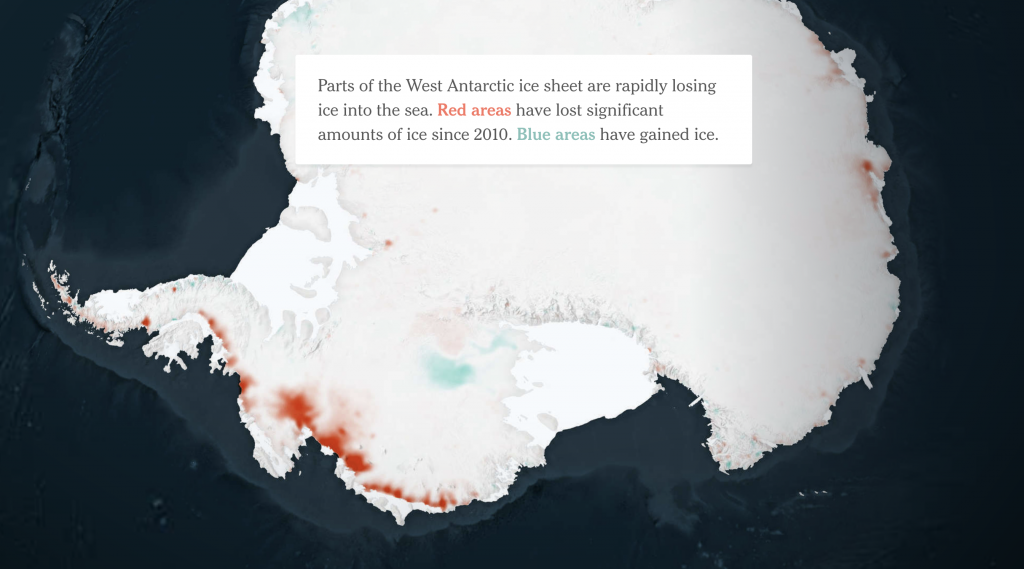
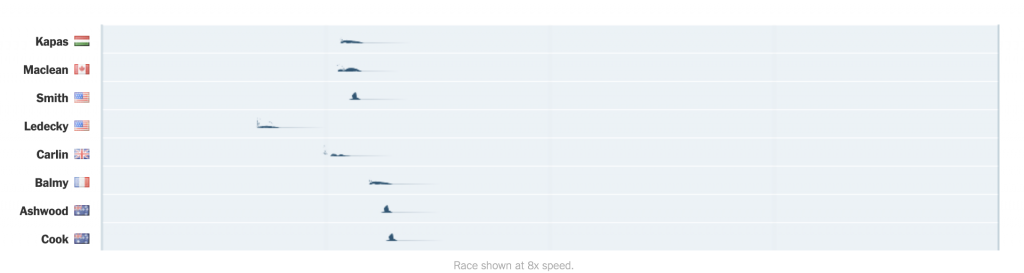
Derek Watkins is a Graphics Editor at the New York Times and is a designer, developer, reporter, and geographer. He studied Geography for both his Bachelors and Masters degrees and seems to have learned graphics programming on his own (I am not 100% certain about this, but I don’t see any explicit education in programming). Watkins presents himself as a journalist first, and a designer, cartographer, geographer, developer second. His main goal is to understand the considerations of the reader and to effectively present the story, so he finds himself with the initial job of storytelling and uses his skill set to do so. I enjoy Watkins’ work largely because of his use of low-level interaction and how when done well, can give the reader control of the article. The cognitive shift from reading a story to controlling a motion graphic can be a lot, and I appreciate the fine line between being too ambitious and just ambitious enough that Watkins is able to walk along to create an enjoyable and meaningful experience all at once. The projects that stand out to me the most are his animations for the 2016 Rio Olympics and his dispatch about the current climate science on the Antarctic ice sheet. These projects vary greatly when it comes to content and the amount of information being shared, but they both include simple ways in which the reader can interact with the article.

LO 08 – The Creative Practice of an Individual

Sarah Groff Hennigh-Palermo

Sarah Groff Hennigh- Palermo is an artist, programmer, and data designer who explores the relationship between technology and information by creating work focused on an “aesthetic exploration of experience” (Hennigh-Palermo) rather than an information-instrumental output of data. Her talk centered on undermining computers—how can make computers less “machine-like” and more accessible, visceral, and contextual? Her piece Oublié/trouvé, or: Towards a Theory of Invested Objects is an app and product that visualizes data based on your feelings and experiences (temperature, proximity from home, humidity, weather, etc) at a specific moment or location as an attempt to implement the personal into the machine. She then developed LiveCode, a communal computing experience of visuals, music, dance, and games with code written and evaluated in real time. She is also a part of an algorithmic band called Codie, which codes live music and visuals at each performance, which I thought was pretty cool. 

A workshop of live coding visuals.

LO 08

Stephanie Dinkins

Stephanie Dinkins is an interdisciplinary artist whose work focuses on the intersection of artificial intelligence and race, gender, and age, and how technology shapes history. She teaches at Stony Brook University, and was named an “AI Influencer” in the New York Times. Her work consists primarily of interactive installations that use AI algorithms to communicate issues of social justice and her own familial experiences while trying to make AI technology more accessible to underfunded communities. Specifically, her project “Not the Only One” centers around her multigenerational family history, helping to tell the story of her ancestors as a unique, deep-learning entity. I admire the way in which her work humanizes the world of AI, demonstrating how it can intersect with deeply personal topics. She also emphasizes the importance of using programming in a way that brings in audiences who might not otherwise be immersed in or have access to this technological setting, as well as people who might not recognize how it can relate to themselves.

Dinkins’ Eyeo 2019 Lecture

LO-7-

http://feltron.com/BikeCycle.html
I found Nicholas Felton’s data representation very intriguing. The BikeCycle project gathers cyclists’ data over a year and represents them on screens in MoMa to show patterns of people’s commute and journey. The data is represented through various diagrams and breakdown of information in order to visualize it for easier digestion. The visualization of the bike patterns are lively and constantly changing. I feel that this is a very interesting way to portray Manhattan, a city that never sleeps. The constant buzz of the city is well represented by the ever changing patterns and movement in the visualization of cyclists and bikes.

Project-07-Curves

sketch
var x ;
var y ;

function setup() {
    createCanvas(480, 480);
    strokeWeight(0.7);
    frameRate(5);

}

function draw() {
    background(10, 20, 60);
    translate(89,89);
    for (var j = 1; j <=2 ; j++ ){ //setting up 2x2 grid for circles 
        for (var k = 1; k <=2 ; k++){
            push();
            translate (j*100,k*100); //moving the grid to the center
            drawpattern();
            pop();
        }
    }

}

function drawpattern() {
    var a = map(mouseX, 0, height, 10, 80); //establishing variables that lead the cruves to vary
    var b = map(mouseX, 0, width, 10, 20);
    var h = map(mouseX, 0, width, 0, 100);

    noFill();
    stroke(mouseY, mouseX, 200);
    beginShape(); //drawing geometry
    for (var n=0; n <=800; n++) {
        var Deg = map(n, 0, 100, 0, TWO_PI); 
        x = (a-b)*cos(Deg) + h*cos(((a-b)/b)*Deg);
        y = (a-b)*sin(Deg) - h*sin(((a-b)/b)*Deg);
        vertex(x, y);
    }
    endShape();


}

I wanted to give this piece as much variation in structural form as I could.

Looking Outward 08 – The Creative Practice of an Individual

Mike Tucker is a creative lead at Magic Leap, a company that makes an AR headset designed to be comfortable and maneuverable to use. Since the 1990s up to 2018 when he gave a talk at the Eyeo Festival, he transitioned across different mediums to produce work, starting 2D based mediums such as Hypercard and Adobe Flash, moving onto dynamic mediums such as interactive spatial exhibits and finally into VR development.

Mike discussed some main principles he learned from helping create Tonandi at Magic Leap – an interactive project featuring the music of the band Sigur Ros. He mentioned how head tracking, 6 Degrees of Freedom, Spatial Sound, Touch/Hand controls, Eye tracking, and Environmental Design were key, showing how each principle influenced the final version. Tonandi combined audio and visual elements to create an AR space with translucent, abstract, nature-inspired shapes that moved along to the music and changed the user’s perception of sound and their surroundings.

Having a slight interest in VR, I went into his talk mostly expecting him to talk about his work and the company in a very surface level overview without much of the guiding process. However, I came out of it amazed at how sound could be integrated into a spatial experience and immerse a user further than just visuals could, as well as how he demonstrated that spatial computing was ripe with versatility to overtake the future, including applications for impaired users and the possibility to develop experiences entirely through AR and VR.

LookingOutwards-08

Ariel Waldmen works on NASA’s Innovative Advanced Concepts program and explores the relationship between scientific exploration and creative expression. Although she has a concentration on space exploration specifically, she also works in other science fields to promote collaboration in science. I admire how her work not only shows a lifelong fascination of space exploration, but also a longer journey into how she can share that fascination with others. I think my favorite project of hers is spaceprobe.es, which displays the satellites, rovers, and probes currently in space to share the active projects of space exploration. To present effectively, she uses real world examples to lead viewers through more familiar stories to the lesser told ones.

arielwaldman.com/projects

LO8: The Creative Practice of An Individual

Nadieh Bremer’s Presentation at the Eyeo 2019

A speaker at the Eyeo Festival that I found very inspiring is Nadieh Bremer. Bremer graduated with a degree in Astronomy from the University of Leiden in 2011. During her time there, she was introduced to the programming language IDL often used in Astronomy to analyze data. From her introduction to IDL, she realized that she wanted to be a data scientist; however, she wanted to analyze more tangible data rather than being in a niche field like astronomy, so she joined Deloitte. During her time there, she learned 6 different languages including R where she started doing simple data visualizations. In 2013, she joined a data science conference Strata where she was introduced to coding in d3 and found her love in data visualization design.

I admire her work greatly as they are able to present complexities and interconnections into beautiful and tangle visuals. One of my favorite work from Bremer is a data visualization she collaborated with UNESCO to show the interconnectedness between different cultures across the world. The map displays intangible cultural heritage–ranging from skills to practice to knowledge totaling about 500 cultural elements. Cultural elements are hard to quantify, yet Bremer was able to come up with an impressive map with statistics and interactive visual elements. The thoughtfulness that went into her work blew my mind. Her work also portrays a harmonious combination of mathematics and the arts, which makes it very intriguing and inspiring.

Link: https://www.visualcinnamon.com/portfolio/

LO 08 – The Creative Practice of an Individual

YOUR OWN MULTIVERSE

Meow Wolf


I watched the Vimeo video about Meow Wolf, where they talk about reasons why they succeeded, and the early history of Meow Wolf as an art collective. Meow Wolf is an arts and entertainment group based in Santa Fe, New Mexico. They established in 2008 as an art collective with a special emphasis on the DIY technological aspects of immersive art. I admire this group because of their work (obviously) but also their mission statement. They believe in accomplishing artists being compensated on an equal level with other skilled, in-demand professionals (a societal issue that is very prominent today) and that successful businesses must give back and participate in their communities. As an art collective, not only do they create mesmerizing user experiences, but also provide financial assistance, expertise, and other forms of active support. Meow Wolf captivates the audience by introducing their mission through anecdote and humor adding levity to the expo. 

Eyeo 2019 – Meow Wolf

View Portfolio here 

LO-07

The projects I looked at were from Stamen Studios, they are a studio that creates many types of interactive informational visualizations, especially maps. They help companies/ organizations/individuals to customize their information and present them in the most insightful and legible way possible. One of their projects that I looked at was an interactive map that explores the impact of global warming on North American birds. The map allows you to control what scenario and what season you want to view and uses colors on the map and the species to inform us how much the species is in danger because of global warming. I thought the map delivers information very well and is also really easy to navigate. 

http://stamenprod.wpengine.com/work/audubon-survival-by-degrees/

Link to the map:

https://www.audubon.org/climate/survivalbydegrees/