var h = 10
var angle = 0
var color = 0
var clouda = -100
var cloudb = clouda + 100

function setup() {
    createCanvas(450, 600);
    background(220);
    text("p5.js vers 0.9.0 test.", 10, 15);
}

function draw() {
	if (color == 0) {
		background(255, 128, 188);
	} else {
		background(0, 154, 255);
	}
	if (mouseIsPressed) {
        fill(255);
        ellipse(clouda, 100, 150, 75);
        ellipse(cloudb, 250, 110, 90);
        clouda = clouda + 2
        cloudb = cloudb + 2
        if (clouda >= 450) {
            clouda = -100
            cloudb = clouda + 100
        }
	}
	strokeWeight(h);
	stroke(0, 255, 0);
	line(225, 600, 225, max(mouseY, 200)); //stem gets taller as mouseY gets lower
	if (mouseY < 500) {
		fill(0, 255, 0);
		ellipseMode(CORNER);
		ellipse(225, max(mouseY, 300), min(600 - mouseY, 200), constrain(600 - 2*mouseY, 50, 100));
		//leaf grows as the stem grows
	}
	fill(255, 0, 119);
	noStroke();
	if (mouseY >= 200) {
		ellipseMode(CENTER);
	    ellipse(225, max(mouseY, 200), max(min(600 - mouseY, 200), 0));
	    //flower bud grows as mouseY gets lower
	} else {
		push();
		translate(225, 200);
		rotate(radians(angle));
		fill(255, 0, 119);
		beginShape();
		curveVertex(0, 0);
		curveVertex(0, 0);
		curveVertex(-100, -30);
		curveVertex(-30, -100);
		curveVertex(0, 0);
		curveVertex(0, 0);
		endShape();
		beginShape();
		curveVertex(0, 0);
		curveVertex(0, 0);
		curveVertex(30, -100);
		curveVertex(100, -30);
		curveVertex(0, 0);
		curveVertex(0, 0);
		endShape();
		beginShape();
		curveVertex(0, 0);
		curveVertex(0, 0);
		curveVertex(100, 30);
		curveVertex(30, 100);
		curveVertex(0, 0);
		curveVertex(0, 0);
		endShape();
		beginShape();
		curveVertex(0, 0);
		curveVertex(0, 0);
		curveVertex(-30, 100);
		curveVertex(-100, 30);
		curveVertex(0, 0);
		curveVertex(0, 0);
		endShape();
		pop();
        angle = angle + 5
        //spinning flower petals are pretty!
	}
}

function mousePressed(){
    if (dist(mouseX, mouseY, 225, 200) <= 100) {
    	color = 1
    } else {
    	color = 0
    }
}Category: SectionD
Project 3: Dynamic Drawing
For project, I experimented with using simple geometric shapes and symmetry to created a balanced and orderly movement. I also played with the different types of color contrasts such as simultaneous contrast and complementary contrast.
/*
Bon Bhakdibhumi
bbhakdib
Section d
*/
var r = 37;
var g = 51;
var b = 70;
var rTriangle = 225;
var gTriangle = 210;
var bTriangle = 232;
var rCircle = 171;
var gCircle = 237;
var bCircle = 255;
var rRect = 101;
var gRect = 249;
var bRect = 183;
var rmidRect = 253;
var gmidRect = 173;
var bmidRect = 113;
var rOutertri = 255;
var gOutertri = 255;
var bOutertri = 255;
function setup() {
    createCanvas(450, 600);
    text("p5.js vers 0.9.0 test.", 10, 15);
}

function draw() {
    background(r, g, b);
  if (mouseX > width/2) {
     r = 211;
     g = 185;
     b = 159;
  }else {
    r = 37;
    g = 51;
    b = 70;
  }
    translate(width/2, height/2);
    rectMode(CENTER);
  // inner triangles rotate to the left with mouseX increases
  fill( rTriangle, gTriangle, bTriangle);
  if (mouseX > width/2) {
     rTriangle = 129;
     gTriangle = 13;
     bTriangle = 98;
  }else {
    rTriangle = 225;
    gTriangle = 210;
    bTriangle = 232;
  }
  noStroke();
    for (var i = 0; i < 6; i += 1) {
        push();
        scale(mouseY / 500);
        rotate((-mouseX / 400) + radians(360 * i / 6));
        triangle(50, 0, 25, 25, 75, 25);
        pop();
    }
  // mid squares expand when rotating to the left
  var m = max(min(mouseX, 400), 0);
  var sSize = -m * 40 / 400 + 60;
   fill( rRect, gRect, bRect, 230);
  if (mouseX > width/2) {
    rRect = 49
    gRect = 84
    bRect = 55
  }else {
     rRect = 101;
     gRect = 249;
     bRect = 183;
  }
  noStroke();
    for (var s = 0; s < 8; s += 1) {
      push();
      scale(mouseY / 400);
      rotate( mouseX/350 + radians(360 * s / 8));
      rect (130, 0, sSize, sSize);
      pop();
    }
  // outer circles expand when rotating to the right
  var m = max(min(mouseX, 400), 0);
  var size = m * 50 / 400 + 30;
  noStroke();
  fill(rCircle, gCircle, bCircle, 230);
  if (mouseX > width/2) {
    rCircle = 109;
    gCircle = 152;
    bCircle = 186;
  }else {
    rCircle = 171;
    gCircle = 237;
    bCircle = 255;
  }
  for (var c = 0; c < 10; c += 1) {
    push();
    scale(mouseY / 400);
    rotate((-mouseX / 300) + radians(360 * c / 10));
    ellipse(200, 0, size, size);
    pop();
  }
  // outermost triangles rotate to the right with mouseX increases
  fill( rOutertri, gOutertri, bOutertri);
  if (mouseX > width/2) {
     rOutertri = 199;
     gOutertri = 82;
     bOutertri = 156;
  }else {
    rOutertri = 225;
    gOutertri = 225;
    bOutertri = 225;
  }
  noStroke();
    for (var i = 0; i < 10; i += 1) {
        push();
        scale(mouseY / 350);
        rotate((mouseX / 250) + radians(360 * i / 10));
        triangle(275, 0, 225, 50, 325, 50);
        pop();
    }
 // middle square rotates to the right when mouseX increase
  var m = max(min(mouseX, 400), 0);
  var squareSize = -m * 50 / 400 + 10;
  scale(mouseY / 600);
  rotate(radians(mouseX / 5));
  fill(rmidRect, gmidRect, bmidRect);
  if (mouseX > width/2) {
    rmidRect = 107;
    gmidRect = 94;
    bmidRect = 98;
  }else {
    rmidRect = 253;
    gmidRect = 173;
    bmidRect = 113;
  }
  noStroke();
    rect(0, 0, squareSize, squareSize);

 }
LO 3 – Computational Fabrication
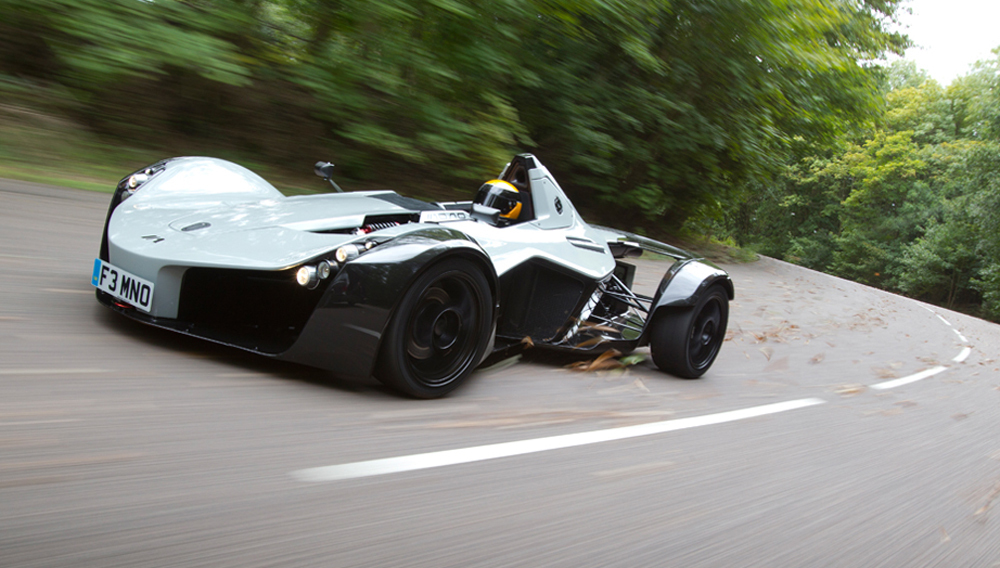
The BAC Mono is a British-built, street legal racecar designed to deliver the most pure driving experience possible. The Mono’s secret to fun lies in its weight: at only 1250 pounds, the car behaves like a scalpel, being able to turn precisely and quickly due to having little inertia.
For its 2020 refresh, BAC had to come up with creative methods to shave mass of this already featherweight machine. Partnering with Autodesk, the engineers at BAC used Fusion 360 to generate a lighter wheel. Compared to the outgoing design, this wheel saved 2.6 pounds. While this may not seem like much on paper, removing unsprung weight from the spinning wheels of a car translates tenfold towards performance. In other words, the new design actually saves about 26 pounds per wheel when the car is in motion!
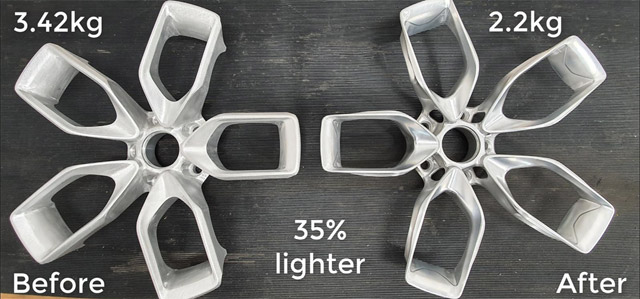
To me, the majority of generative design is very obvious – the algorithms used to generate these designs have a distinct, hollowed out, weblike aesthetic. Although this is pleasing in some applications, they may not look ideal in others. In the case of the BAC Mono, maintaining the general 5 spoke design of the outgoing wheel was a priority. The end result speaks for itself – a wheel that looks virtually unchanged on the surface but is much improved underneath.
Project 03 – Dynamic Drawing
/*
 * Eric Zhao
 * ezhao2@andrew.cmu.edu
 *
 * Dynamic Drawing: This program creates an array of squares
 * and circles on the canvas. The circles light up and grow
 * in size the closer the mouse is to them, while the squares
 * rotate based on the mouse's position relative to the center
 * of the canvas. Number of circles and squares per row can be
 * changed and the program is scalable with canvas sizes.
 */


var circleDia = 0;
var mouseDist = 0;
var cursorX = 0;
var cursorY = 0;
var distanceMult = 0; //circle diameter multiplier
var circleCount = 15; //circle and square count
var tanRotation = 0; //square rotation state
function setup() {
    createCanvas(400, 400);
    background(220);
    text("p5.js vers 0.9.0 test.", 10, 15);
    colorMode(HSB, 360, 100, 100, 100)
    rectMode(CENTER);
}

function draw() {
    push();
    noStroke();
    circleDia = width/circleCount;
    cursorX = constrain(mouseX, 0, width);
    cursorY = constrain(mouseY, 0, height);
    //constrains mouseX and mouseY to canvas size
    background(0);
    //the following are two for loops that draw a grid of circles with
    //[circleCount] number of circles in each row and column
    for(let y = circleDia/2; y <= 1 + height-circleDia/2; y+= circleDia){
        for(let x = circleDia/2; x <= 1 + width-circleDia/2; x+= circleDia){
            mouseDist = constrain(dist(x, y, cursorX, cursorY), 1, width);
            distanceMult = mouseDist/circleCount;
            //used later to modify circle size based on mouse position
            tanRotation = atan2(cursorY - height/2, cursorX - width/2);
            //stores rotation of mouse before pushing rectangle
            push();
            translate(x, y);
            rotate(tanRotation);
            fill(15,25);
            rect(0, 0, 50, 50);
            pop();
            //draws rotated rectangles in same positions as the circle grid
            if(dist(x, y, width/2, height/2) < height/2){
            //constrains array of circles within a larger circular area
                fill(180+degrees(atan2(cursorY - height/2, cursorX - width/2)),
                65, 512/distanceMult);
                /*adjusts HSB values based on proximity of mouse to circle and
                coordinates of mouse relative to center of canvas*/
                circle(x, y, circleDia-distanceMult);
            }
        }
    }
    pop();
}
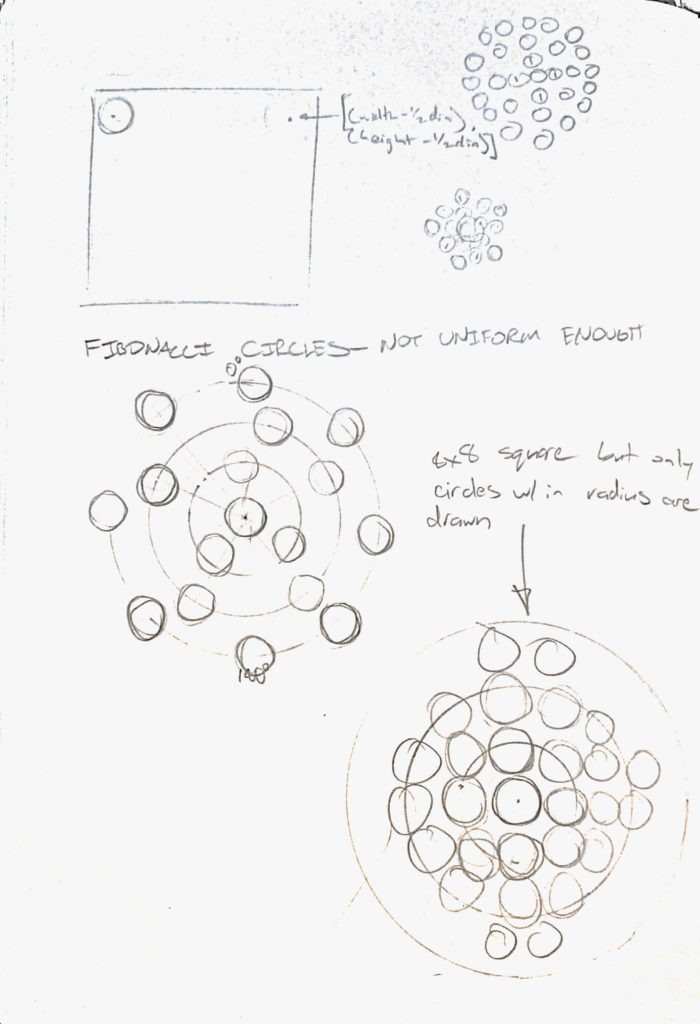
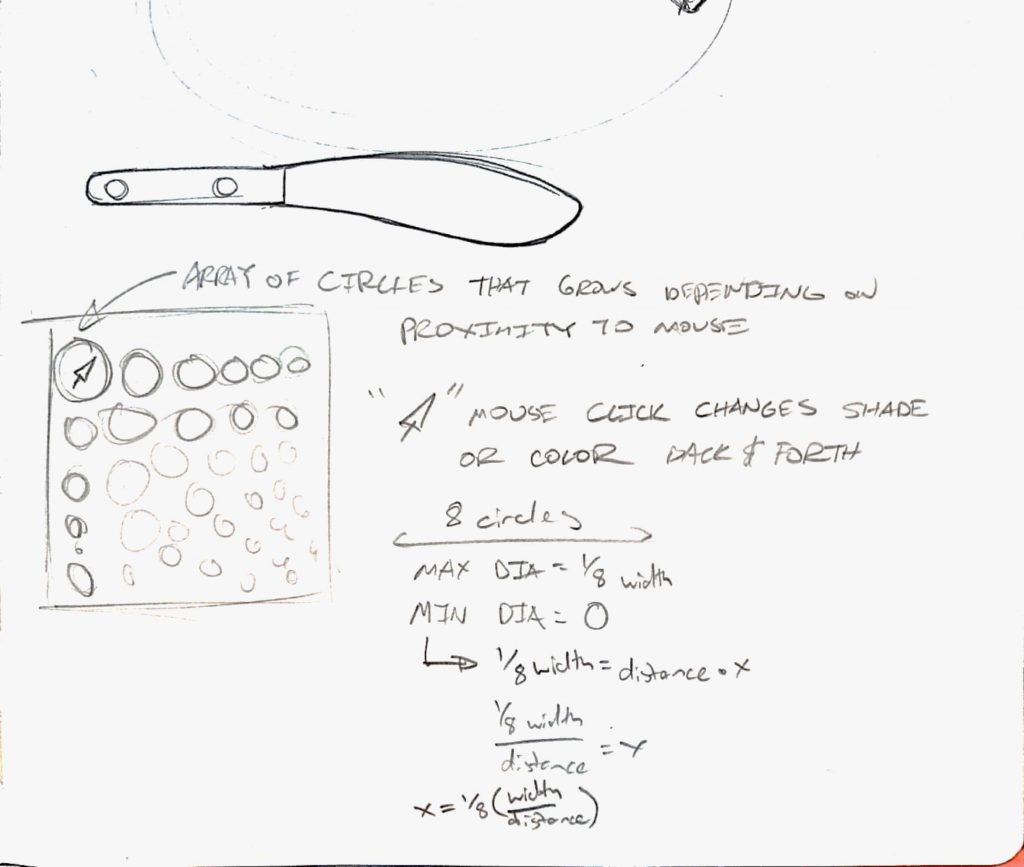
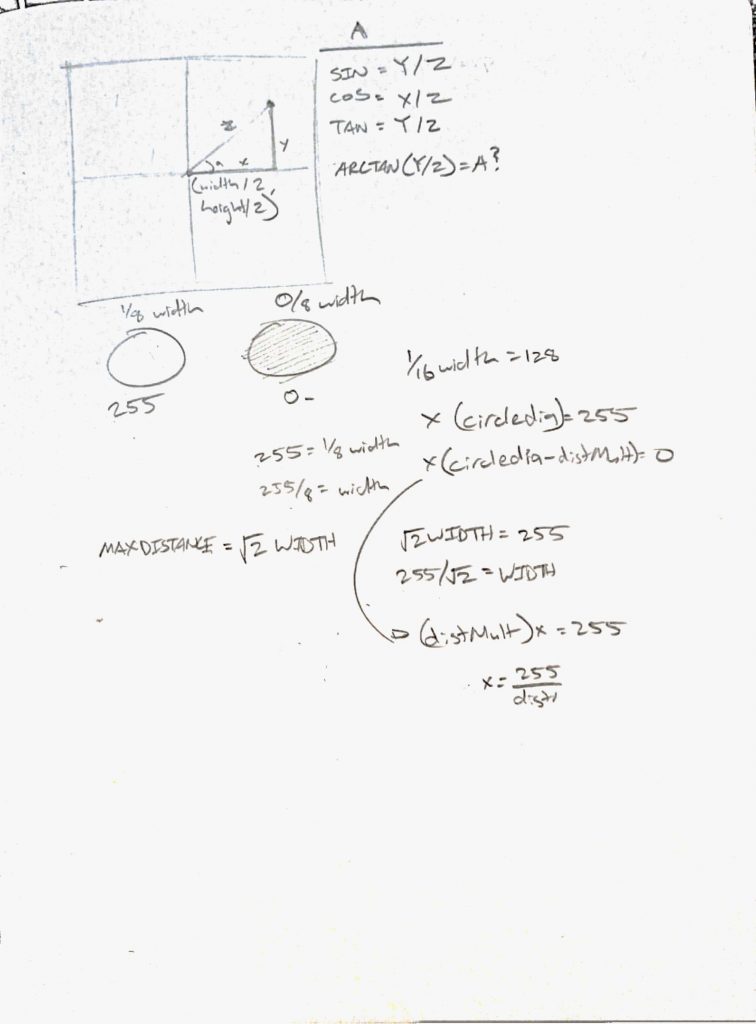
This project started with the idea of having an array of circles that grew and shrank based on how close they were to the mouse. After I made that basic program work, I started experimenting with having the mouse position change the colors of the array and using other shapes as a filter on top of the circles.
Project 3 – Dynamic Drawing
// Yoo Jin Kim
// 15104 - section D
// yoojink1@andrew.cmu.edu
// Project-03

var wavy = 10;
var toggle = 0;
var bird = 255;

function setup() {
    createCanvas(450, 600);
}

function draw() {
	//background - color changes from light blue to light purple as y-axis changes
	background(212 + mouseY / 50, 235 - mouseY / 53, 242 - mouseY / 49);

	//sun - size changes as y-axis changes
	stroke(255);
	fill('#FFB7B2');
	ellipse(225, 418, min((mouseY), 260));

	//waves - position shift as y-axis changes
	fill(255);
    var points = 5;
    var wav = wavy + mouseX / (width * 20);
    var step = mouseY / height * 100;

    beginShape();
    vertex(0, height);
    vertex(0, height / 1.5  + step);
    curveVertex(0, height / 1.5  + step);
    curveVertex(width / points, height / 1.5 + wav + step);
    curveVertex(2 * width / points, height / 1.5  - wav + step);
    curveVertex(3 * width / points, height / 1.5  + wav + step);
    curveVertex(4 * width / points, height / 1.5  - wav + step);
    curveVertex(5 * width / points, height / 1.5  + step);
    vertex(5 * width / points, height / 2 + step);
    vertex(width, height);
    vertex(0, height);
    vertex(0, height);
    endShape(CLOSE);

    //toggle when waves get high
    if (wav >= 15) {
    	toggle = 0;
    } else if (wav <= -15) {
    	toggle = 1;
    }

    //wave movement correction
    if (toggle == 0) {
    	wavy = wavy - 0.3;
    } else if (toggle == 1) {
    	wavy = wavy + 0.3;
    }

	//top right cloud - position shift as y-asis changes
	push();
	fill(255, 255, 255, 110);
	ellipse(440 - mouseY / 10, 320, (constrain(mouseY, 120, 320)), 25);
	pop();

	//bottom left cloud - position shift as y-axis changes
	fill(255, 255, 255, 100);
	ellipse(mouseY / 5.5, 370,(constrain(mouseY, 100, 340)), 20);

	//birds' right wings - birds move along with the mouse
	noStroke();
	fill(bird);
	arc(mouseX, mouseY, 20, 4, 0, PI + QUARTER_PI, PIE);
	arc(mouseX + 15, mouseY + 13, 20, 4, 0, PI + QUARTER_PI, PIE);
	arc(mouseX + 25, mouseY + 7, 20, 4, 0, PI + QUARTER_PI, PIE);
	arc(mouseX + 65, mouseY + 9, 20, 4, 0, PI + QUARTER_PI, PIE);
	arc(mouseX + 145, mouseY + 30, 20, 4, 0, PI + QUARTER_PI, PIE);

	//birds' left wings - birds move along with the mouse
	ellipse(mouseX - 4, mouseY - 3, 3, 10);
	ellipse(mouseX + 12, mouseY + 9, 3, 10);
	ellipse(mouseX + 22, mouseY + 3, 3, 10);
	ellipse(mouseX + 62, mouseY + 5, 3, 10);
	ellipse(mouseX + 142, mouseY + 26, 3, 10);

	//when the white birds go below the water, birds color changes to gray
	if (mouseY > 500) {
		bird = 205;
	} else {
		bird = 255;
	}
}
At first, I wanted to create a realistic radial gradient sun, but the visuals did not turn out the way I expected; so I diverted direction and created a much simpler, more animated concept of the sunset beach.
LO 3 – Computational Fabrication
Norwegian Wild Reindeer Centre Pavilion (2011) by Snøhetta
The Norwegian Wild Reindeer Centre Pavilion is an observation pavilion that overlooks the Snøhetta mountain in Norway. The rock shaped wooden core represents the surrounding rock that has been eroded due to wind and running water.
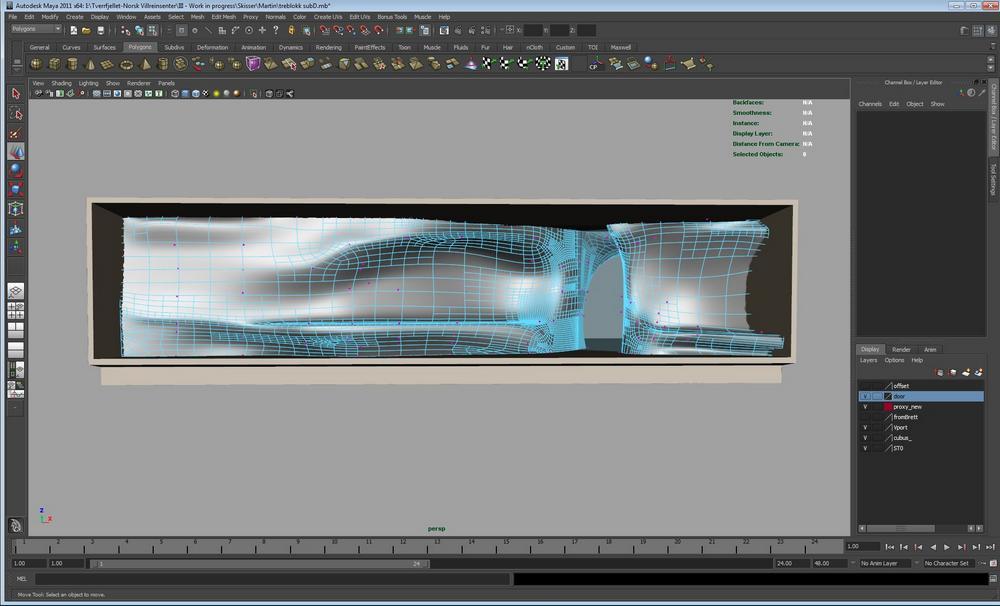
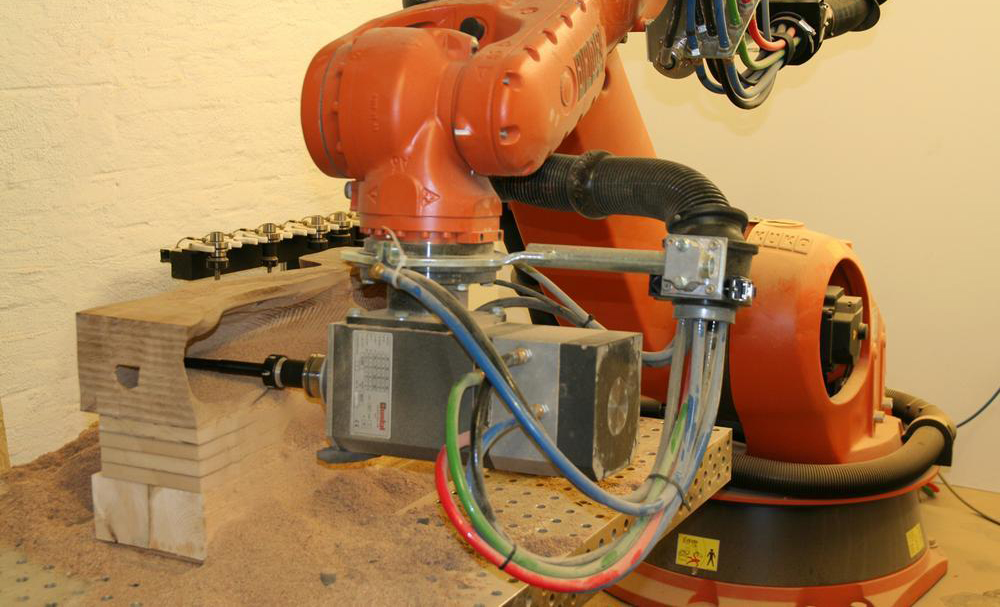
In order to generate the form, Snøhetta design team used “digital 3D-models such as MAYA to drive the milling machines, Norwegian shipbuilders in Hardangerfjord created the organic shape from 10 inch square pine timber beams.” After, the wood was assembled in a traditional way – using wood pegs as fasteners. The form resembles Snøhetta’s style of expressionism and visual boldness. Materials include pine tar treated exterior wall and oiled interior wood walls.
The pavilion is a robust yet undisturbed in its form that the building itself “gives visitors an opportunity to reflect and contemplate this vast and rich landscape.” Personally, this aesthetic and design quality is the most admirable in which this company engages the audience with the architecture as well as the landscape in a natural, flowing way.
LO: Computational Fabrication
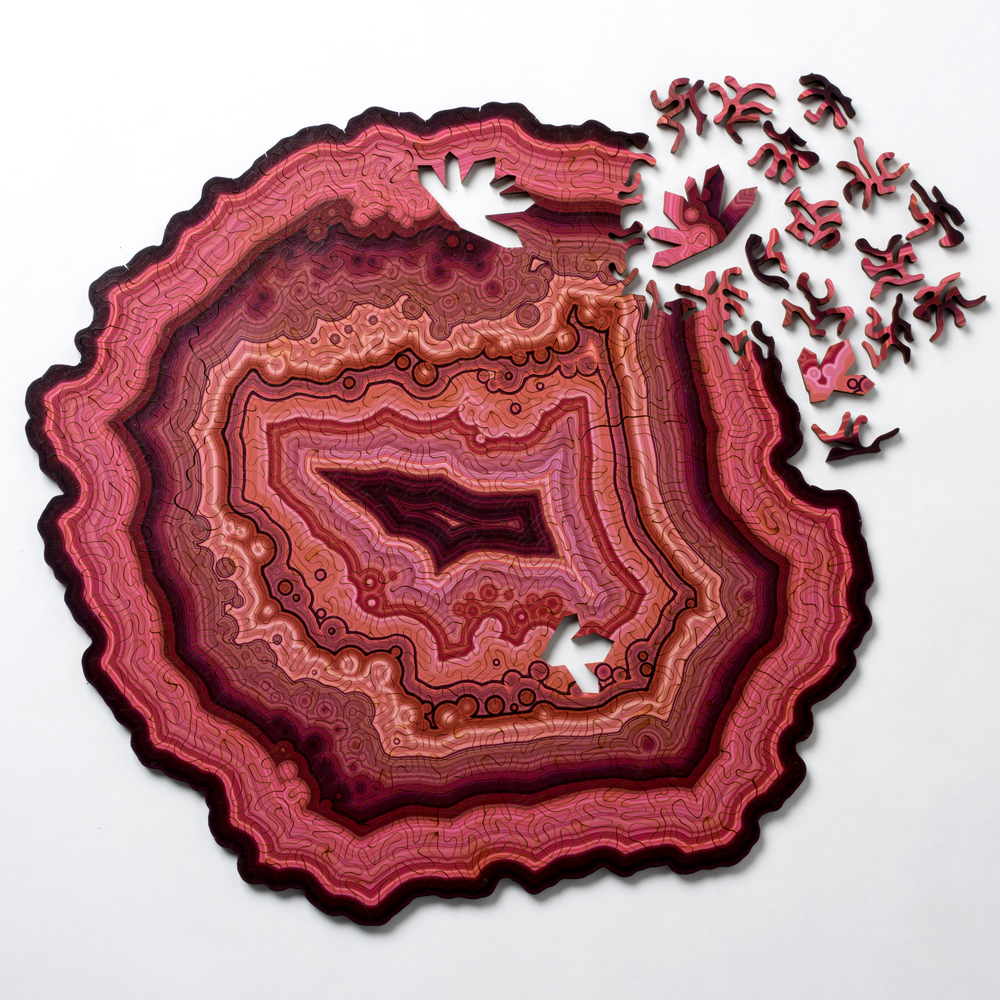
One project that particularly stands out to me is the generative jigsaw puzzles by Nervous System, a Massachusetts-based design studio. They write specialized programs that imitate processes found in nature. They then use that code to create projects inspired by organic forms. Their recent geode jigsaw puzzle is made out of slices of agate that mimics the natural variations in how geodes form that changes the puzzle’s shape, color, and pattern, making each one uniquely different. The goal of Nervous System was to forge together the artistry of traditional, hand-made jigsaw puzzles with the possibilities of new technology. It is interesting using man-made technology to imitate nature and try to artificially create nature. However, by doing so, it allows us to recognize and closely analyze on how nature works. This could allow us to make advances to technology and create new opportunities that weren’t possible before.
Nervous System: https://n-e-r-v-o-u-s.com/index.php
Looking Outwards-03
Work: Times Eureka Pavilion
By: NEX Architecture x Marcus Barnett
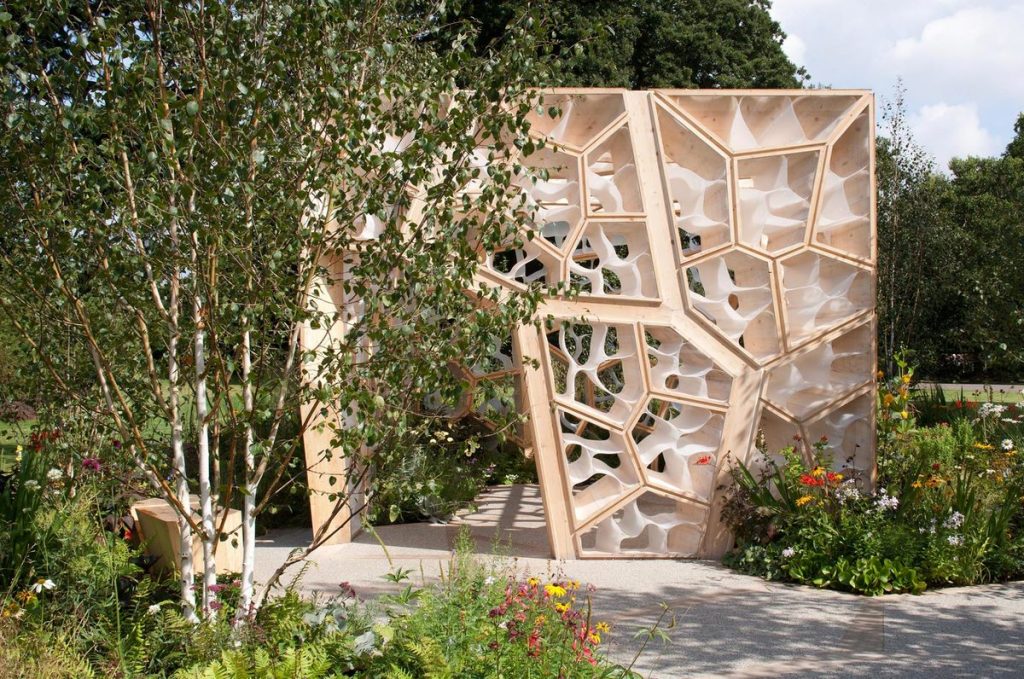
The Times Eureka Pavilion in London is the stunning result of a collaboration between NEX Architecture and Marcus Barnett for the 2011 Chelsea Flower Show. As it sits in a garden among a lush collection of plants, the pavilion imitates the cellular makeup of these plants: branch-like structures emerge from one another and let light through into the cubic space inside, as if viewers are peering through a microscope at a section of a fibrous stem. To generate this work, the creators used computational genetic algorithms, representing the intricacies of the natural world in a grander, more calculated way. I especially admire the fact that this structure gives back to the space within which it resides–it is said that the roof collects rainwater and lets it back into the soils, and the way the walls are structured disperses natural light both into the interior and exterior. I believe that this is a perfect example of technology and nature living in harmony, complementing one another instead of competing for dominance.
LO 3: Computational Fabrication
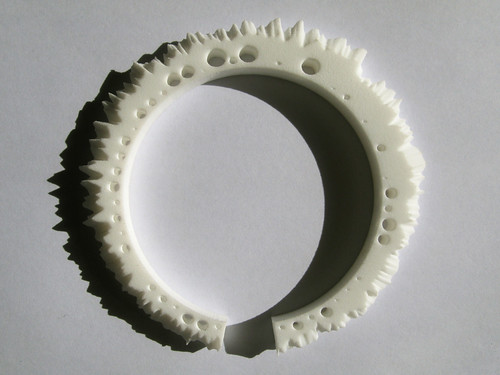
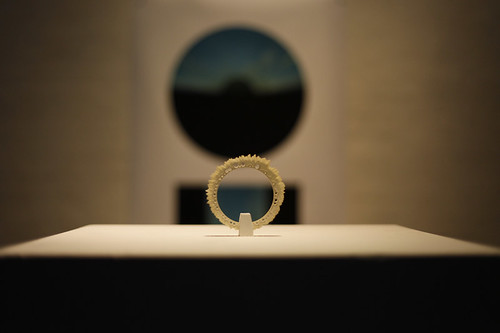
Creating the Weather Bracelet, Mitchell Whitelaw used generative design to translate the weather-data of Canberra, Australia into a fascinating jewelry piece. The height of each spike on the bracelet represents its daily maximum temperature, and the height of each spike’s shoulder represents its daily minimum. Generally, data visualization is seen in 2d form–whether it be graphic or motion graphic. However, Whitelaw’s work visualizes data as something physical as well as visual. By portraying data through an object–also known as autographic visualization–Whitelaw’s work is eye-opening and captivating. In addition to its interesting process, the final work, the bracelet itself, is intrinsically beautiful. The uneven spikes and holes provide the bracelet with complexity and a futuristic look, balancing well with its minimalistic white color.
Whitelaw accomplished most of his work by first defining a set of 3D points using beginShape() and vertex() and PVectors. To save the geometry of his object, he also used the SuperCad library to write an obj. file. He then worked in MeshLab and Blender to 3D model his bracelet before printing it out.
By utilizing the power of computation, Whitelaw was able to create a jewelry piece that is scientifically meaningful as well as personally meaningful. While making weather data tangible visually and physically, the bracelet also established a personal relationship with the wearer through the sense of touch. It facilitates an exciting experience as the wearer runs his or her fingers down the bracelet, reminiscing about the memories of different seasons and weather.
Creator: Mitchell Whitelaw
Title: The Weather Bracelet
Year: 2009
Link: http://teemingvoid.blogspot.com/2009/10/weather-bracelet-3d-printed-data.html
Project 3 – Dynamic Drawing
function setup() {
    createCanvas(400, 400);
    rectMode(CENTER);
}

function draw() {
    background(30, 30, 40);
    noStroke();
    translate(200, 200);
    let angle = mouseY;
    rotate(radians(angle));
    //rectangle
    translate(-200, -200);
    fill(221, 115, 115);
    var m = max(min(mouseX, 400), 0);
    var size = m * 350.0 / 400.0;
    rect(10 + m * 190.0 / 400.0, 200.0,
         size/2, size/2);
    fill(234, 217, 76);
    size = 350 - size;
    rect(200 + m * 190.0 / 400.0, 200.0,
         size/2, size/2);
    //circles
    fill(209, 209, 209);
    var m = max(min(mouseY, 400), 0);
     var size = m * 350.0 / 400.0;
    circle(10 + m * 190.0 / 400.0, 200.0,
         size/2);
    fill(81, 163, 163);
    size = 350 - size;
    circle(200 + m * 190.0 / 400.0, 200.0,
         size/2);
    //small circle
    var m = min(min(mouseX, 400), 0);
    var size = m * 350.0 / 400.0;
    fill(100, 178, 200);
    size = 250 - size;
    circle(m * 190.0 / 400.0, 200.0,
         size/10);
    //small circle pink
    var m = min(min(mouseX, 400), 0);
    var size = m * 350.0 / 400.0;
    fill(240, 178, 200);
    size = 250 - size;
    circle(width - (m * 190.0 / 400.0), height - (200.0),
         size/10);
    //vertex circles
     fill(59, 53, 97);
    var m = max(min(mouseY, 400), 0);
     var size = m * 350.0 / 400.0;
    circle((10 + m * 190.0 / 400.0) + 100, (200.0) + 100,
         size/5);
    fill(196, 224, 249);
    size = 350 - size;
    circle((200 + m * 190.0 / 400.0) - 100, (200.0) - 100,
         size/5);
    //other vertex circles
     fill(171, 73, 103);
    var m = max(min(mouseY, 400), 0);
     var size = m * 350.0 / 400.0;
    circle(width - ((10 + m * 190.0 / 400.0) + 100), height - ((200.0) + 100),
         size/5);
    fill(173, 246, 177);
    size = 350 - size;
    circle(width - ((200 + m * 190.0 / 400.0) - 100), height - ((200.0) - 100),
         size/5);

}
I was inspired by random movements of shapes and the pattern that could be formed from it. The color palette was a big factor in this project.
![[OLD FALL 2020] 15-104 • Introduction to Computing for Creative Practice](../../../../wp-content/uploads/2021/09/stop-banner.png)
