Project 9 Portrait

The project uses transparency and the mouse IS Pressed function to achieve a variety of detail with the newly generated portrait. The new portrait can range from highly abstract to an almost monet like blurry vision.

Hold the mouse button to scramble the image.

Release the moue button to make the image clear

sketch
//tjchen 
//hand in 9 project 

var img;
var pts;// amount of divisions on the canvas
var steps;

function preload(){
    //loads teh image
    img= loadImage("https://i.imgur.com/68RyRgM.jpg");
}
function setup() {
    background(255);
    frameRate(10);
    createCanvas(480, 270);
    //center image on canvas
    imageMode(CENTER);
    noStroke();
    img.loadPixels();
    //generate random grid subdivision
    pts = int(random(1,40));
    print(pts); // for dbugging
}

function draw() {
    //generate grid
    for (let x = 0; x<width; x+=width/pts){
        for(let y = 0; y<height; y+=height/pts){
            //get color information from pixel
            let c = img.get(x,y);
            noStroke();
            //create the subdivided pixelated image 
            fill(c[0],c[1],c[2],10);
            square(x,y,width/pts);
        }
    }

    //hold mouse to rescramble the image 
    //release to unblur
    if(mouseIsPressed){
        pts = int(random(1,40));
    } 
}

My Portrait

I wanted to create a portrait that used random points from the canvas to generate the image, while being modified by the cursor position.

sketch
let img;
let thin, thick;

function preload() {
  img = loadImage('https://i.imgur.com/l7MihtV.jpg');
}

function setup() {
  createCanvas(536, 600);
  thin = 5;
  thick = 45;
  imageMode(CENTER);
  noStroke();
  background(255);
  img.loadPixels();
}

function draw() {
  //Maps mouseX and mouseY to 5 and 45 to scale both dimensions of the rectangle
  let sizeX = map(mouseX, 0, width, thin, thick);
  let sizeY = map(mouseY, 0, height, thin, thick)
  //Picks random points from the image and stores them in x and y
  let x = floor(random(img.width));
  let y = floor(random(img.height));
  //Gets the exact pixel
  let pixel = img.get(x, y);
  //Draws rectangle according to randomly chosen position
  //and cursor position
  fill(pixel, 128);
  rect(x, y, sizeX, sizeY);
}

Project-09: Portrait

For this week’s project, I chose to draw a picture of me when I was a baby holding up a peace sign. I tried to draw the portrait by mimicking short paint strokes. To do so, instead of making random dots, I drew random short lines whose directions can be changed by pressing the mouse (there is a total of 4 directions). I also thought it would be interesting to see how the different directions of the same shape can alter the way the portrait was drawn so ran the code several times with the direction being different each time.

sketch
let img;
var lineType = 1;

function preload() {
	img = loadImage("https://i.imgur.com/dy7iC57.jpg");
}

function setup() {
  createCanvas(480, 480);
  background(255);
  img.resize(width, height);
  img.loadPixels();
  frameRate(50);
}

function draw() {
  	var x = floor(random(img.width)); // random x position
  	var y = floor(random(img.height)); // random y position
  	var pixel = img.get(x, y); // single pixel from image (color)
  	stroke(pixel);
  	strokeWeight(3);
	if(lineType == 1) { // slanted lines starting from left
  		line(x, y, x + 7, y + 7);
  	}
 	else if(lineType == 2){ // horizontal lines
  		line(x, y, x + 7, y);	
  	}
  	else if(lineType == 3){ // slanted lines starting from right
  		line(x + 7, y, x, y + 7);
  	}
  	else { // vertical lines
  		line(x, y, x, y + 7);
  	}
}

function mousePressed() {
	if(lineType == 1) {
		lineType = 2;
	}
	else if(lineType == 2) {
		lineType = 3;
	}
	else if(lineType == 3) {
		lineType = 4;
	}
	else {
		lineType = 1;
	}
}
final with all strokes
final with one type of stroke (slanted from left)

LO -09

Looking at Zimmy’s post from week six, she wrote about Manolo Gamboa Naon and his piece “Mantel Rojo.”
The theme for the week was Randomness. What really drew meto the post was the image of the work. As Zimmy describes, there is no focal point making the viewer see the piece as a whole. I definitely agree that it is very intruging how the longer you look the more details become apparant. The random aspect of the piece is how the shapes are generated.
Zimmy does a great job explaining how the composition draws the attention of the viewer. To add to her discussion It is very cool how the pseudo-randomness created some small patterns only really noticable when looking at the details where the swirls create a path that the viewers eyes follow.

Looking Outwards 8

For this week’s LO, I decided to look into Eva Franch, who was the first female director of the renown Architectural Association School of Architecture up until a handful of months ago when she was controversially fired. Eva, who presented at Eyeo 2015, is from Catalonia and studied architecture there for a handful of years before she went on to teach at multiple American universities while founding her own practice, named Office of Architectural Affairs.

Franch’s work has addressed architecture within the context of technology and social, political, and economical issues, with her work aiming to provoke and project ideas about architecture’s standing in the current day and the future. She believes architecture has the responsibility and ability to articulate these fields, and aims to redefine the limits of architecture as a profession and role in society.

Her presentation methods, which vary from digital forms to collections of written articles, often contrast pros and cons of a given urban area she is studying, and re-emphasize architecture’s cyclical relationship between the social, political, and economic issues that can surround a city. She does not lose focus of reality, yet presents ideas and solutions that can be controversial and often viewed as utopic, as they push the boundary of what is defined as architecture.

Fireworks

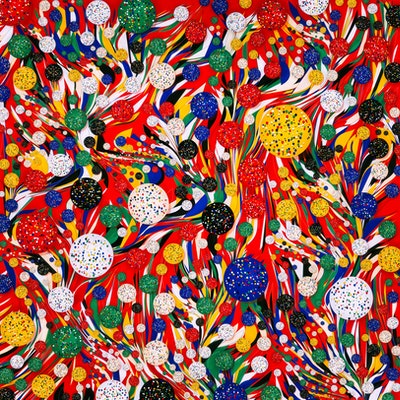
This program was inspired when I was playing around with altering the degree of the function, and noticing that it behaved like a flashing light. I applied this to the mouse, using the mouse to control how the function behaves, and also it’s size, to create “flashes”. I colored them, and they became fireworks. To add another interactive element, I wanted to make something that the user could “explode” themselves, so I added the TNT.

sketch

var nPoints = 100;      //used for loops and mapping
var q = 10;     //used for changing degree
var p = 0;      //used for changing size

function setup() {
    createCanvas(400, 400);
    background(0,0,0)
    frameRate(10);
}


function draw() {
    background(0);  //black
    noStroke(); 

rectMode(CENTER);
fill(255,0,0)   //red
    rect(width/2,height/2,30,50)    //TNT block
fill(255)
    rect(width/2,height/2,30,20)
fill(0)
    text('TNT',width/2-12,height/2+5)

if(mouseIsPressed){
   if(mouseX<(width/2)+15 & mouseX>(width/2)-15 && mouseY<(height/2)+25 && mouseY>(height/2)-25)   //if mouse is inside TNT
        p=p+5       //increse size of explosion curve
    }else{
        p=0     //hide explosion curve
}

push();
translate(mouseX,mouseY-20)
    drawQuad7Curve();       //dynamite fuse
        q=q+1       //change degree of curve
            if(q>60){
                  q=10    //reset degree of curve after 60 changes
}
pop();

push();
    fill(255,0,0);  //red
        rect(mouseX,mouseY,10,20);  //TNT block
pop();

push()
if(mouseX>25 & mouseX<75){
     translate(20,50);  
       drawQuadCurve();     //green firework  
   }
if(mouseX<25){
    fill(0,255,0);      //green
       rect(20,height-mouseX*12,2,20)   //green firework starter
}
pop();

push();
 if(mouseX>50 & mouseX<100){
     translate(100,100);
         drawQuad2Curve();      //red firework
}
pop();

push();
if(mouseX>10 & mouseX<60){
    fill(255,0,0)       //red 
        rect(100,height-mouseX*4.5,2,20);    //red firework starter
}
pop();

push();   
if(mouseX>100 & mouseX<150){ 
    translate(200,300);
        drawQuad3Curve();       //blue firework 
}
pop();

push();
if(mouseX>60 & mouseX<110){
    fill(0,0,255);  //blue
        rect(200,height-mouseX/2,2,20);     //blue firework starter
}
pop();

push(); 
if(mouseX>150 & mouseX<200){
push();
    translate(300,200);
        drawQuad4Curve();   //yellow firework
} 
pop();

push();
 if(mouseX>100 & mouseX<150){
    fill(255,255,0);    //yellow
        rect(300,height-mouseX,2,20);       //yellow firework starter
}
pop();

push();
 if(mouseY>200 & mouseY<250){
    translate(350,100)
        drawQuad8Curve()        //purple firework
 }
pop();

push();
 if(mouseY>100 & mouseY<200){
    translate(150,50)
        drawQuad9Curve()        //light blue firework
 }
pop();

push();
    translate(200,200)
        drawQuad5Curve();       //orange explosion curve
        drawQuad6Curve();       //white explosion curve

 pop();


//--------------------------------------------------
function drawQuadCurve() {
    
var x;
var y;
var r;

    
    var a = map(mouseX,0,50,0,width/5);     //size determined by mouseX within a mapped range
    var n = constrain(mouseX, 0, height/2);     //degree of curve determined by a constrained mouseX

    
    fill(0,255,0);      //green
    beginShape();
    for (var i = 0; i < nPoints; i++) {
        var t = map(i, 0, nPoints, 0, TWO_PI);      //determine angle by mapping
        
        r =  a * sin(n*t)   //radius
           
        x = r * cos(t);     //x of function
        y = r * sin(t);     //y of function
        vertex(x, y);       //plot function
    
    }
    endShape(CLOSE);        //close object to fill


}

function drawQuad2Curve(){
    
var x;
var y;
var r;

    
    var a = map(mouseX,50,100,0,width/9)
    var n = constrain(mouseY/2, 0, height); 

    
    fill(255,0,0)
    beginShape();
    for (var i = 0; i < nPoints; i++) {
        var t = map(i, 0, nPoints, 0, PI*5);
        
        r =  a * sin(n*t) 
           
        x = r * cos(t);
        y = r * sin(t);
        vertex(x, y);
    }
    endShape(CLOSE);


}

function drawQuad3Curve(){
    
var x;
var y;
var r;

    
    var a = map(mouseX,100,150,0,width/7)
    var n = constrain(mouseX, 0, height-mouseY); 

    
    fill(0,0,255);
    beginShape();
    for (var i = 0; i < nPoints; i++) {
        var t = map(i, 0, nPoints, 0, PI*3);
        
        r =  a * sin(n*t)    
        x = r * cos(t);
        y = r * sin(t);
        vertex(x, y);
    }
    endShape(CLOSE);

}

function drawQuad4Curve(){
    
var x;
var y;
var r;

    
    var a = map(mouseX,150,200,0,width/5)
    var n = constrain(mouseX, 0, mouseY); 

    
    fill(255,255,0);
    beginShape();
    for (var i = 0; i < nPoints; i++) {
        var t = map(i, 0, nPoints, 0, TWO_PI);
        
        r =  a * sin(n*t)    
        x = r * cos(t);
        y = r * sin(t);
        vertex(x, y);
    }
    endShape(CLOSE);


}

function drawQuad5Curve(){
    
var x;
var y;
var r;

    
    var a = p*20
    var n = 60; 

    
    fill(247,181,67);
    beginShape();
    for (var i = 0; i < nPoints; i++) {
        var t = map(i, 0, nPoints, 0, TWO_PI);
        
        r =  a * sin(n*t) 
           
        x = r * cos(t);
        y = r * sin(t);
        vertex(x, y);
    }
    endShape(CLOSE);

}

function drawQuad6Curve(){
    
var x;
var y;
var r;

    
    var a = p*5;
    var n = 30; 

    
    fill(255);
    beginShape();
    for (var i = 0; i < nPoints; i++) {
        var t = map(i, 0, nPoints, 0, TWO_PI);
        
        r =  a * sin(n*t) 
           
        x = r * cos(t);
        y = r * sin(t);
        vertex(x, y);
    }
    endShape(CLOSE);

}

function drawQuad7Curve(){
    
var x;
var y;
var r;

    
    var a = 10
    var n = constrain(q, 0, height);        //degree based on the changingvariable q

    
    fill(255,255,0);
    beginShape();
    for (var i = 0; i < nPoints; i++) {
        var t = map(i, 0, nPoints, 0, TWO_PI);
        
        r =  a * sin(n*t) 
           
        x = r * cos(t);
        y = r * sin(t);
        vertex(x, y);
    }
    endShape(CLOSE);

}

}
function drawQuad8Curve(){
    
var x;
var y;
var r;

    
    var a = mouseX/10
    var n = constrain(q, 0, height);  
    
    fill(182,68,249);
    beginShape();
    for (var i = 0; i < nPoints; i++) {
        var t = map(i, 0, nPoints, 0, TWO_PI);
        
        r =  a * sin(n*t) 
           
        x = r * cos(t);
        y = r * sin(t);
        vertex(x, y);
    }
    endShape(CLOSE);

}

function drawQuad9Curve(){
    
var x;
var y;
var r;

    
    var a = map(mouseY,100,200,0,height/20)
    var n = constrain(q*2, 0, height); 

    
    fill(68,237,249);
    beginShape();
    for (var i = 0; i < nPoints; i++) {
        var t = map(i, 0, nPoints, 0, PI);
        
        r =  a * sin(n*t) 
           
        x = r * cos(t);
        y = r * sin(t);
        vertex(x, y);
    }
    endShape(CLOSE);

}

Project 7: Curves

sketchDownload
var a = 0; //radius of exterior circle
var b = 0; //radius of interior circle
var h = 0; //distance from center of interior circle

var r;
var g;
var b;

var theta = 0; //angle


function setup() {
    createCanvas(500, 500);
    background(220);

}

function draw() {
    r = map(mouseX, 0, width, 45, 191);
    g = map(mouseX, 0, width, 16, 175);
    b = map(mouseY, 0, height, 105, 225);
    background(r, g, b);
    for (var x = 0; x <= width; x += 70) {
        for (var y = 0; y <= height; y += height/5) {
            push();
            translate(x, y);
            drawHypotrochoid();
            pop(); 
        }
    }
}


function drawHypotrochoid() {
    noFill();
    r = map(-mouseX, 0, width, 107, 24);
    g = map(-mouseX, 0, width, 67, 162);
    b = map(-mouseY, 0, height, 67, 162);
    stroke(r, g, b);
    
    a = map(mouseX, 0, width, 1, width/10);
    b = 20;
    h = map(mouseY, 0, height, 1, height/5);
    
    beginShape();
    for (var i = 0; i < 1000; i++) {
        var x = ((a-b) * cos(theta)) + (h * cos((a-b)/b * theta));
        var y = ((a-b) * sin(theta)) - (h * sin((a-b)/b * theta));
        var theta = map(i, 0, 100, 0, TWO_PI);
        vertex(x, y);
    }
    endShape();

}

I chose the hypotrochoid curve because when I was experimenting with it, so many different patterns came out of it and I wanted the result to have as many variations as possible. So as you move your mouse up, down, or diagonal, the curve patterns would change every few movements.

Project 07: Curves

This project was a really fun experience with using different curves to simulate weather, along with arrays and shifting elements in the array. It was difficult to actually get the weather to move the way I wanted it to but I’m still unhappy with how some of the rain function works. It took a bit to get the curves working but from there it wasn’t too hard to get the grids working the way I wanted, although there were some pretty funny interactions with the direction and speed with which the curves moved and fell.

weather

var nPoints = 100
var curveX = []
var curveY = []
var numCurves;


function setup() {
    createCanvas(480, 480);
}


function draw() {
	numCurves = width
	for (y = 0; y < width; y += 40){ ////sends data to arrays to translate for curves
    for (x = 0; x < height; x += 40){
            curveY.push(y)
            curveX.push(x)
        }
    }
	background(0, 0, 255, 4)
	if (mouseIsPressed) { ///changes curve and color when mouse is held down
		rain()
	} else {
	    wind()
	}
}

function drawGrid() { ///establishes moving pattern of neiods for the rain() function
curveX.shift()
curveY.shift()
for(n = 0; n <= numCurves; n++){
	translate(curveX[n], curveY[n])
	drawNeoid()
}
}


function drawSecond() {  ///establishes moving pattern of curves for the wind() function
curveX.shift()
curveY.shift()
for(k = 0; k <= numCurves; k++){
	translate(curveX[k], curveY[k])
	drawLituus()
    }
}
function drawNeoid() { ///draws a neiod curve based on the mouse location
	var x
	var y
	var r
	var a = mouseX / 10
	var b = mouseY / 5
	beginShape()
	   for (var i = 0; i < nPoints; i++) {
            var t = map(i, 0, nPoints, 0, TWO_PI); ///converts to terms of pi
            r = (a * t) + b ////neiod formula
            x = r * cos(t)
            y = r * sin(t)
            vertex(x, y)
        }
    endShape()        
}

function drawLituus() { ///draws a lituus curve based on the mouse location, similar process to drawNeiod() with a different formula
    var x
	var y
	var r
	var a = (mouseX / 10) + (mouseY / 5)
	beginShape()
	   for (var i = 0; i < nPoints; i++) {
            var t = map(i, 0, nPoints, 0, TWO_PI);
            r = sqrt(sq(a) / t) ///lituus formula in terms of r
            x = r * cos(t)
            y = r * sin(t)
            vertex(x, y)
        }
    endShape()
}

function rain(){ ///draws a pattern of blue neiods like rain
	drawGrid()
	stroke(0, 0, 255)
	background(236, 236, 236, 4)
}

function wind(){ ////draws white lituuses like wind
	drawSecond()
	stroke(255, 255, 255)
	}

LO 07: Data Visualization

For this week’s LO, I researched the 24 hour movement of air traffic over Europe, called Europe 24, found on Visual Complexity. It is a beautiful array of data, set over a geographically accurate representation of Earth to better reflect where each plane is going. Europe 24 was made by NATS, the leading organization in air traffic control in the UK, which oversees all airports in the country, especially the busiest airport in Europe, in Heathrow. The visualization is particularly important for a company such as NATS as it provides a representation of how flights move over the space they work to keep safe and allows them to identify areas of high traffic which could prove to be dangerous. It is also artistically pleasing, with soft blues and a beautiful almost-photorealistic graphic of the globe below each line. The entirety of the animation is very clean and professional, as befitting such an important organization, and the overall cleanliness of the work makes it more accessible to the public so they might understand the work of NATS in the UK. Individual planes are show as points of light to enhance clarity as they move, and so they are not lost in the blue trails others leave behind, and cities are highlighted so they stand out as well.

The video of Europe 24 running, tracking flights over the continent for a day.