![[OLD FALL 2018] 15-104 • Introduction to Computing for Creative Practice](../../../../wp-content/uploads/2020/08/stop-banner.png)
function setup() {
createCanvas(480, 100);
}
function draw() {
var H = hour();
var M = minute();
var S = second();
var colorFill = 0;
background('black');
for (var i = 0; i < H + 1; i++) {
colorFill = (3000/i);
stroke(colorFill, 0, 0);
line(width - i * 10 + 9, 0, width - i * 10 + 9, height/3);
}
for (var i = 0; i < 24 - H; i++) {
colorFill = (3000/i);
stroke(colorFill, 0, 0);
line(i * 10, 0, i * 10, height/3);
}
for (var i = 0; i < M + 1; i++) {
colorFill = (3000/i);
stroke(colorFill, 0, 0);
line(width - i * 5 + 4, height/3, width - i * 5 + 4, height/3*2);
}
for (var i = 0; i < 60 - M; i++) {
colorFill = (3000/i);
stroke(colorFill, 0, 0);
line(i *5, height/3, i * 5, height/3*2);
}
for (var i = 0; i < S + 1; i++) {
colorFill = (3000/i);
stroke(colorFill, 0, 0);
line(width - i * 2.5 + 1.5, height/3*2, width - i * 2.5 + 1.5, height);
}
for (var i = 0; i < 60 - S; i++) {
colorFill = (3000/i);
stroke(colorFill, 0, 0);
line(i * 2.5, height/3*2, i * 2.5, height);
}
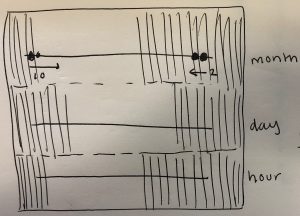
}For this project, I was inspired by a simple abacus.
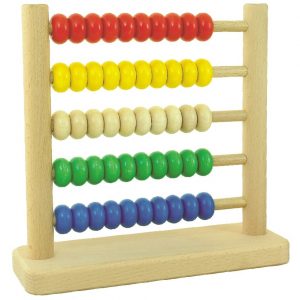
The abacus has historically been used as a mathematical and computational device, but I immediately was inspired by this as a clock, with each row representing a different time keeping variable (hour, minute, seconds) and each vertical line counting those variables. The script basically reflects the current time on the right and whatever is left over on the left, as if someone is moving a line over for each second, minute, etc.
I began by creating ellipses first, but then decided to create lines to create a deeper graphic relationship between the the hour, minutes, and seconds, as you can see that while the spacing is different between the lines for each variable, there are times when all of the lines vertically connect and it adds another element to this abstraction.