![[OLD FALL 2018] 15-104 • Introduction to Computing for Creative Practice](../../../../wp-content/uploads/2020/08/stop-banner.png)
Try clicking and dragging!
sketch
/*
Min Jun Kim
minjunki@andrew.cmu.edu
15104-B
Project 7
*/
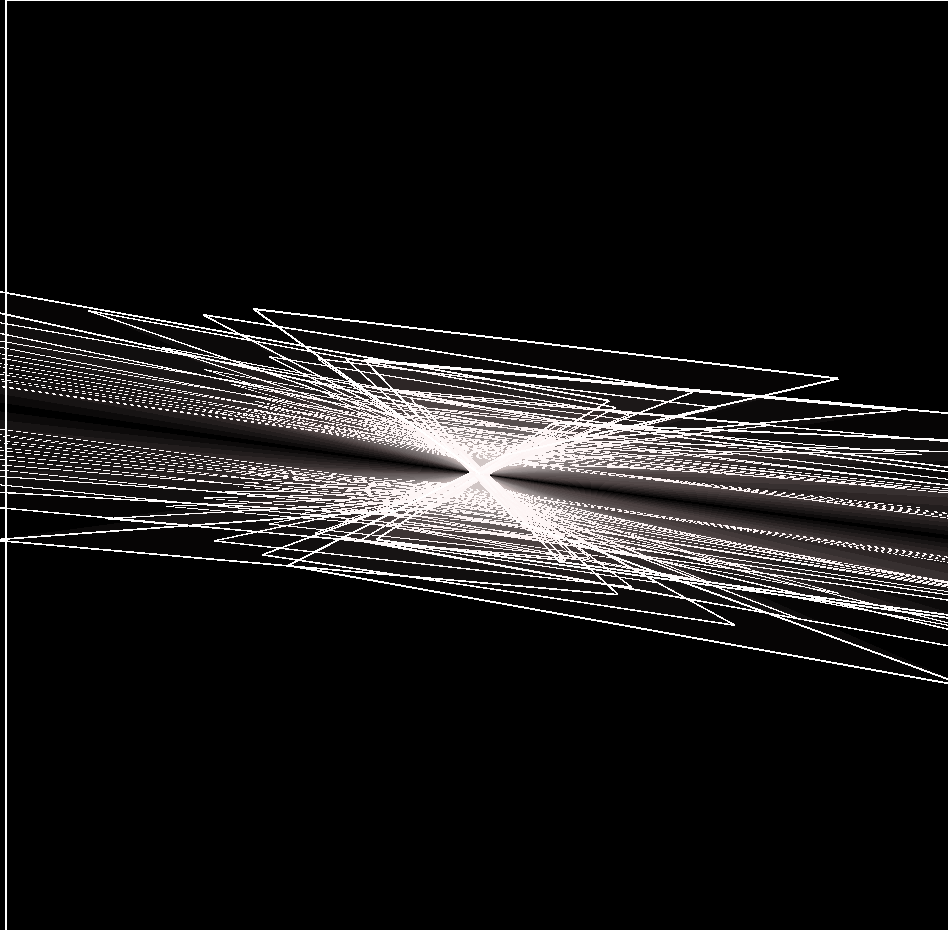
//This project draws a 3D model of spherial spiral
//how many points there are
var nPoints = 500;
//used for dragging
var dragging = false;
function setup() {
createCanvas(480, 480, WEBGL);
frameRate(100);
}
function draw() {
background(0);
// draw the frame
stroke(255);
noFill();
rect(-width/2+3, -height/2+3, width-6, height-6);
//a circle that follows the mouse
ellipse(mouseX-width/2,mouseY-height/2, 50,50);
// draws the curve
push();
//rotate on z axis automatically, rotate x and y when clicked
rotateZ(millis() / 8000);
if (dragging == true) {
rotateX((mouseX-width/2) / 500);
rotateY((mouseY-height/2) / 500);
}
//calls drawing function.
drawSphericalSpiral();
pop();
}
//--------------------------------------------------
function drawSphericalSpiral() {
// Spherical Spiral
// http://mathworld.wolfram.com/SphericalSpiral.html
//initialize points
var x;
var y;
var z;
//complexity depends on mouse
var ph = mouseX / 10000.0;
stroke(255);
//transparent fill
fill(255, 200, 200,3);
beginShape();
for (var i = 0; i < nPoints; i++) {
var t = map(i, 0, nPoints, 0, TWO_PI);
x = 80*cos(i)/Math.pow(1+ph*ph*t*t,1/2);
y = 80*sin(i)/Math.pow(1+ph*ph*t*t,1/2);
z = 80*-ph*i/Math.pow(1+ph*ph*t*t,1/2);
vertex(x, y, z);
}
endShape(CLOSE);
}
function mousePressed() {
dragging = true;
}
function mouseReleased() {
dragging = false;
}At first, I didn’t quite understand how to use mathematical functions to draw, but after messing around with the vertices, I learned the basics of it. I messed around with various functions, but I wanted to use a more complex curve. I then tried to implement a 3D function and the one that I liked the most was a spherical spiral. I thought that the shape was interesting in the drawings I found online. I realized that it doesn’t look exactly like that image I found online, which can possibly partly be attributed to the lack of negative values available in the functions, but I think that it still looks very interesting. The constant rotation made me dizzy so I implemented a dragging function so that it looks much simpler from one side. From the z axis, it looked like a regular circle so I made the coloring of it more transparent so that the planes are more see-through. I think the project turned out great and it taught me a lot about how to draw in javascript.
Here are some iterations where I was messing around with the numbers and variables in the function.