/*Tanvi Harkare
Section B
tharkare@andrew.cmu.edu
Project-07 */

var numLines = 20;
var angle = 0;
var angleX;
var clickCount = 1;
var circleW;
var circleC;

function setup() {
    createCanvas(480, 480);
}

function draw() {
    background(0);
    for(var i = 0; i < numLines; i++){
        noFill();
        strokeWeight(clickCount);
        push();
        angleX = map(mouseX, 0, 480, 0, 90); //altering how slow or fast ellipses rotate
        circleC = map(mouseX, 0, 480, 20, 255); //altering stroke color from black to white
        numLines = map(mouseY, 0, 480, 5, 50); // altering amount of lines drawn
        circleW = map(mouseY, 0, 480, 200, 50); //altering ellipse width
        stroke(circleC);
        translate(width / 2, height / 2);
        rotate(radians(angle));
        ellipseMode(CENTER);
        ellipse(0, 0, circleW, 400);
        pop();
        angle += angleX;

    }
}

function mouseClicked(){
    //increases strokeWeight parameter based on mouse clicks
    clickCount++;
}

function keyPressed() {
    clickCount = 1;
}
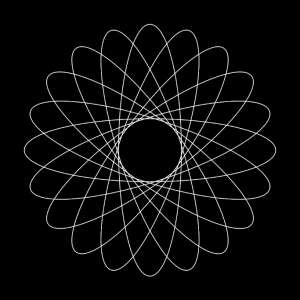
For this project, I was inspired by the spirograph curves. I created a set of ellipses that change based on mouseX and mouseY parameters. The mouseX changes the color of the stroke and the angle of rotation for the ellipses. The mouseY changes how many curves are drawn and the width of the curves. Additionally, when the mouse is clicked the strokeWeight will increase. When any key is pressed, the strokeWeight defaults back to its original value.

![[OLD FALL 2018] 15-104 • Introduction to Computing for Creative Practice](../../../../wp-content/uploads/2020/08/stop-banner.png)