/*
Alexandra Kaplan
Section C
aekaplan@andrew.cmu.edu
Project - 07
*/


var nPoints = 400; // length of all for loops

function setup() {
    createCanvas(480, 400);
    background(220);
}

function draw() {
	background(150, 200, 255);
	drawStem1();
	drawEpicycloid1();
	drawCenter1();
	drawStem2();
	drawEpicycloid2();
	drawCenter2();
	drawStem3();
	drawEpicycloid3();
	drawCenter3();
}

// draws middle flower
function drawEpicycloid1() {
	var x;
	var y;
	var b = 4 + (mouseX/50); // frequency of curves
	var a = map(mouseY, 0, 400, 200, 0); // diameter of path of curve
	var h = 10 // distance from path to outer curve

	fill(220, 200, 100);
	stroke(180, 160, 60);

    beginShape();
	for (var i = 0; i < nPoints; i += 1) {
        var t = map(i, 0, nPoints, 0, 360);
        x = (a + b) * cos(radians(t)) - h * cos((radians(a + b)/ b) * t);
        y = (a + b) * sin(radians(t)) - h * sin((radians(a + b)/ b) * t);
        vertex(x + width / 2, y + mouseY);

    }
    endShape(CLOSE);
}

// draws center of middle flower
function drawCenter1(){
	fill(50);
	var centerW1 = 1
	centerW1 = map(mouseY, 0, 400, 200, 1)
	ellipse(width / 2, mouseY, centerW1, centerW1);
}

// draws middle stem
function drawStem1(){
	fill(50, 150, 50);
	stroke(20, 120, 20);
	rect(width / 2 - 5, mouseY, 10, 1000);
}

// draws left flower
function drawEpicycloid2() {
	var x;
	var y;
	var b = 3 + (mouseX / 50); // frequency of curves
	var a = map(mouseY, 0, 400, 50, 0); // diameter of path of curve
	var h = 10 // distacne from path to outer curve

	fill(220, 200, 220);
	stroke(160, 140, 160);

    beginShape();
	for (var i = 0; i < nPoints; i += 1) {
        var t = map(i, 0, nPoints, 0, 360);
        x = (a + b) * cos(radians(t)) - h * cos((radians(a+b)/ b) * t);
        y = (a + b) * sin(radians(t)) - h * sin((radians((a+b)/b) * t));
        vertex(x + width / 4, y + mouseY + 170);

    }
    endShape(CLOSE);
}


// draws left center
function drawCenter2(){
	fill(50);
	var centerW2 = 0;
	centerW2 = map(mouseY, 0, 400, 50, 1);
	ellipse(width / 4, mouseY + 170, centerW2, centerW2);
}

// draws right stem
function drawStem2(){
	fill(150, 250, 150, 150);
	stroke(100, 200, 100);
	rect(width / 4 - 5, mouseY + 170, 10, 1000);
}

// draws right flower
function drawEpicycloid3() {
	var x;
	var y;
	var b = 2 + (mouseX / 50); // frequency of curves
	var a = map(mouseY, 0, 400, 20, 0); // diameter of path of curve
	var h = 6 // distance from path to outer curve

	fill(155, 155, 250);
	stroke(130, 130, 230);

    beginShape();
	for (var i = 0; i < nPoints; i++) {
        var t = map(i, 0, nPoints, 0, 360);
        x = (a + b) * cos(radians(t)) - h * cos((radians(a + b) / b) * t);
        y = (a + b) * sin(radians(t)) - h * sin((radians(a + b) / b) * t);
        vertex(x + width - width/4, y + mouseY + 250);
    }
    endShape(CLOSE);
}

// draws right center
function drawCenter3(){
	fill(50);
	var centerW3 = 0;
	centerW3 = map(mouseY, 0, 400, 20, 0);
	ellipse(width - width / 4, mouseY + 250, centerW3, centerW3);
}

// draws right stem
function drawStem3(){
	fill(100, 200, 100, 200);
	stroke(80, 180, 80);
	rect(width - width / 4 - 5, mouseY + 250, 8, 1000);
}
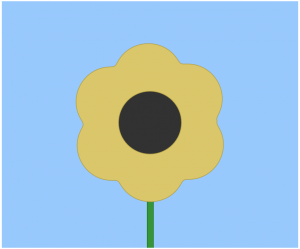
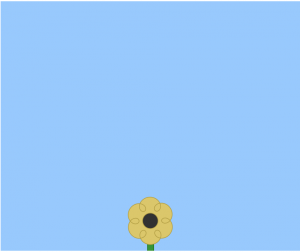
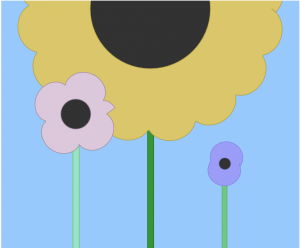
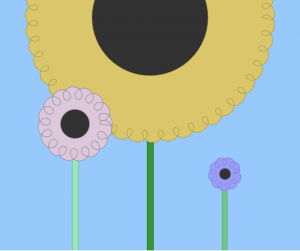
When looking at the description for this project, my mind immediately went to flowers and the different shapes of flower petals. It was pretty difficult at first to figure out how to insert the equations from the website into my code, but once I did it was fun to play around how I could then change the curves. Here are some screenshots of different x and y combinations:


![[OLD FALL 2018] 15-104 • Introduction to Computing for Creative Practice](../../../../wp-content/uploads/2020/08/stop-banner.png)