![[OLD FALL 2018] 15-104 • Introduction to Computing for Creative Practice](../../../../wp-content/uploads/2020/08/stop-banner.png)
//Kai Zhang
//Section B
//kaiz1@andrew.cmu.edu
//Project-07
var nPoints = 100;
function setup() {
createCanvas(600, 600);
colorMode(HSB, 100);
}
function draw() {
background(60, 40, 30);
angleMode(RADIANS);
translate(width / 2, height / 2);
rotate(-atan((mouseX - 300) / (mouseY - 300))); //rotate the object along with mouse
for (var m = 50; m < 130; m += 5) {
stroke(mouseX / 6, 130 - m, m - 10); // gives the radient curve colors
drawdevilsCurve(m); // generates a series of curves
stroke(mouseX / 6, 130 - m, m - 10);
drawastroidpedalCurve(m);
}
}
function drawdevilsCurve(v) {
var x;
var y;
var a = (mouseX - 300) / 3 * (100 + v) / 100;
var b = (mouseY - 300) / 3 * (100 + v) / 100;
noFill();
beginShape(); // draw the devil curves
for (var i = 0; i < nPoints; i++) {
var t = map(i, 0, nPoints, 0, TWO_PI);
x = cos(t) * sqrt((pow(a, 2) * pow(sin(t), 2) - pow(b, 2) * pow(cos(t), 2)) / (pow(sin(t), 2) - pow(cos(t), 2)));
y = sin(t) * sqrt((pow(a, 2) * pow(sin(t), 2) - pow(b, 2) * pow(cos(t), 2)) / (pow(sin(t), 2) - pow(cos(t), 2)));
vertex(x, y);
}
endShape(CLOSE);
beginShape(); // draw the devil curves 90 degree rotated
for (var i = 0; i < nPoints; i++) {
var t = map(i, 0, nPoints, 0, TWO_PI);
y = cos(t) * sqrt((pow(a, 2) * pow(sin(t), 2) - pow(b, 2) * pow(cos(t), 2)) / (pow(sin(t), 2) - pow(cos(t), 2)));
x = sin(t) * sqrt((pow(a, 2) * pow(sin(t), 2) - pow(b, 2) * pow(cos(t), 2)) / (pow(sin(t), 2) - pow(cos(t), 2)));
vertex(x, y);
}
endShape(CLOSE);
}
function drawastroidpedalCurve(v) {
var x;
var y;
var a = (mouseX - 300) / 3 * (100 + v) / 100;
var b = (mouseY - 300) / 3 * (100 + v) / 100;
noFill();
beginShape(); // draw the pedals
for (var i = 0; i < nPoints; i++) {
var t = map(i, 0, nPoints, 0, TWO_PI);
x = a * cos(t) * pow(sin(t), 2);
y = a * sin(t) * pow(cos(t), 2);
vertex(x, y);
}
endShape(CLOSE);
beginShape(); // draw the astroids
for (var i = 0; i < nPoints; i++) {
var t = map(i, 0, nPoints, 0, TWO_PI);
x = a * pow(cos(t), 3);
y = a * pow(sin(t), 3);
vertex(x, y);
}
endShape(CLOSE);
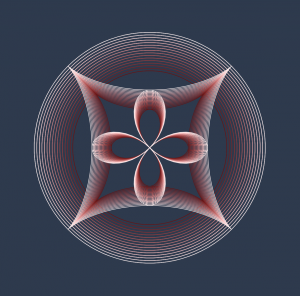
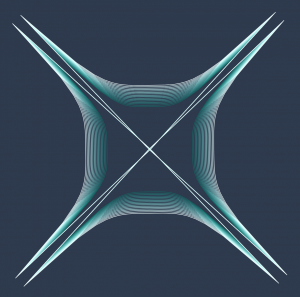
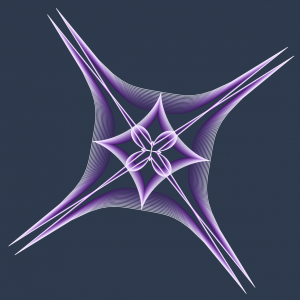
}In this project, I’ve used the combination of a few equations to generate my curves: the devil curve, the astroid curve, and the pedal curve.
(URL: http://mathworld.wolfram.com/AstroidPedalCurve.html; http://mathworld.wolfram.com/DevilsCurve.html)
I was looking to find curves that are dual symmetrical in respect to both axis. And I used for loop technique to create an array of radient color curves. Also as I move the mouse, the curves will expand, shrink, and changes color, because I’ve embedded variables that changes it. I also used arctangent to deduce the mouse orientation to the origin and then the curves will rotate as I move my mouse around. Here are three different satate of the curves.