Liz Maday Final Project

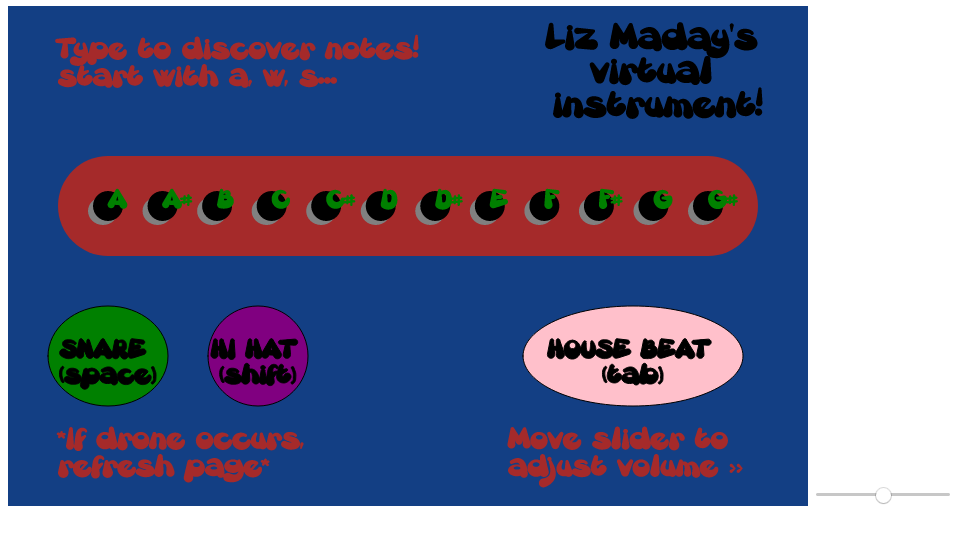
Liz Maday’s Virtual Instrument

emaday sketch copy

I am providing a zip file containing all the files involved in this project, available here: zip file .

There were too many files for the project to run adequately on word press. In order to run this program, the provided zip file must be downloaded, and a local server must be set up using either terminal in OSX or a command window in Windows. This would be accomplished by changing the directory to the file named Elizabeth Maday Final Project, and then typing in “python -m SimpleHTTPServer” or “python -m http.server”. Then the project can be viewed with the URL http://localhost:8000.

Sometimes this project seems to run better on Firefox than on Chrome.

This project was enjoyable to complete because it gave me an idea of what I might like to use p5 for in the future. I am interested in learning more about music technology and experimental methods of producing music, and I believe that p5 could be a great creative outlet.

Looking Outwards 12 Liz Maday

I am using one of my late days for this post.

One exciting project that I found was the live visuals performed by Mary Franck which accompanied electronic music performed by an assortment of artists, including Holly Herndon, Mike Gao, Luke Dahl, Colin Sullivan, Jennifer Hsu & Locky. This took place at the Modulations showcase in 2013 (an annual event that is hosted by Stanford’s Center for Computer Research in Music and Acoustics).

The performance involved a large screen which was placed behind the musicians on stage, and displayed on the screen was a progression of colorful, moving, geometric designs and dream-like images. The live visuals were created using a TouchDesigner program that Franck developed, known as Rouge, which is used for video performance and creating realtime 3D compositions.

I think this kind of audiovisual performance is really cool because of the way that it feels liberating – all the artists involved are able to realize spontaneous ideas and bring these dynamic ideas to life. This project is relevant to my final project because it uses both sound and visuals to create a whole experience.

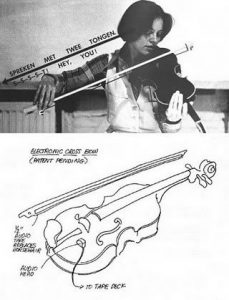
Another project that is inspiring to me is the tape bow violin, invented by Laurie Anderson in 1977, which had a large influence in the processes of integrating music and technology. She replaced the horsehair on the violin bow with magnetic tape, and put a tape head on the bridge of the violin. Using this technology, she was able to create non-traditional sounds using the violin by manipulating the sounds captured with the tape (for example, sound could be played backwards or forwards, and rearrange parts of the sound). I think that this project is relevant to my final project because of the way in which it deals with changing conceptions of the sound that can be produced using a traditional instrument. In my project, I intend to use a visual concept of an instrument that has some traditional characteristics, and pair it with non traditional sounds (produced by the user’s keyboard).

A visual representation of the tape bow violin.

I think both of these artists works are interesting to compare because they come from different eras, but both advance the ways in which technology can be integrated with music.

Final Project Proposal Liz Maday

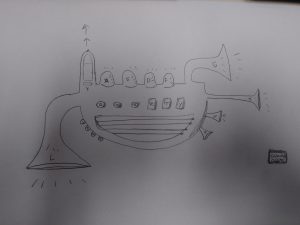
For my final project, I am going to create an interactive instrument using the keyboard to create sounds. There will be a visual representation of this instrument displayed on the canvas. It will not look like a traditional instrument, it may include one or more bell sections, in addition to many keys. I envision something akin to a Dr. Seuss instrument. Each key displayed on this instrument will correspond to one of the keys on the user’s computer keyboard. This information will be displayed on the keys on the instrument. When the user presses one of the keys, a specific sound will be produced, and the corresponding key on the instrument will light up or move. Certain sounds will be drones that continue to sound until the same key is pressed again, and other sounds will be percussive, only sounding right when the key is pressed, for a short period of time.

In addition, some visual representation will be generated in the background as any particular sound is playing.

I plan on including some kind of pop up instructions window that provides very basic instructions for how to explore this instrument. This window would be displayed when the user clicks the indicated section of the canvas.

Looking Outwards 10 Liz Maday


A video depicting the seaside location of Drift.

Drift (2004), designed by Teri Rueb, was inspired by idea of losing one’s self in an environment, something that seems to be increasingly difficult to achieve with the ubiquity of GPS and an increasingly explored world. This project invites the subject to allow themselves to simply “drift” in this ever changing sonic environment.

This interactive sound installation positioned by the Watten Sea of Northern Germany covers a region of about 2 km x 2 km. The subject wears headphones and experiences sounds that respond to movement, as well as the position of the tide and of satellites. Because of this constant change, one will never predict where any particular sound will be heard. For example, during low tide, the sounds are closer to the sea, and during high tide, they move outwards into the nearby town.

One of the reasons why I admire this work is because of how it utilizes technology in a way that enhances the beauty of this natural environment without making the subject overly focused on the technology used to create the installation. I also think that this installation would have a really wonderful effect of altering your consciousness in relation to the environment, and encouraging new perspectives.

Teri Reub is an artist whose work involves both sound and location through the use of mobile media. One of her largest contributions to her field is the establishment of “locative media” (interactive-installations based on GPS technologies) around 1997. She is now Professor of Media Study at the University of Buffalo, where she founded the Open Air Institute, which furthers learning and initiatives that deal with both media and ecology.

Looking Outwards 9 Liz Maday

I am using 1 of my grace days for this late submission.

For this Looking Outwards post, I was inspired by Kai Zhang’s post on Kinetic Generative Music Installation (2017) by Andrius Sarapovas. This project creates an environment that you walk into, which contains various forms of instruments that create sounds meant to represent connections to a 4G network in Lithuania. There are a lot of features of the instrumental setup that correlate to the amount of data being processed and the number of connections to the network. The setup was also designed to take into account the size and features of the space it was built in. I think that this installation is a really cool idea, something I would want to experience myself. I like how the experience of this project has the potential to meet the expectations of the subject, or to make them view big data in a new way. I agree with Kai’s assessment that this exhibit made something relatively “cold” such as data connections into something “warm” like the echoing music which was produced. I think that this project could also have the effect of making the subject feel as if they are “part of something bigger”, through the experience of literally walking within the space and experiencing something that creates a sonic collage of interconnected events which are happening in the world. I also appreciated the pleasant nature of the sound that was created – for example, the designer could have chosen to make the sounds more harsh or pointed, but this richer sound has a more welcoming and relaxing effect on the listener. I think that this choice reflects the designer’s intent with this piece.

Project 9 Liz Maday

finalfinal2

//Elizabeth Maday
//Section A
//emaday@andrew.cmu.edu
//Project 9

var theImage;

function preload() {
	theImage = loadImage("https://i.imgur.com/zBgacYu.png");
}

function setup() {
	createCanvas(400, 480);
	background(0);
	theImage.loadPixels();
	frameRate(100);
}

function draw() {
    translate(-10, -10);
    
    var x = random(width);
    var y = random(height);
    var col = theImage.get(x, y);

    stroke(col);
    var lengthmap = constrain(map(15, 0, mouseY, 0, 20), 5, 50);
    var weightmap = constrain(map(3, 0, 10, 0, mouseX/50), 0.2, 5);

    push();
    strokeWeight(weightmap);
    line(x + random(-20, 20), y + random(-10, 10), x + lengthmap, y + lengthmap);   
    pop();

    if (mouseX > width/2) {
        fill(col);
        ellipse(x, y, 2, 2);
    }
}


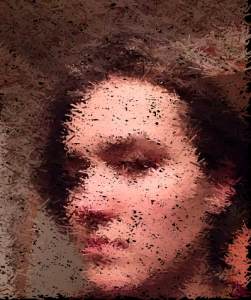
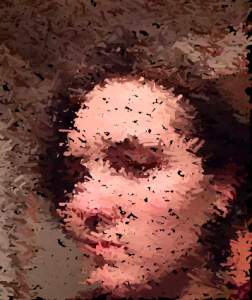
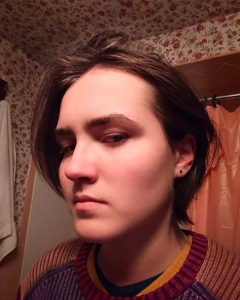
I liked working on this project because I got to see all the things that I could play around with while working in this format of altering a pre-existing image. I am interested in doing more creative things with this in the future. For this project, I used the position of the mouse to manipulate line length, strokeWeight, and whether or not ellipses are drawn.

Project 7 Liz Maday

emadayflames

//Elizabeth Maday
//Section A
//emaday@andrew.cmu.edu
//Project 7

var nPoints = 450;

//background color
var r = 0;
var g = 0;
var b = 0;
//red fire colors
var r1 = 255;
var b1 = 0;
var g1 = 0;
var r2 = 255;
var g2 = 85;
var b2 = 0;
var r3 = 255;
var g3 = 164;
var b3 = 0;
var r4 = 255;
var g4 = 204;
var b4 = 0;
//blue fire colors
var R1 = 7;
var G1 = 83;
var B1 = 130;
var R2 = 27;
var G2 = 125;
var B2 = 186;
var R3 = 73;
var G3 = 174;
var B3 = 237;
var R4 = 105;
var G4 = 185;
var B4 = 234;
//shadow colors red
var rr = 108; //inside
var gg = 22;
var bb = 0;
var rrr = 255;//outside
var ggg = 58;
var bbb = 0;
//shadow colors blue
var RR = 4; //inside
var GG = 22;
var BB = 33;
var RRR = 22; //outside
var GGG = 63;
var BBB = 89;
//water colors blue
wr = 47;
wg = 102;
wb = 191;
//water colors green
WR = 12;
WG = 201;
WB = 72;

function setup() {
	createCanvas(400, 400);
	frameRate(6);
	strokeWeight(0.7);
}

function mouseClicked() {	
	if (r1 === 255) { 
		r1 = R1;
		g1 = G1;
		b1 = B1;
		r2 = R2;
		g2 = G2;
		b2 = B2;
		r3 = R3;
		g3 = G3;
		b3 = B3;
		r4 = R4;
		g4 = G4;
		b4 = B4;
		r = 4; 
	    g = 22;
	    b = 70;
	    rr = RR;
	    gg = GG;
	    bb = BB;
	    rrr = RRR;
	    ggg = GGG;
	    bbb = BBB;
	    wr = WR;
	    wg = WG;
	    wb = WB;
	} else if (r1 === 7) { 
		r1 = 255;
		g1 = 0;
		b1 = 0;
		r2 = 255;
		g2 = 85;
		b2 = 0;
		r3 = 255;
		g3 = 164;
		b3 = 0;
		r4 = 255;
		g4 = 204;
		b4 = 0;
		r = 0;
		g = 0;
		b = 0;
		rr = 108;
		gg = 22;
		bb = 0;
		rrr = 255;
		ggg = 58;
		bbb = 0;
		wr = 47;
		wg = 102;
		wb = 191;
	}
}

function draw() {
	background(r, g, b);
	translate(200, 200);
    shadows(0, 0); 
    fire(0, 0);
    water2(0, 0);  	
    textSize(15);
    text('Click!', -170, 170);
}

function shadows(x, y) {
	translate(x, y);
	push();
    ellipseMode(CORNER);
    fill(rrr, ggg, bbb); //outside
    ellipse(-35, 5, random(125, 130), random(40, 50));
    fill(rr, gg, bb); //inside
    ellipse(-25, 5, 70, random(20, 30));
	pop();
}

function fire(x, y) {
	translate(x, y);
	beginShape();
	fill(r1, g1, b1);
	//outermost part
	for (var i = 0; i < nPoints; i += 1) {
		var num = random(1, 1.4);
		var r = num - sin(theta);
		var theta = map(i, 0, nPoints, 0, TWO_PI);
		var grow = (dist(mouseX, mouseY, width/2, height/2))/3.5;
        var x = grow * (r*cos(theta));
        var y = grow * (r*sin(theta));
        vertex(x, y);
	}
	endShape(CLOSE);
	//second to outermost part
	beginShape();
	fill(r2, g2, b2);
	for (var i = 0; i < nPoints; i += 1) {
		var num = random(0.9, 1.2);
		var r = num - sin(theta);
		var theta = map(i, 0, nPoints, 0, TWO_PI);
		var grow = (dist(mouseX, mouseY, width/2, height/2))/3.5;
        var x = grow * (r*cos(theta));
        var y = grow * (r*sin(theta));
        vertex(x, y);
	}
	endShape(CLOSE);
    //second to innermost part
	beginShape();
	fill(r3, g3, b3);
	for (var i = 0; i < nPoints; i += 1) {
		var num = random(0.6, 1);
		var r = num - sin(theta);
		var theta = map(i, 0, nPoints, 0, TWO_PI);
		var grow = (dist(mouseX, mouseY, width/2, height/2))/3.5;
        var x = grow * (r*cos(theta));
        var y = grow * (r*sin(theta));
        vertex(x, y);
	}
	endShape(CLOSE);   
    //innermost part
	beginShape();
	fill(r4, g4, b4);
	for (var i = 0; i < nPoints; i += 1) {
		var num = random(0.2, 0.5);
		var r = num - sin(theta);
		var theta = map(i, 0, nPoints, 0, TWO_PI);
		var grow = (dist(mouseX, mouseY, width/2, height/2))/3.5;
        var x = grow * (r*cos(theta));
        var y = grow * (r*sin(theta));
        vertex(x, y);
	}
	endShape(CLOSE);	
}

function water2(x, y) {
	translate(x, y);
	fill(wr, wg, wb);
	for (var i = 0; i < nPoints; i += 1) {
        var x = dist(mouseX, mouseY, width/2, height/2) * 1.2;
        var y = dist(mouseX, mouseY, width/2, height/2) * 1.2;
        var size = dist(mouseX, mouseY, width/2, height/2)/4;
		ellipse(x, y, size, size);
		push();
		fill(255);
		ellipse(x - 2, y, size - (size*0.6), size - (size*0.6));
		pop();

		var x1 = (dist(mouseX, mouseY, width/2, height/2)) * -1;
		var y1 = dist(mouseX, mouseY, width/2, height/2);
		var size1 = dist(mouseX, mouseY, width/2, height/2)/5;
		ellipse(x1, y1, size1, size1);
		push();
		fill(255);
		ellipse(x1 - 2, y1, size1 - (size1*0.6), size1 - (size1*0.6));
		pop();

		var x2 = (dist(mouseX, mouseY, width/2, height/2)) * -1.2;
		var y2 = (dist(mouseX, mouseY, width/2, height/2)) * -1.2;
		var size2 = dist(mouseX, mouseY, width/2, height/2)/4;
		ellipse(x2, y2, size2, size2);		
		push();
		fill(255);
		ellipse(x2 - 2, y2, size2 - (size2*0.6), size2 - (size2*0.6));
		pop();

		var x3 = (dist(mouseX, mouseY, width/2, height/2));
		var y3 = (dist(mouseX, mouseY, width/2, height/2)) * -1;
		var size3 = dist(mouseX, mouseY, width/2, height/2)/5;
		ellipse(x3, y3, size3, size3);	
		push();
		fill(255);
		ellipse(x3 - 2, y3, size3 - (size3*0.6), size3 - (size3*0.6));
		pop();

		var x4 = width/2;
		var y4 = (dist(mouseX, mouseY, width/2, height/2)) * -1.5;
		var size4 = dist(mouseX, mouseY, width/2, height/2)/5;
		ellipse(x4 - 200, y4, size4, size4);	
		push();
		fill(255);
		ellipse(x4 - 200, y4, size4 - (size4*0.6), size4 - (size4*0.6));
		pop();

		var x5 = width/2;
		var y5 = (dist(mouseX, mouseY, width/2, height/2)) * 1.5;
		var size5 = dist(mouseX, mouseY, width/2, height/2)/5;
		ellipse(x5 - 200, y5, size5, size5);	
		push();
		fill(255);
		ellipse(x5 - 200, y5, size5 - (size5*0.6), size5 - (size5*0.6));
		pop();
	}
}
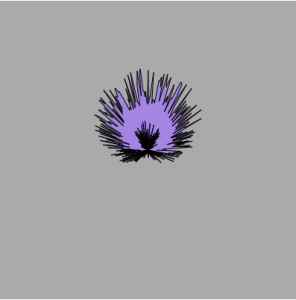


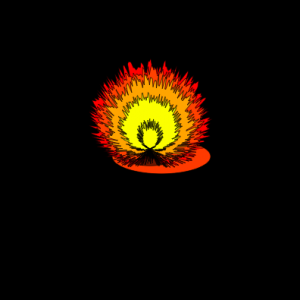
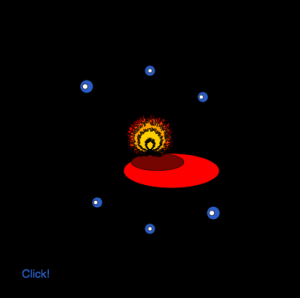
I liked working on this project because I gained a better understanding of how extensively you can use math in P5. I discovered how to make the flames by accident by randomizing one of the values in the equation of the curve. Once this happened, I was able to come up with a concept for the rest of the project. I liked working with colors and the mouseIsPressed conditional to change the image from red fire to blue fire. In the future, I would like to have a better ability to implement the map() function, as I feel that it would have been useful for my goals in this project.
LO7 Liz Maday

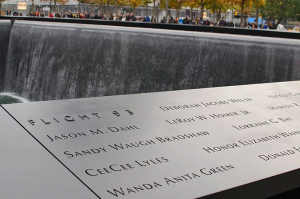
The 9/11 memorial in NYC

Jer Thorpe – 9/11 Memorial

The 9/11 memorial displays about 3,000 names inscribed into bronze panels surrounding two pools of water. The placement of these names may seem to be random, but they are actually specifically arranged according to an algorithm that was created by data artist Jer Thorpe.

The algorithm was built in Processing, and was made to accommodate requests by family members to have names meaningfully placed adjacent to other names, reflecting the relationships and connections between the victims. For example, the investment bank Cantor Fitzgerald was devastated by the attack, losing more than 700 employees and people associated with the company. On the memorial, all these names are listed together, encompassing large portion of the memorial. Even within this section, certain names are placed next to each other to indicate close relationships.

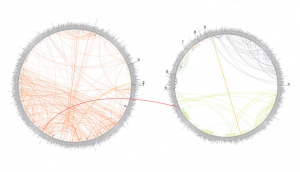
Visualization of the algorithm.

The algorithm works by first putting names into large clusters based on the adjacency requests. Then it figures out where to place these large clusters of names on the memorial, filling in the spaces.

I think this is an amazing example of how a program is able to reflect very human emotions and intentions while also utilizing a precision and complexity that is above human ability.

Project 6 Liz Maday

final liz maday 6

var r;
var g;
var b;
var array = [];
var array2 = [];
var array3 = [];

function setup() {
	createCanvas(415, 210);
}
 function draw() {
 	background('lightblue');
 	strokeWeight(1.5);
 	var s = second();
 	var m = minute();
 	var h = hour();

    //lines
    for (var i = 0; i < 7; i += 1) {
    	var space = 60;
    	var x = (i * space) + 20;
    	var y = 0;
    	line(x, y + 50, x, (y + 65));
    	array = ['0s', '10s', '20s', '30s', '40s', '50s', '60s'];
    	array2 = ['0m', '10m', '20m', '30m', '40m', '50m', '60m'];
        textSize(15);
        fill('red');
        text(array[i], x - 10, y + 20);
        fill('green');
        text(array2[i], x - 10, y + 40);
    }
    
    //second boxes
    for (var i = 0; i < s; i += 1) {
    	var x = (i * (space/10)) + 15;
    	var y = 80;

    	fill('red');
    	rect(x, y, 5, 5);

    }

    //minute boxes
    for (var i = 0; i < m; i += 1) {
    	var x = (i * (space/10)) + 15;
    	var y = 90;
    	fill('green');
    	rect(x, y, 5, 15);
    }

    //hour boxes
    for (var i = 0; i < h; i += 1) {
    	var x = (i * 10) + 15;
    	var y = 110;
    	fill('yellow');
    	rect(x, y, 10, 25);

    }

    //hour lines
    for (var i = 0; i < 5; i += 1) {
    	var space = 40;
    	var x = (i * space * 1.5) + 20;
    	var y = 150;
    	line(x, y, x, (y + 15));
    	textSize(15);
    	array3 = ['0hrs', '6hrs', '12hrs', '18hrs', '24hrs'];
    	text(array3[i], x - 10, y + 40);
    	
    }    

 }

I liked how this project made me think about how time can be efficiently displayed in a more simplistic way than a typical clock. My concept for this project had to adjust a few times, as I was still figuring out how to manipulate the time functions.

Project 5 Liz Maday

final wallpaper

function setup() {
	createCanvas(600, 600);
	strokeWeight(0.5);
}

function draw() {
	background(247, 140, 142);
	//center banana line starting left
	for (i = 0; i < 13; i += 1) {
		var startX = 25;
		var startY = 25;
		var bananaX = (startX * i * 2);
		var bananaY = (startY * i * 2);	
		banana(bananaX, bananaY);
		banana2(bananaX, bananaY);
	}
	//banana line below center line, starting left
    for (i = 0; i < 7; i += 1) {
    	var startX3 = 25;
    	var startY3 = 25;
    	var bananaX3 = startX3 * i * 2;
    	var bananaY3 = (startY3 * i * 2) + 200;
		banana(bananaX3, bananaY3);
		banana2(bananaX3, bananaY3);    	
    }
   	//2nd banana line below center line, starting left
    for (i = 0; i < 5; i += 1) {
    	var startX4 = 25;
    	var startY4 = 25;
    	var bananaX4 = startX4 * i * 2;
    	var bananaY4 = (startY4 * i * 2) + 400;
		banana(bananaX4, bananaY4);
		banana2(bananaX4, bananaY4);    	
    }
    //banana line above center line, starting left
    for (i = 0; i < 7; i += 1) {
    	var startX5 = 25;
    	var startY5 = 25;
    	var bananaX5 = (startX5 * i * 2) + 200;
    	var bananaY5 = (startY5 * i * 2);
		banana(bananaX5, bananaY5);
		banana2(bananaX5, bananaY5);    	
    }   
    //2nd banana line above center line, starting left
    for (i = 0; i < 3; i += 1) {
    	var startX6 = 25;
    	var startY6 = 25;
    	var bananaX6 = (startX6 * i * 2) + 400;
    	var bananaY6 = (startY6 * i * 2);
		banana(bananaX6, bananaY6);
		banana2(bananaX6, bananaY6);    	
    }  
	//center banana line starting right
	for (i = 0; i < 12; i += 1) {
		var startX2 = width - 100;
		var startY2 = 25;
		var bananaX2 = startX2 - (i * 25 * 2);
		var bananaY2 = startY2 * i * 2;	
		banana(bananaX2, bananaY2);
		banana2(bananaX2, bananaY2);
	}
	//banana line below center line, starting right
	for (i = 0; i < 9; i += 1) {
		var startX7 = width - 100;
		var startY7 = 25;
		var bananaX7 = (startX7 - (i * 25 * 2)) + 100;
		var bananaY7 = (startY7 * i * 2) + 100;	
		banana(bananaX7, bananaY7);
		banana2(bananaX7, bananaY7);
	}	
	//2nd banana line below center line, starting right
	for (i = 0; i < 9; i += 1) {
		var startX8 = width - 100;
		var startY8 = 25;
		var bananaX8 = (startX8 - (i * 25 * 2)) + 200;
		var bananaY8 = (startY8 * i * 2) + 200;	
		banana(bananaX8, bananaY8);
		banana2(bananaX8, bananaY8);
	}
	//banana line above center line, starting right
	for (i = 0; i < 11; i += 1) {
		var startX9 = width - 100;
		var startY9 = 25;
		var bananaX9 = (startX9 - (i * 25 * 2)) - 100;
		var bananaY9 = (startY9 * i * 2) - 100;	
		banana(bananaX9, bananaY9);
		banana2(bananaX9, bananaY9);
	}		
	//2nd banana line above center line, starting right
	for (i = 0; i < 11; i += 1) {
		var startXa = width - 100;
		var startYa = 25;
		var bananaXa = (startXa - (i * 25 * 2)) - 300;
		var bananaYa = (startYa * i * 2) - 100;	
		banana(bananaXa, bananaYa);
		banana2(bananaXa, bananaYa);
	}
	//kiwi loop
	for (x = 0; x < 7; x += 1) {
		for (y = 0; y < 8; y += 1) {
			var indent = 0;
			if (y % 2 === 0) {
                indent = 100;
			} else {
				indent = 0;
			}
			kiwi((x * 200) + indent, y * 100);
		}
	}
    //additional bananas
	banana(-50, -50);
	banana2(-50, -50);
	banana(width - 50, -50);
	banana2(width - 50, -50);
}
//banana part 1
function banana(x, y) {
    strokeWeight(0.5);
    push();
    translate(x, y);
    beginShape();
    fill(247, 190, 0);
    strokeWeight(.5);
	vertex(30, 20);
	bezierVertex(80, 20, 80, 75, 30, 75); //outer curve
	bezierVertex(50, 80, 60, 25, 30, 20); //inner curve
	endShape();
	fill(99, 66, 29);
	ellipse(30, 20, 10, 10); //banana tip
	noFill();
	strokeWeight(1);
	stroke(99, 66, 29);
	bezier(30, 20, 70, 25, 70, 65, 36, 75);//banana line
	pop();
}

//banana part 2
function banana2(x, y) { 
	push();
	translate(x, y);
	beginShape();
	fill(235, 150, 70);
	vertex(30, 20);
	bezierVertex(80, 20, 80, 75, 30, 75); //outer curve
	bezierVertex(70, 70, 70, 25, 30, 20); //inner curve
	endShape();
	pop();
}

//kiwi
function kiwi(x, y) {
	push();
	translate(x, y);
	fill(124, 83, 36);
	bezier(101 - 100, 25 - 39.5, 71 - 100, 25 - 39.5, 71 - 100, 60 - 39.5, 101 - 100, 54.5 - 39.5); //brown

	fill(120, 210, 0); 
	ellipse(0, 0, 26.5, 29.5); //green

	fill(0);
	ellipse(0, 0, 17, 14); // black

	fill(255, 228, 148); 
	ellipse(1, 0, 15, 10); //beige
	pop();
}


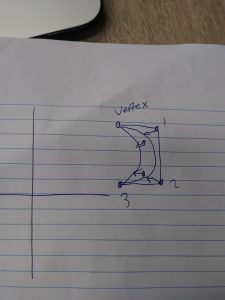
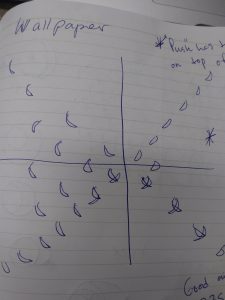
I really enjoyed doing this project because of the simple premise, but how rewarding it was to see the iteration of a simple design. I experimented more than I had in the past with making shapes look three dimensional (using different colors to indicate shadow for the bananas, using bezier to make the partial profile of the kiwi). I also enjoyed finding the colors that matched what I was seeing in my head. I was glad to have had a basic understanding of how modulus works in creating this project.