Shirley Chen-Project-07-Curves

sketch

// Shirley Chen
// Section B
// junfanc@andrew.cmu.edu
// Project-07


function setup(){
	createCanvas(480, 480);
	angleMode(DEGREES);
}

function draw(){
	background(242, 186, 176);
	curveA();
	curveB();
}

function curveA(){
//Create the Fixed-Position Astroid Curve
    noFill();
    beginShape();
    var col = mouseX * 0.3;
    stroke(221, 127, col);
    translate(100, 200);
    for (var i = 0; i < mouseX/2; i ++){ 
//The Number of Curves Will Change According to MouseX
        LimitedMouseX = constrain(mouseX, 0, width);
        var cons = map(LimitedMouseX, 0, width, 10, 100); 
//The Angle Will Change According to MouseX
        var theAngle = map(i, 0, mouseX, 20, 360);
        var x = 2 * cons * cos(theAngle) + cons * cos(2 * theAngle);
        var y = 2 * cons * sin(theAngle) - cons * sin(2 * theAngle);
        vertex(x, y);
    endShape();
//Rotate The Curves According to MouseX
    rotate(mouseX); 
    }
}


function curveB(){
//Create the Moving Astroid Curve
    noFill();
    beginShape();
    var col = mouseY * 0.5;
    stroke(col, col, 110);
    translate(150, 200);
    for (var i = 0; i < mouseY*0.7; i ++){ 
//The Number of Curves Will Change According to MouseY
        LimitedMouseY = constrain(mouseY, 0, height);
        var cons = map(LimitedMouseY, 0, width, 10, 100); 
//The Angle Will Change According to MouseY
        var theAngle = map(i, 0, mouseY, 20, 360);
        var x = 2 * cons * cos(theAngle) + cons * cos(2 * theAngle);
        var y = 2 * cons * sin(theAngle) - cons * sin(2 * theAngle);
        vertex(x, y);
    endShape();
//Rotate The Entire Astroid Curve According to MouseY
    rotate(mouseY); 
    }
}

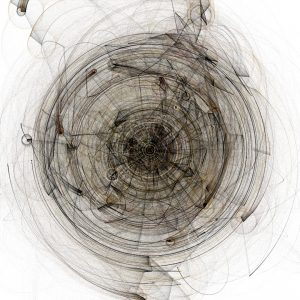
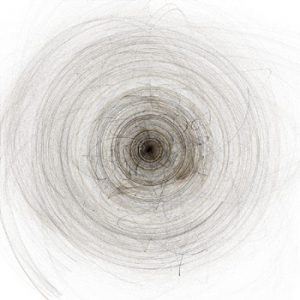
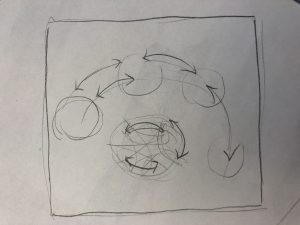
In This Project, I created a set of stable astroid curve at a fixed position and a movable set of astroid curve that keeps rotating around a center point. For the fixed set of astroid curves, the number of curves and the angle are based on the position of mouse X; for the movable set of curves, the number of curves and the angle are based on the position of mouse Y. Therefore, I used map and constrain command to limit my X and Y positions. Moreover, the colors are also changed according to the mouse X and Y. For the fixed-position set of curves, the curves inside the set is rotating according to the mouse X. For the movable set of curves, the curves inside the set and the set itself are both rotating according to the position of Y.
Shirley Chen-Looking Outwards-07

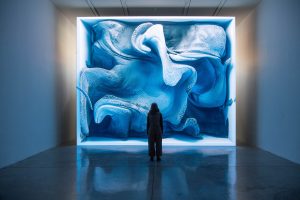
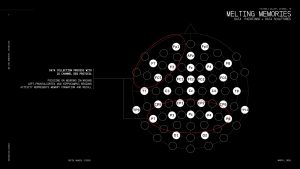
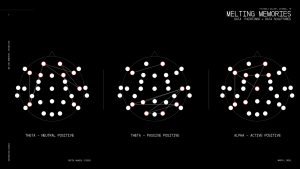
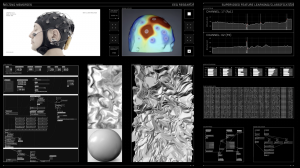
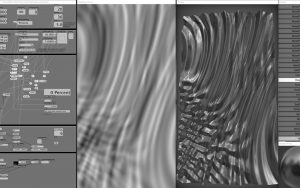
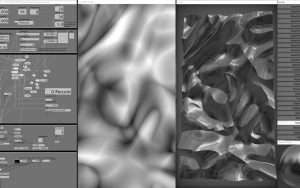
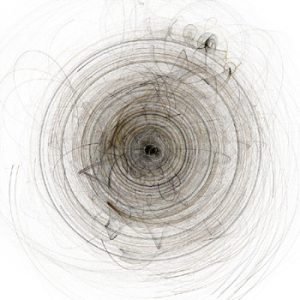
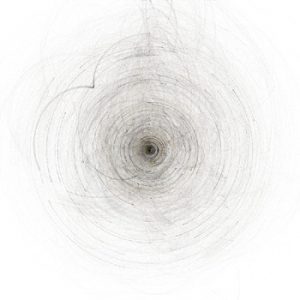
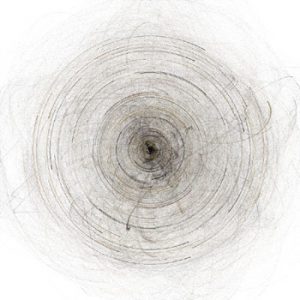
This project, called “Melting Memories”, is a series of digital artworks that create visual representation for EEG data collected on the neural mechanisms of cognitive control created by Refik Anadol Studio. It aims to explore materiality of remembering. Using computational method, this project allow the viewers to experience the aesthetic interpretation of motor movements inside human brain. The artist collects data on the neural mechanisms of cognitive control from an electroencephalogram, which measures the changes in brain wave as the result of activity and provides evidence for the function of brain.
The data is collected by instructing the participants to focus on specific childhood memories during the recording process. And the team transposes the EEG data t into procedural noise to generate aesthetic structures. This project is intriguing because the artists used computational method to collect and represent sets of abstract data relating to memories. With new technology and perspectives of exploring arts, the artists tried to visualize something that is intangible and vague. It provides the viewers with new perspectives and ways to learn the brain activity and also forms connections between the viewers and the artwork because the artwork is actually depicting the activity in human brain.


“Melting Memories” Project Created by Refol Amadol Studio

EGG Data Collection 

Visualizing EGG Data 


https://www.creativeapplications.net/vvvv/melting-memories-drawing-neural-mechanisms-of-cognitive-control/


Shirley Chen-Project-06-Abstract Clock

sketch

// Shirley Chen
// Section B
// junfanc@andrew.cmu.edu
// Project 06


var xS = []; //Create List for Second Count
var yS = [];
var xM = []; //Create List for Minute Count
var yM = [];
var xH = []; //Create List for Hour Count
var yH = [];
var dxS = []; // Velocity in x Direction for Second Bubbles
var dyS = []; // Velocity in y Direction for Second Bubbles
var dxM = []; 
var dyM = []; 
var dxH = []; 
var dyH = []; 

function setup() {
    createCanvas(400, 400);  
// Randomly Assign Position and Velocity for Second Bubbles
  for (var i = 1; i < 61; i++) { 
        xS[i] = random(100, 300);
        yS[i] = random(10, 300);
        dxS[i] = random(-5, 5);
        dyS[i] = random(-5, 5);
    }
//Randomly Assign Position and Velocity for Minute Bubbles  
    for (var i = 1; i < 61; i++) { 
        xM[i] = random(100, 300);
        yM[i] = random(20, 300);
        dxM[i] = random(-5, 5);
        dyM[i] = random(-5, 5);
    }
//Randomly Assign Position and Velocity for Hour Bubbles
    for (var i = 1; i < 25; i++) { 
        xH[i] = random(30, 400);
        yH[i] = random(30, 300);
        dxH[i] = random(-5, 8);
        dyH[i] = random(-5, 8);
    }
}

function draw() {
  var H = hour();
  var M = minute();
  var S = second();
  var cirC = [];
  var colR = 100;
  var colG = 150;
  var colB = 255;
  var launcherLength1 = 80;
  var launcherLength2 = 90;
  background(241, 223, 224);
  frameRate(8);
  noStroke();
  fill(148, 134, 186);
//Draw the Launcher
  ellipse(40, 350, 70, 70); 
  quad(60, 330, launcherLength1, 320, launcherLength2, 350, 60, 380);
//Constrain the Hours to 0 - 12
  if (H >= 12){
    H = H % 12
  }

  for (var i = 1; i < S+1; i++) { 
//Draw one Small Bubble for Every Second
//Color Become Darker for Each Bubble
    colR += 10;
    fill(colR, 183, 205);
    ellipse(xS[i], yS[i], 10);
    xS[i] += dxS[i];
    yS[i] += dyS[i];
    if (xS[i] + 10 > width || xS[i] - 10 < 90){
      dxS[i] = - dxS[i];
    }
    if (yS[i] + 10 > height || yS[i] - 10 < 1){
      dyS[i] = - dyS[i];
    }
    if (S % 2 == 0){
      fill(148, 134, 186);
      quad(60, 330, launcherLength1+10, 310, launcherLength2+10, 340, 60, 380);
//Make the Launcher Move Its "Mouth" for Every Second  
    }
  }
  for (var i = 1; i < M+1; i++) { 
//Draw one Midium Bubble for Every Minute
//Color Become Darker for Each Bubble
    colG -= 10;
    fill(255, colG, colG);
    ellipse(xM[i], yM[i], 20);
    xM[i] += dxM[i];
    yM[i] += dyM[i];
    if (xM[i] + 20 > width || xM[i] - 20 < 90){
      dxM[i] = - dxM[i];
    }
    if (yM[i] + 20 > height || yM[i] - 20 < 1){
      dyM[i] = - dyM[i];
    }
  }
  for (var i = 1; i < H+1; i++) {
//Draw one Large Bubble for Every Hour
//Color Become Darker for Each Bubble
    colB -= 60;
    fill(255, 200, colB);
    ellipse(xH[i], yH[i], 30);
    xH[i] += dxH[i];
    yH[i] += dyH[i];
    if (xH[i] + 30 > width || xH[i] - 30 < 0){
      dxH[i] = - dxH[i];
    }
    if (yH[i] + 30 > height || yH[i] - 30 < 0){
      dyH[i] = - dyH[i];
    }
  }
//Draw the Stand for the Bubble Launcher
fill(252, 205, 86);
rect(30, 355, 30, 40, 10, 10);
fill(249, 133, 133);
text('BOOM!', 30, 300);
}

For this project, I represent second, minute, and hour with bubbles with different sizes and colors. Using the for loop command, for each second there is a new small bubble coming up. I also change the RGB parameter gradually for each second, so the second bubble will change from blue to purple as time passing. Similarly, I also use for loop command to represent minute and hour with bubbles with different diameters. Moreover, I draw a “launcher” and control its outlet to contract or extend for each change in second. For odd number of seconds, its “mouth” will contract; for even number of seconds, it will extend. I also constrain the movement of the bubbles so that they bounce back when they hit the boundary.

Shirley Chen-Looking Outwards-06

Orbital is a project generated by J. Tarbell using computational method. It is composed of a random collection of particles operating on one single rule: randomly choose another particle in the system and orbit it with a constant radius and same velocity. From the beginning, there is one single root particle instantiating at the center of the canvas, and then all other particles brought into the system fall into orbit at some level.

Looking at Orbital System From Far Away

The particles initially start with a fast velocity. Gradully they slow down so their position, orbit path, and connection can be clearly represented.

System of 500 Orbital Elements Exposed over 400 Years

System of 500 Orbital Elements Exposed over 400 Years

system of 500 orbital elements exposed over 400 years

system of 500 orbital elements exposed over 400 years

This project is interesting and demonstrate the role of randomness played in computational art. Although the selection of particles and the position of orbit generated are random, the one basic rule that is not changed is that the orbitals have a constant radius. Overtime, various patterns and shapes can be created and such randomness allows more space for creativity and visual representation. Randomness itself, when combines with time, might be able to generate many unexpected results.

http://www.complexification.net/gallery/machines/orbitals/indexB.php

Shirley Chen – Project – 05 – Wallpaper

sketch

// Shirley Chen
// Section B
// junfanc@andrew.cmu.edu
// Project-05


function setup() {
  createCanvas(600, 450);
  noStroke();
}
 
function draw() {
  background(255, 230, 178);
  noLoop();
  
//Draw the background dots pattern
  for (var y = 30; y < 450; y += 50) {
    for (var x = 30; x < 600; x += 50) {
      fill(137, 188, 157);
      ellipse(x, y, 4, 4);
    }
  }

//Draw the background orangle line pattern
  for (var y = 50; y < 450; y += 120) {
    for (var x = 50; x < 600; x += 120) {
      strokeWeight(4);
      stroke(252, 155, 85);
      line(x, y, x+4, y+2);
    }
  }
  
//Draw the background blue line pattern
  for (var y = 10; y < 450; y += 60) {
    for (var x = 20; x < 600; x += 200) {
      strokeWeight(2);
      stroke(129, 182, 211);
      line(x+5, y, x, y+7);
    }
  }

//Draw grid for the smiling watermelon
  for (var y = 0; y < 450; y += 80) {
    for (var x = 0; x < 600; x += 200) {
      noStroke();
      push();
      translate(x, y);
      drawMellon();
      pop();
    }
  }

//Draw grid for the screaming watermelon
  for (var y = 0; y < 450; y += 100){
    for (var x = 100; x < 600; x += 200){
      push();
      translate(x, y);
      drawTiltedMellon();
      pop();
    }
  }
}


function drawMellon(){
//Draw the skin of the watermelon
    fill(86, 135, 109);
    arc(50, 50, 60, 60, 0.2*PI, 0.45*PI);
//Draw the fruit of the watermellon
    fill(226, 133, 143);
    arc(50, 50, 50, 50, 0.2*PI, 0.45*PI);
//Drawing the face for the smiling watermellon
    stroke(6);
    strokeWeight(2);
    line(52, 58, 54, 62);
    line(56, 55, 60, 59);
    noFill();
    strokeWeight(1);
    arc(50, 50, 40, 40, 0.3*PI, 0.4*PI)


}

function drawTiltedMellon(){
//Draw the skin of the watermelon
    fill(86, 135, 109);
    arc(50, 50, 80, 80, 0.5*PI, 0.75*PI);
//Draw the fruit of the watermelon
    fill(226, 133, 143);
    arc(50, 50, 70, 70, 0.5*PI, 0.75*PI);
//Drawing the face for the screaming watermelon
    stroke(6);
    strokeWeight(2);
    line(40, 56, 43, 60);
    line(39, 62, 43, 60);
    line(50, 58, 46, 60);
    line(50, 62, 46, 60);
    fill(216, 55, 49);
    strokeWeight(1);
    ellipse(45, 70, 5, 10);
    noFill();
    strokeWeight(1);
    arc(45, 50, 40, 40, 0.3*PI, 0.4*PI)
    arc(50, 40, 50, 80, 0.5*PI, 0.65*PI)
}

For this wallpaper project, I created two variation of watermelon, smiling watermelon and screaming watermelon. I used the “for” loop command to create two sets of grid to define the position of the watermelon. And I add two kinds of faces on the watermelon. For the background, I also used “for” loop to add dot and line pattern with different color and stroke weight. In general, this project is very fun to work with and helps me get more practice on the “for” loop command.

Shirley Chen – Looking Outward -05

The advancement in technology has made 3D graphic easier to be produced and popular as a new type of art. With the increasingly appearing 3D graphic arts, both the viewers and artists are given a innovative way of thinking art that is beyond the 2D constrain. 3D graphics usually creates a feeling of future and represents surrealism. This new way of creating art inspires a Vienna-based artist, Bianka Oravecz, to generate 3D arts including globular-looking masses, crystalline, geological, and abstract forms. She just transitioned to three-dimensional art this year, after eight years of working with two-dimensional graphic design.

Working with three-dimensional art, Oravecz mainly focuses on issues including technology, female identity, and biology. She also explores micro and macro worlds, virtual fields, and landscapes. For her, playing with forms and shapes in 3D graphic can convey the “falling apart of meanings”. She wants to create innovative, never-before-seen imagery, and explore the mixture of physical and virtual.

Three Dimensional Image Created by Bianka Oravecz

Shirley Chen – Project 04 – String Art

sketch

// Shirley Chen
// Section B
// junfanc@andrew.cmu.edu
// Project-04


function setup() {
    createCanvas(400, 300);
    background(244, 217, 166);

}

function draw() {
    var x1 = 0;
    var y1 = 0;
    var x2 = 0;
    var x3 = 0;
    var y3 = 0;

    strokeWeight(1);
    //Draw the blue lines at the bottom left corner
    for (var i = 0; i < 50; i++){
        y1 += 4;
        x1 += 8;
        stroke(166, 188, 201);
        line(0, y1, x1, height);
    }
    //Draw the yellow and pink lines at the upper left and right corner
    for (var i = 0; i < 50; i++){
        x2 += 20;
        x3 += 5;
        y3 += 5;
        stroke(242, 143, 143);
        line(400, 0, x2, height);
        stroke(255, 191, 62);
        line(x3, 0, x3, y3);
    }
    strokeWeight(1);
    stroke(86, 42, 42);
    //Draw lines between points along the circles to create eyes
    for(var i = 0; i < 360; i += 10){
        line( width * 0.2 + 20 * cos(radians(i)), 
              height * 0.4 - 20 * sin(radians(i)),
              width * 0.2 - 20 * cos(radians(i)),
              height * 0.4 - 20 * sin(radians(i)));
    }
    for(var i = 0; i < 360; i += 10){
        line( width * 0.5 + 20 * cos(radians(i)), 
              height * 0.4 - 20 * sin(radians(i)),
              width * 0.5 - 20 * cos(radians(i)),
              height * 0.4 - 20 * sin(radians(i)));
    }
    stroke(0);
    for(var i = 0; i < 360; i += 10){
        line( width * 0.2 + 5 * cos(radians(i)), 
              height * 0.4 - 5 * sin(radians(i)),
              width * 0.2 - 5 * cos(radians(i)),
              height * 0.4 - 5 * sin(radians(i)));
    }
    for(var i = 0; i < 360; i += 10){
        line( width * 0.5 + 5 * cos(radians(i)), 
              height * 0.4 - 5 * sin(radians(i)),
              width * 0.5 - 5 * cos(radians(i)),
              height * 0.4 - 5 * sin(radians(i)));
    }
    strokeWeight(2);
    stroke(214, 29, 29);
    //Draw the mouth by connectiing points on the ellipse
    for(var i = 0; i < 360; i += 10){
        line( width / 2.5 + 30 * cos(radians(i)), 
              height / 1.5 - 30 * sin(radians(i)),
              width / 3.5 - 30 * cos(radians(i)),
              height/ 1.5 - 30 * sin(radians(i)));
    }
}

For this project, I use the “for” loop to map out all the points on different lines and connect them together. When I drew the circles that are constructed by lines, I need to use cos and sine to calculate each point on the circle and then connect them together. The circles eventually form a face. Overall, I feel comfortable with the looping function.

Shirley Chen – Looking Outward 04

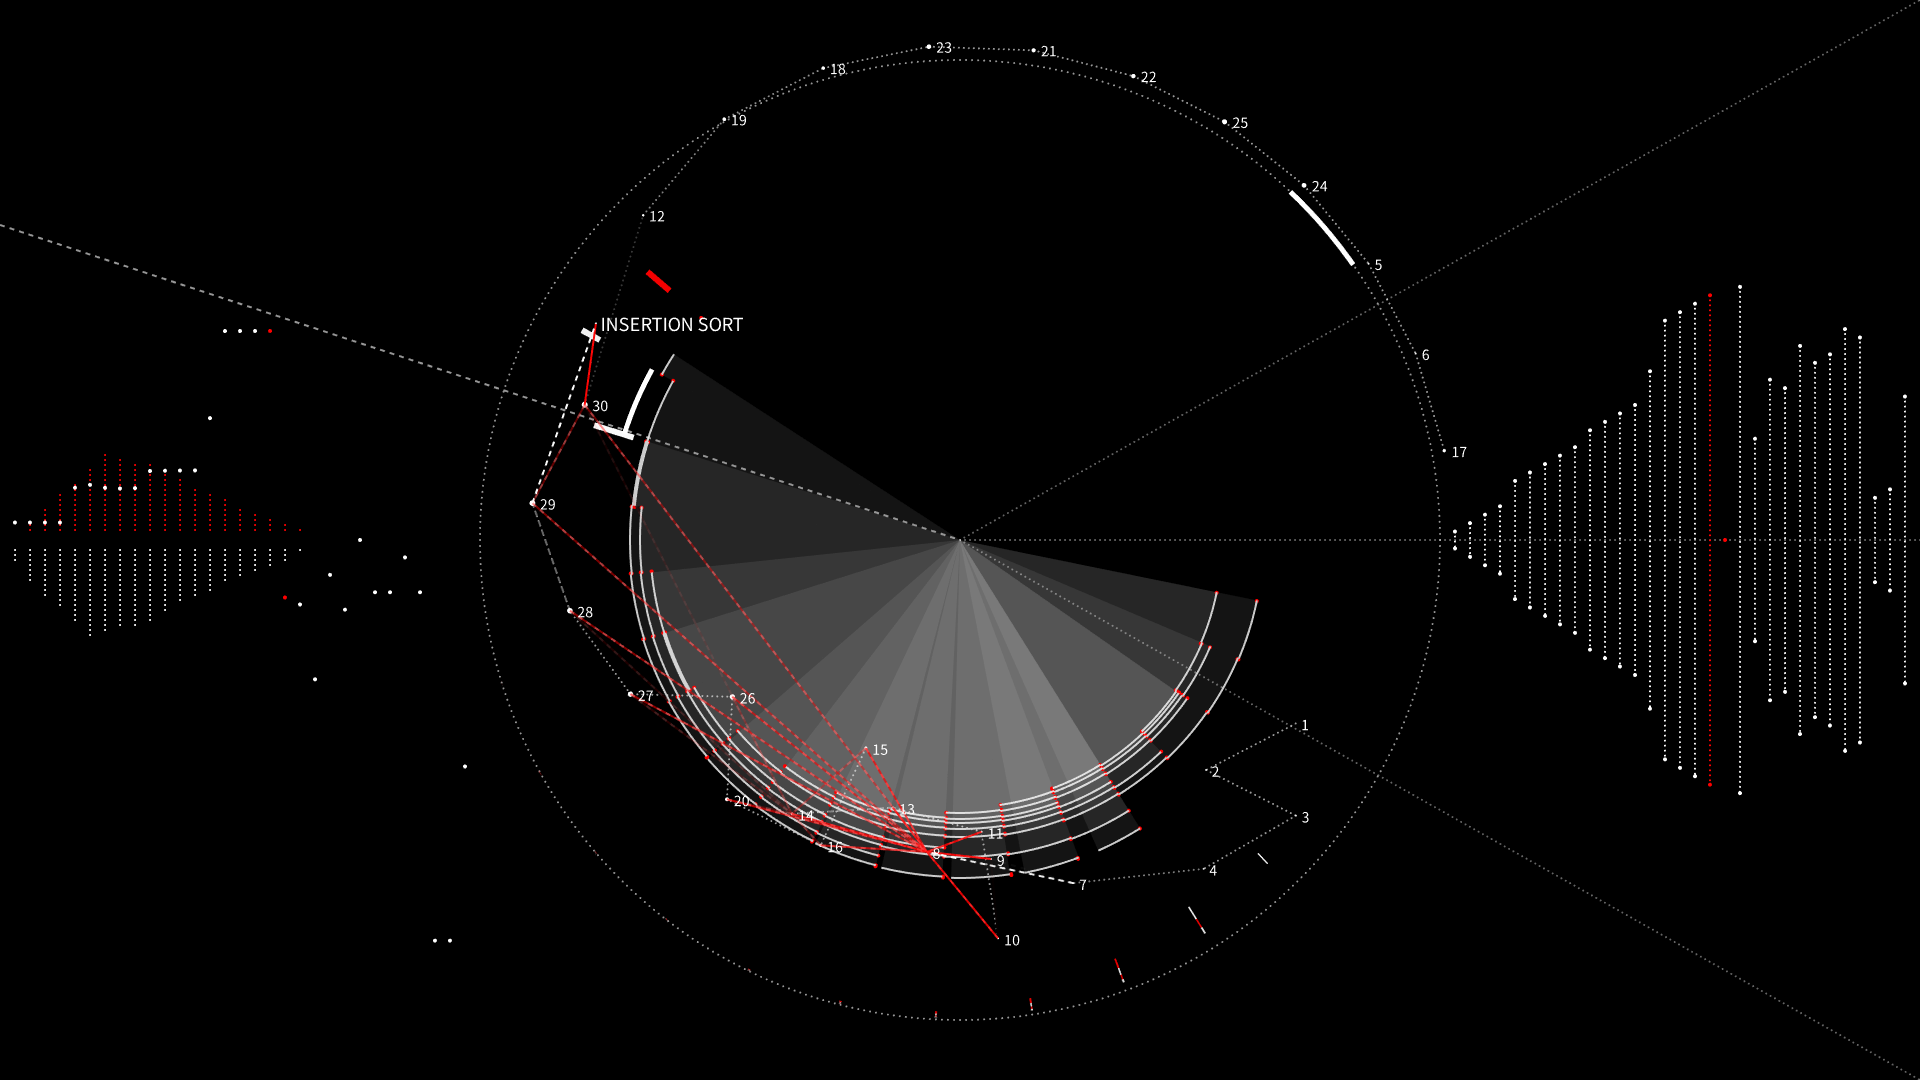
Sorting is a project that generates algorithm visualization and sonification by Ren Yuan. This project makes the sorting history, data comparison, data swap,absolute error, residual sum of squares and other features visible and audible by using computer programming.  There are seven sorting algorithms to make this algorithm visualization and sonification: insertion sort, shell sort, bubble sort, quick sort, selection sort, heap sort, and merge sort.  The problem size of all sorting algorithms is 31, and the initial condition is random.

This project are very attractive to me because it visualizes the abstract computing features, picturing such invisible process of the computer directly. It even generates the sound based on the operation of these features, enhancing the visibility and concretization of the computing process. Moreover, by using certain algorithm, these features generate various, dynamic, and aesthetic patterns, shapes, and motions that can be inspirations for many artistic fields such as architecture and fine arts. Various sound that are generated by this project can be manipulated to be soundtrack for specific purposes such as using in Electronic Dance Music(EDM).  The visual representation combining with the sonification work perfectly to produce the visual and audio effects to the audience.


http://www.creativeapplications.net/processing/sorting-visualisation-sortification-and-sonification-of-an-algorithm/

Algorithm Visualization through Sorting


SORTING from Ren Yuan on Vimeo.

Shirley Chen – Project 03 – Dynamic Drawing

sketch

// Shirley Chen
// Section B
// junfanc@andrew.cmu.edu
// Project-03


var X = 10;
var Y = 10;
var d;
var m;
var radius = 0;
var shade = 0;
var side = 0;

function setup() {
    createCanvas(640, 480);

}

function draw() {
    background(253, 224, 146);
//Make a Grid
    for (i = 0; i < 24; i++){
        for (j = 0; j < 32; j++){
            X = 20 * j + 10
            Y = 20 * i + 10;
//Divide the Coordinate into Four Quadrants
//The Radius of Circles in the First Quadrant Changes According to the Distance Between Mouse and Center of the Circle
//The Color of the Circle Changes According to the Distance Between Mouse and Center of the Circle
        if (mouseX > 0 & mouseX < 320 && mouseY > 0 && mouseY < 240){
                d = dist(mouseX, mouseY, X, Y)
                m = map(d, 0, 786, 0, 20);
                shade = m * 0.5 + 200;
                radius = 20 - m;
                noStroke();
                fill(shade, 137, shade);
                ellipse(X, Y, radius, radius);
            }
//The Length of Side of the Square in the Second Quadrant Changes According to the Distance Between Mouse and Center of the Sqaures
//The Color of the Sqaures Changes According to the Distance Between Mouse and Center of the Squares
            else if  (mouseX > 320 & mouseX < 640 && mouseY > 0 && mouseY < 240){
                d = dist(mouseX, mouseY, X, Y)
                m = map(d, 0, 786, 0, 20);
                side = m + 10;
                shade = m + 200;
                noStroke();
                fill(223, shade, 138);
                rectMode(CENTER);
                rect(X, Y, side, side);
            }
//The Length of Side of the Rectangles in the Second Quadrant Changes According to the Distance Between Mouse and Center of the Rectangles
//The Color of the Rectangles Changes According to the Distance Between Mouse and Center of the Rectangles
            else if  (mouseX > 0 & mouseX < 320 && mouseY > 240 && mouseY < 480){
                d = dist(mouseX, mouseY, X, Y)
                m = map(d, 0, 786, 0, 20);
                side = m * 0.3 + 18;
                shade = m * 7 + 50;
                noStroke();
                fill(231, 100, shade);
                rectMode(CENTER);
                rect(X, Y, side + 3, side);
            }
//The Size of the Geometry Changes According to the Distance Between Mouse and Center of the Geometry
//The Color of the Geometry Changes According to the Distance Between Mouse and Center of the Geometry
            else if  (mouseX > 320 & mouseX < 640 && mouseY > 240 && mouseY < 480){
                d = dist(mouseX, mouseY, X, Y);
                m = map(d, 0, 786, 0, 20);
                side = m * 0.8 + 2;
                shade = m * 3 + 8;
                noStroke();
                fill(167, 88, shade);
                rectMode(CENTER);
                rect(X, Y, side, side, 1, 8);
            } 
//When the Mouse is not On Canvas, Text Will Show Up
            else {
                fill(89, 134, 189);
                text('PLACE THE MOUSE HERE!', 235, 240);
            }
        }
    }
}

In this assignment, I was inspired by the parametric design that I researched for the Looking Outward Assignment. Controlling by the position of the mouse, some variables like radius, color, size, shape will change accordingly. It creates interesting visual effect that when the mouse gets closer to a geometry, the geometry gets smaller. I practiced the looping command that I learned from other class.

Shirley Chen – Looking Outward – 03

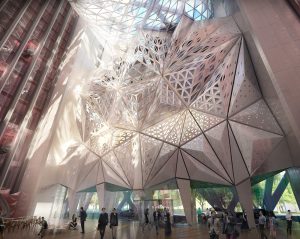
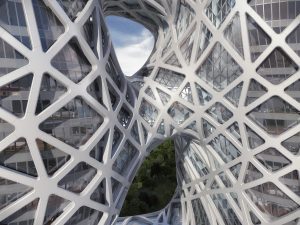
“City of Dream” Hotel Tower is a newly-built project by Zaha Hadid Architects. It is a 40-story luxury hotel in Macau. Exposing its exoskeleton mesh structure, it is perceived as a “sculptural element”. This hotel contain two towers which are connected at the podium and roof level with two very organic bridge, forming a external void. Zaha Hadid Architects’ projects usually are in organic, bold, and expressive form. “The tower’s exposed exoskeleton reinforces the dynamism of the design. Expressive and powerful, this external structure optimizes the interior layouts and envelops the building, further defining its formal composition and establishing relationships with the new Cotai strip,” described ZHA in a press release.
Architects: Zaha Hadid
Architects Location: Cotai, Macau Design Zaha Hadid & Patrik Schumacher
Project Directors: Viviana Muscettola, Michele Pasca di Magliano Facade Director Paolo Matteuzzi
Project Architects: Maria Loreto Flores, Clara Martins, Michele Salvi
Project Team: Pierandrea Angius, Luis Miguel Samanez, Massimo Napoleoni, Bianca Cheung, Miron Mutyaba, Milind Khade, Stefano Lacopini Davide, Del Giudice Luciano, Letteriello Cyril Manyara, Alvin Triestanto, Muhammed Shameel, Goswin Rothenthal, Santiago Fernandez- Achury Concept Team: Viviana Muscettola, Tiago Correia, Clara Martins, Loreto Flores, Victor Orive, Danilo Arsic, Ines Fontoura, Fabiano Costinanza, Rafael Gonzalez, Muhammed Shameel
Developer: Melco Crown Entertainment Limited
This work is very impressive that the architect exposes its skeleton directly and also embraces a boldly expressive form which requires huge efforts in the construction process. In the stage of developing process, parametric digital modeling played an essential role in the design. By repeating and varying one module, the architect creates an amazing huge-scale appearance of the building.


Lobby Atrium. Image © Zaha Hadid Architects; 2014 Melco Crown Entertainment Limited


Facade Detail. Image © Zaha Hadid Architects; 2014 Melco Crown Entertainment Limited

http://
Visual Tour for “City of Dream” Hotel Tower