var nPoints = 300;
var angle = 0;

function setup() {
    createCanvas(480, 480);
}

function draw() {
    background(175, 110, 235); // resets background every time draw is called so only one curve shows

    push();
    translate(mouseX, mouseY); // center of curve follows mouse
    rotate(radians(angle)); // rotates on center of curve
    drawEightCurve(); // draws curve
    pop();

    angle = angle + 3.5; // speed of rotation
}

// http://mathworld.wolfram.com/ConicalSpiral.html
function drawEightCurve() {
    var x;
    var y;
    var r;

    var a = constrain(mouseX, width / 6, width / 2.2);

    fill(60, 20, 35);
    stroke(160, 15, 90);
    strokeWeight(5);

    beginShape();
    for (var i = 0; i < nPoints; i++) {
        var t = map(i, 0, nPoints, 0, TWO_PI);
        r = - a * cos(3 * t);
        x = r * cos(t);
        y = r * sin(t);
        vertex(x, y);
    }
    endShape(CLOSE);
}
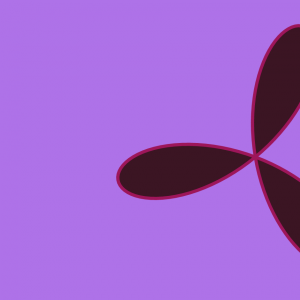
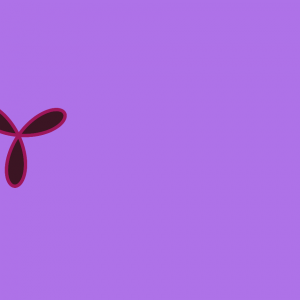
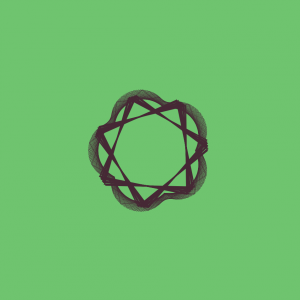
I first went to the Mathworld curves site and found the trifolium curve. It reminded me of a fidget spinner and so I got inspired to create one using this curve. As a result, I created a function (drawTrifolium()) that would draw the trifolium curve and, to do this, I used the polar equation from the site. Within the function, I made the “a” variable dependent on my mouseX movement. This changes the size of the fidget spinner as mouseX decreases or increases. Then, within the draw() function, I called drawTrifolium() and translated it so that the center of the fidget spinner would be wherever my mouse (mouseX and mouseY) is. Below are two pictures of the minimum and maximum size of the fidget spinner.
// Catherine Coyle
// ccoyle@andrew.cmu.edu
// Section C
// Project 7  - Curves

// equations taken from http://mathworld.wolfram.com/Hypotrochoid.html

var n = 1;
var h = 2;
var t = 1;
var a;
var b;

function setup() {
    createCanvas(480,480);
}

function draw() {
    background(226, 237, 255);
    // number of 'rotations' is dependent on y
    n = map(mouseY, 0, height, .9, 1.1);
    // size of rotation circles is dependent on x
    h = map(mouseX, 0, width, 2, 4);
    // smaller helper functions below here
    a = aCalc();
    b = bCalc();
    drawHypotochroidShadow(t, a, b);
    drawHypotochroid(t, a, b);
}

// i broke a lot of the heavy math parts into smaller functions
// to make it more manageable
function aCalc() {
    return(2 * n * h / (n + 1));
}

function bCalc() {
    return(((n - 1) * h) / (n + 1));
}

function xPar(t, a, b) {
    var answer = (a - b) * cos(radians(t));
    var cosVal = ((a - b) / b) * t;
    answer = answer + h * cos(radians(cosVal));
    return answer;
}

function yPar(t, a, b) {
    var answer = (a - b) * sin(radians(t));
    var cosVal = ((a - b) / b) * t;
    answer = answer + h * sin(radians(cosVal));
    return answer
}

function drawHypotochroid(t, a, b) {
    stroke(193, 124, 124);
    noFill();
    // loops through entire curve and plot every point
    beginShape();
    for(var i = 0; i < width; i++){
        var x = map(xPar(i, a, b), -4, 4, 0, width);
        var y = map(yPar(i, a, b), -4, 4, 0, height);
        curveVertex(x, y);
    }
    endShape();
}

// same as above but with some offset just to look cool
function drawHypotochroidShadow(t, a, b) {
    stroke(66, 134, 244, 50);
    noFill();
    // loops through entire curve and plot every point
    beginShape();
    for(var i = 0; i < width; i++){
        var x = map(xPar(i, a, b), -4, 4, 0, width);
        var y = map(yPar(i, a, b), -4, 4, 0, height);
        curveVertex(x-4, y-4);
    }
    endShape();
}
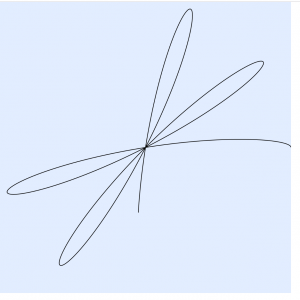
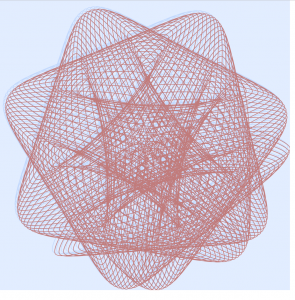
This project was kind of hard to get started with but once I wrapped my head around it I found it very cool.
I probably spent a good hour on the mathworld website trying to settle on a curve, but found that a lot of them were too hard to implement. I decided to go with the hypotrochoid shape found here.
If you keep your mouse on the left end of the screen, the curve should stay within the canvas if you want to see an entire design. Otherwise, moving your mouse to the right will kind of ‘zoom in’ to the center of the curve.
It took a lot of experimenting and trial and error to make the program work right, but in the end it produced some nice results.
The really early stages of the program when I first started to connect verticesAn interesting design that I found in the program at the end.
/* Jenni Lee
Section E
jennife5@andrew.cmu.edu
Project - 07
*/


var a = 60;

var r = 255,
  g = 0,
  b = 0;

var curveType = 0; // draw different curve type depending on mouse click

function setup() {
  createCanvas(480, 480);
  frameRate(15);
  angleMode(RADIANS);
}

function draw() {

  background(255);
  if (curveType == 0) {
    drawEpitrochoidCurves();
  } else {
    drawHypocycloidPedalCurve();
  }
}

function drawEpitrochoidCurves() {

  a = map(mouseX, 0, width, 20, 120); // a is the radius of the inner circle
  a = constrain(a, 20, 120);
  var ratioB = floor(map(mouseY, 0, height, 2, 20)); // randomize ratioB to get
  //inner circle radius when mouse pressed
  var ratioH = floor(map(mouseY, 0, height, 1, 6)); // randomize ratioH to get
  //crossing radius when mouse pressed

  var b = a / ratioB;
  var h = ratioH * b;

  var t = 0.0;
  stroke(r, g, b);
  strokeWeight(2);
  beginShape(LINES);
  for (var i = 0; i < 1600; i++) {
    var x = (a + b) * cos(t) - h * cos((a + b) * t / b);
    var y = (a + b) * sin(t) - h * sin((a + b) * t / b);
    vertex(x + width / 2, y + height / 2);
    t += 0.008;
  }
  endShape();
}

function drawHypocycloidPedalCurve() {
  a = map(mouseX, 0, width, 20, 240); // a is the radius of the inner circle,
  //depending on mouseX position
  a = constrain(a, 20, 240);
  var t = 0.0;
  var n = floor(map(mouseY, 0, height, 3, 24)); // # of paddles, from 3 to 24
  //depending on mouseY position
  n = constrain (n, 3, 24);
  beginShape(LINES);
  stroke(0, 0, 0);
  strokeWeight(2);
  for (var i = 0; i < 1600; i++) {
    var x = a * ((n - 1) * cos(t) + cos((n - 1) * t)) / n;
    var y = a * ((n - 1) * sin(t) - sin((n - 1) * t)) / n;
    vertex(x + width / 2, y + height / 2);
    t += 0.008;
  }
  endShape();

  stroke(r, g, b);
  strokeWeight(2);
  beginShape(LINES);
  for (var i = 0; i < 2000; i++) {
    var x = a * (n - 2) * (cos(t) - cos((1 - n) * t)) / (2 * n);
    var y = a * (n - 2) * cos(t * (1 - n / 2)) * sin(n * t / 2) / n;
    vertex(x + width / 2, y + height / 2);
    t += 0.008;
  }
  endShape();
}

function mousePressed() {
  curveType = 1 - curveType;
  r = random(0, 255);
  g = random(0, 255);
  b = random(0, 255);
}

// first curve:
// Epitrochoid curves/equation
// http://mathworld.wolfram.com/Epitrochoid.html
// x	=	(a+b)cos(t)-h*cos((a+b)/b*t)
// y	=	(a+b)sin(t)-h*sin((a+b)/b*t)

// second curve:
// Hypocycloid Pedal Curve
// http://mathworld.wolfram.com/HypocycloidPedalCurve.html
/*
The pedal curve for an n-cusped hypocycloid

x	=	a((n-1)cost+cos[(n-1)t])/n
y	=	a((n-1)sint-sin[(n-1)t])/n

with pedal point at the origin is the curve

x_p	=	a((n-2){cost-cos[(1-n)t]})/(2n)
y_p	=	a((n-2)cos[t(1-1/2n)]sin(1/2nt))/n.
*/
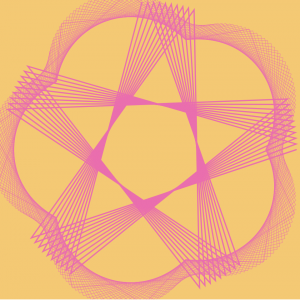
This project was entertaining for me because I enjoy browsing/analyzing the artwork of other artists/designers, so implementing different curves created by others was really fun. I used the curves/equation for the epitrochoid and the hypocloid pedal curve. This project required a bit of math, so it was a nice memory-refresher of high school math.
// Sophia S Kim
// Section C 1:30
// sophiaki@andrew.cmu.edu
// Project-07-Composition with Curves

var nPoints = 200;

function setup() {
  createCanvas(480, 480);
}

function draw() {
  background(0);

  //middle green diamond
  push();
  translate(width/2, height/2);
  noFill();
  strokeWeight(2);
  stroke(35, 255, 0);
  drawAstroid();
  pop();

  //right blue diamond
  push();
  translate((width/2) + 10, height/2);
  noFill()
  stroke(35, 0, 255);
  drawAstroid();
  pop();

  //left red diamond
  push();
  translate((width/2) - 10, height/2);
  noFill()
  stroke(255, 0, 0);
  drawAstroid();
  pop();
}

  //atroid move based on mouseX and mouseY
  // Asteroid - http://mathworld.wolfram.com/Astroid.html
function drawAstroid() {
  var x; //xvalue for astroid curve
  var y; //yvalue for astroid curve
  var a; //for mouse X movement
  var b; //constrains mouseY values 0 to 300

  a = mouseX;
  b = constrain(mouseY, 0, 300);

  beginShape();
  for(var i = 0; i < nPoints; i++) {
    var t = map(i, 0, nPoints, 0, TWO_PI);
    //for degrees based on i

    x = 3 * a * (cos(t)) + b * (cos(3*t));
    y = 3 * a * (sin(t)) - b * (sin(3*t));
    vertex(x,y);
  }
  endShape();
}
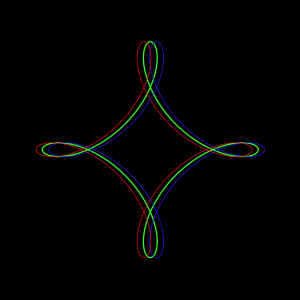
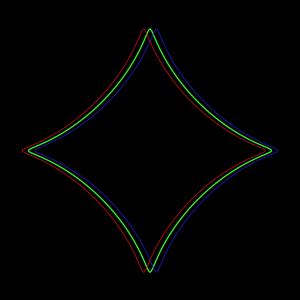
For the “Composition with Curves,” I decided to do an “Astroid” curve, which is a 4-cusped hypocycloid. At first, I was really confused which equation I use for the parametric equations, because the website offered 3 equations for each variable (x, y). I tried all three for each variable to see which one showed the diamond-like shaped curves. Within that process, I got static-like lines, which looked beautiful but was not what I wanted in my final product. After many trials and the right equations, I was able to find the diamond-like curves and create 3 different copies with different colors using push() and pop(). I really liked the way my code turned out, because the changes of the curves reminded me of the Louis Vuitton branding.
/*
Romi Jin
Section B
rsjin@andrew.cmu.edu
Project-07
*/

var x;

function setup() {
    createCanvas(480, 480);

}

function draw() {

    background(174, 198, 207);

    x = constrain(mouseX, 0, width);
    y = constrain(mouseY, 0, height);

    //three intersecting hypotrochoids

    push();
    translate(width/2, height/2);
    drawHypotrochoid();
    pop();

    push();
    translate(width/3, height/3);
    drawHypotrochoid();
    pop();

    push();
    translate(width-width/3, height-width/3);
    drawHypotrochoid();
    pop();

}

function drawHypotrochoid() {

    //link: http://mathworld.wolfram.com/Hypotrochoid.html
    //roulette by drawing along two cirles (radius a and b below)

    for (var i = 0; i < TWO_PI; i ++) {

        a = map(y, 0, height, 100, 200);
        b = map(x, 0, width, 0, 75);
        h = 100;

        x = (a - b) * cos(i) + h*cos(((a-b)/b) * i);
        y = (a - b) * sin(i) - h*sin(((a-b)/b) * i);

        noFill();
        stroke(255);
        strokeWeight(1);
        ellipse(0, 0, x, y);

    }

}
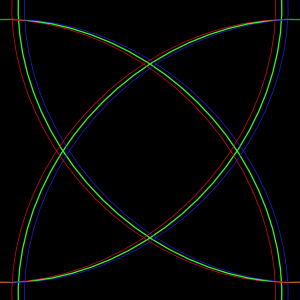
For this project, I chose the shape hypotrochoid and drew it three times to create three intersecting hypotrochoids. The parameters are the mouse X and mouse Y position, and the mouse X changes one ellipse’s radius while mouse Y changes the other. It is intriguing to watch the three intersect as they create even more curves together.
// Shirley Chen
// Section B
// junfanc@andrew.cmu.edu
// Project-07


function setup(){
	createCanvas(480, 480);
	angleMode(DEGREES);
}

function draw(){
	background(242, 186, 176);
	curveA();
	curveB();
}

function curveA(){
//Create the Fixed-Position Astroid Curve
    noFill();
    beginShape();
    var col = mouseX * 0.3;
    stroke(221, 127, col);
    translate(100, 200);
    for (var i = 0; i < mouseX/2; i ++){
//The Number of Curves Will Change According to MouseX
        LimitedMouseX = constrain(mouseX, 0, width);
        var cons = map(LimitedMouseX, 0, width, 10, 100);
//The Angle Will Change According to MouseX
        var theAngle = map(i, 0, mouseX, 20, 360);
        var x = 2 * cons * cos(theAngle) + cons * cos(2 * theAngle);
        var y = 2 * cons * sin(theAngle) - cons * sin(2 * theAngle);
        vertex(x, y);
    endShape();
//Rotate The Curves According to MouseX
    rotate(mouseX);
    }
}


function curveB(){
//Create the Moving Astroid Curve
    noFill();
    beginShape();
    var col = mouseY * 0.5;
    stroke(col, col, 110);
    translate(150, 200);
    for (var i = 0; i < mouseY*0.7; i ++){
//The Number of Curves Will Change According to MouseY
        LimitedMouseY = constrain(mouseY, 0, height);
        var cons = map(LimitedMouseY, 0, width, 10, 100);
//The Angle Will Change According to MouseY
        var theAngle = map(i, 0, mouseY, 20, 360);
        var x = 2 * cons * cos(theAngle) + cons * cos(2 * theAngle);
        var y = 2 * cons * sin(theAngle) - cons * sin(2 * theAngle);
        vertex(x, y);
    endShape();
//Rotate The Entire Astroid Curve According to MouseY
    rotate(mouseY);
    }
}
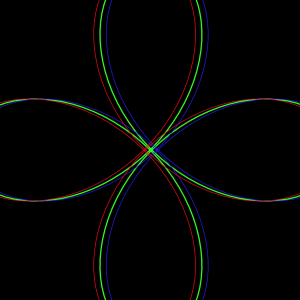
In This Project, I created a set of stable astroid curve at a fixed position and a movable set of astroid curve that keeps rotating around a center point. For the fixed set of astroid curves, the number of curves and the angle are based on the position of mouse X; for the movable set of curves, the number of curves and the angle are based on the position of mouse Y. Therefore, I used map and constrain command to limit my X and Y positions. Moreover, the colors are also changed according to the mouse X and Y. For the fixed-position set of curves, the curves inside the set is rotating according to the mouse X. For the movable set of curves, the curves inside the set and the set itself are both rotating according to the position of Y.
/*
Alexandra Kaplan
Section C
aekaplan@andrew.cmu.edu
Project - 07
*/


var nPoints = 400; // length of all for loops

function setup() {
    createCanvas(480, 400);
    background(220);
}

function draw() {
	background(150, 200, 255);
	drawStem1();
	drawEpicycloid1();
	drawCenter1();
	drawStem2();
	drawEpicycloid2();
	drawCenter2();
	drawStem3();
	drawEpicycloid3();
	drawCenter3();
}

// draws middle flower
function drawEpicycloid1() {
	var x;
	var y;
	var b = 4 + (mouseX/50); // frequency of curves
	var a = map(mouseY, 0, 400, 200, 0); // diameter of path of curve
	var h = 10 // distance from path to outer curve

	fill(220, 200, 100);
	stroke(180, 160, 60);

    beginShape();
	for (var i = 0; i < nPoints; i += 1) {
        var t = map(i, 0, nPoints, 0, 360);
        x = (a + b) * cos(radians(t)) - h * cos((radians(a + b)/ b) * t);
        y = (a + b) * sin(radians(t)) - h * sin((radians(a + b)/ b) * t);
        vertex(x + width / 2, y + mouseY);

    }
    endShape(CLOSE);
}

// draws center of middle flower
function drawCenter1(){
	fill(50);
	var centerW1 = 1
	centerW1 = map(mouseY, 0, 400, 200, 1)
	ellipse(width / 2, mouseY, centerW1, centerW1);
}

// draws middle stem
function drawStem1(){
	fill(50, 150, 50);
	stroke(20, 120, 20);
	rect(width / 2 - 5, mouseY, 10, 1000);
}

// draws left flower
function drawEpicycloid2() {
	var x;
	var y;
	var b = 3 + (mouseX / 50); // frequency of curves
	var a = map(mouseY, 0, 400, 50, 0); // diameter of path of curve
	var h = 10 // distacne from path to outer curve

	fill(220, 200, 220);
	stroke(160, 140, 160);

    beginShape();
	for (var i = 0; i < nPoints; i += 1) {
        var t = map(i, 0, nPoints, 0, 360);
        x = (a + b) * cos(radians(t)) - h * cos((radians(a+b)/ b) * t);
        y = (a + b) * sin(radians(t)) - h * sin((radians((a+b)/b) * t));
        vertex(x + width / 4, y + mouseY + 170);

    }
    endShape(CLOSE);
}


// draws left center
function drawCenter2(){
	fill(50);
	var centerW2 = 0;
	centerW2 = map(mouseY, 0, 400, 50, 1);
	ellipse(width / 4, mouseY + 170, centerW2, centerW2);
}

// draws right stem
function drawStem2(){
	fill(150, 250, 150, 150);
	stroke(100, 200, 100);
	rect(width / 4 - 5, mouseY + 170, 10, 1000);
}

// draws right flower
function drawEpicycloid3() {
	var x;
	var y;
	var b = 2 + (mouseX / 50); // frequency of curves
	var a = map(mouseY, 0, 400, 20, 0); // diameter of path of curve
	var h = 6 // distance from path to outer curve

	fill(155, 155, 250);
	stroke(130, 130, 230);

    beginShape();
	for (var i = 0; i < nPoints; i++) {
        var t = map(i, 0, nPoints, 0, 360);
        x = (a + b) * cos(radians(t)) - h * cos((radians(a + b) / b) * t);
        y = (a + b) * sin(radians(t)) - h * sin((radians(a + b) / b) * t);
        vertex(x + width - width/4, y + mouseY + 250);
    }
    endShape(CLOSE);
}

// draws right center
function drawCenter3(){
	fill(50);
	var centerW3 = 0;
	centerW3 = map(mouseY, 0, 400, 20, 0);
	ellipse(width - width / 4, mouseY + 250, centerW3, centerW3);
}

// draws right stem
function drawStem3(){
	fill(100, 200, 100, 200);
	stroke(80, 180, 80);
	rect(width - width / 4 - 5, mouseY + 250, 8, 1000);
}
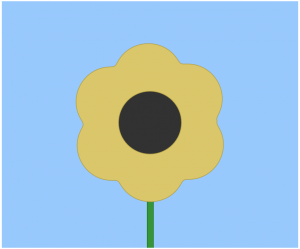
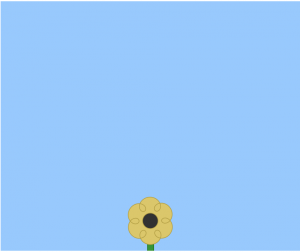
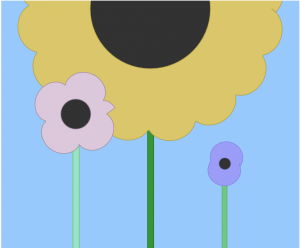
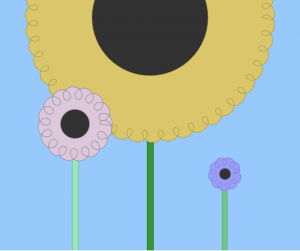
When looking at the description for this project, my mind immediately went to flowers and the different shapes of flower petals. It was pretty difficult at first to figure out how to insert the equations from the website into my code, but once I did it was fun to play around how I could then change the curves. Here are some screenshots of different x and y combinations:
// Kyle Leve
// kleve@andrew.cmu.edu
// Section A
// Project-07-Curves

var a = 40;
var b = 40;

function setup() {
    createCanvas(480, 480);
}

function draw() {
    background(255);
    translate(width/2, height/2); // Sets all the curves to the center of the canvas
    drawAstroid1(); // Draws first curve
    drawAstroid2(); // Draws second curve
    drawAstroid3(); // Draws third curve
    drawAstroid4(); // Draws fourth curve
    if (mouseX >= 0 & mouseX <= width/2) { // Makes silver side shrink/appear and red side grow/disappear
        a += -0.1 * mouseY;
        b += 0.1 * mouseY;
    }
    if (mouseX > width/2 & mouseX <= width) { // Makes red side shrink/appear and silver side grow/disappear
        a += 0.1 * mouseY;
        b += -0.1 * mouseY;
    }
}

function drawAstroid1() { // First curve
    beginShape();
    fill('red');
    for(var i = 0; i < 240 * TWO_PI; i++) { // Draws overlapping vertices to make curves
        stroke(0);
        vertex(500 * (cos(i)**a), 500 * (sin(i)**a));
    }
    endShape();
}

function drawAstroid2() { // Second curve
    beginShape();
    fill('silver');
    for(var i = 0; i < 240 * TWO_PI; i++) { // Draws overlapping vertices to make curves
        stroke(0);
        vertex(-500 * (cos(i)**b), 500 * (sin(i)**b));
    }
    endShape();
}
function drawAstroid3() { // Third curve
    beginShape();
    fill('red');
    for(var i = 0; i < 240 * TWO_PI; i++) { // Draws overlapping vertices to make curves
        stroke(0);
        vertex(500 * (cos(i)**a), -500 * (sin(i)**a));
    }
    endShape();
}
function drawAstroid4() { // Fourth curve
    beginShape();
    fill('silver');
    for(var i = 0; i < 240 * TWO_PI; i++) { // Draws overlapping vertices to make curves
        stroke(0);
        vertex(-500 * (cos(i)**b), -500 * (sin(i)**b));
    }
    endShape();
}
I found this project to be really interesting because I found myself using functions that I had not used in the past. I decided in this project that I wanted to have contrasting sides where when something was happening to one side, the opposite was happening to the other. This is what ended up happening with the silver and red sides of the canvas. When one side expands, the other shrinks and vice versa. This is due to both mouseX and mouseY however each one has their own distinct properties. MouseX controls how the two sides behave while mouseY controls the speed at which they happen. This project helped me better understand how to have separate entities behave in similar yet contrary ways.
/* Eunice Choe
Section E
ejchoe@andrew.cmu.edu
Project-07
*/

function setup() {
    createCanvas(480, 480);
    frameRate(10);
}

function draw() {
// changes color depending on mouse position
    var r = map(mouseY, 0, height, 0, 255);
    var g = map(mouseX, 0, width, 0, 100);
    var b = map(mouseY, 0, height, 0, 180);
    background(r, 200, 100);
    stroke(r, g, b);
// position of curves to the center of canvas
    translate(width / 2, height / 2);
    noFill();
    strokeWeight(2);
    drawHypotrochoid();
    strokeWeight(0.5);
    drawRanunculoid();
}

function drawHypotrochoid(){
    var x;
    var y;
    var h = constrain(width / 2, 0, mouseX / 2); // distance from center
    var a = map(mouseX, 0, width, 0, HALF_PI); // size of inner circle
    var b = map(mouseY, 0, height, 0, PI); // size of outer circle

    beginShape();
        for(var i = 0; i < width; i+=10){
            var t = i / 2;
            // equation of hypotrochoid
            x = (a - b) * cos(t) + h * cos(((a - b) / b) * t);
            y = (a - b) * sin(t) - h * sin(((a - b) / b) * t);
            vertex(x, y);
        }
    endShape();
}

function drawRanunculoid(){
    var x;
    var y;
    var h = constrain(width / 4, 0, mouseX / 4); // distance from center
    var a = map(mouseX, 0, width, 0, 12 * PI); // size of inner circle
    var b = map(mouseY, 0, height, 0, 12 * PI); // size of outer circle

    beginShape();
        for(var i = 0; i < 400; i++){
            var t = i / 2;
            // equation of ranunculoid
            x = a * (6 * cos(t) - cos(6 * t));
            y = a * (6 * sin(t) - sin(6 * t));
            vertex(x, y);
        }
    endShape();
}
When I started this project, I was intimidated by the equations because I have not done math like this in a long time. It took me a little while to figure out how to use the for loop with the equations and the variables within them. Even though I faced some difficulties coding my first curve, which was the Hypotrochoid, I decided to add another curve called the Ranunculoid because I like how they interacted with each other. This project also helped me understand the map() and constrain() functions, which I used to control the colors and sizes of the curves. The curves when the mouse position is in the top left of the canvas.The curves when the mouse position is in the bottom right corner of the canvas.
function setup(){
	createCanvas(480,480);
}

function draw(){
	background(50);
	push();
	translate(width/2,height/2);
		push();
			for (var i = 0; i < width; i+=4) {
			translate(i,i)
			rotate(PI * mouseX/150);
			drawDevilCurve();
		};
		pop();
	pop();
}

function drawDevilCurve(){
	var range = 50;
	var b = map(mouseY, 50, height-50, 0, 50);
	var a = map(mouseX, 50, height-50, 0, 50);

	noFill();
	stroke(200);
	beginShape();
	for (var i = 0; i < range ; i++) {
		var t = map (i, 0, range, 0,  2* PI);
		var SINS = sq(sin(t));
		var COSS = sq(cos(t));
		var x = cos(t) * sqrt(((sq(a) * SINS) - (sq(b)*COSS)) / (SINS - COSS));
		var y = sin(t) * sqrt(((sq(a) * SINS) - (sq(b)*COSS)) / (SINS - COSS));
		vertex(x,y);
	}
	endShape();
}
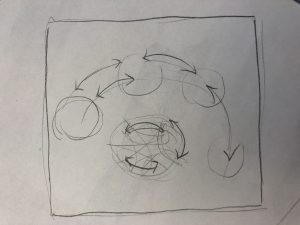
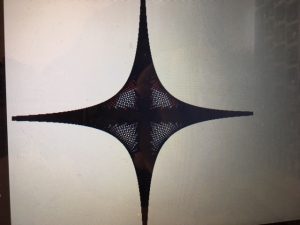
For this project, I began with a Devil’s Curve. Upon its creation, I began playing around with the different parameters of the curve to find an interesting shape. The two parameters involving the location of the mouse includes the different shape that the function would create and the location in which the curves would spiral.
![[OLD FALL 2018] 15-104 • Introduction to Computing for Creative Practice](https://courses.ideate.cmu.edu/15-104/f2018/wp-content/uploads/2020/08/stop-banner.png)