![[OLD FALL 2018] 15-104 • Introduction to Computing for Creative Practice](../../../../wp-content/uploads/2020/08/stop-banner.png)
//Yingyang Zhou
//Section A
//yingyanz@andrew.cmu.edu
//Project-07
function setup() {
createCanvas(480, 480);
}
function draw() {
background(250);
drawAstroid();
drawEpispiral();
drawRadialCurve();
frameRate(20);
function drawAstroid(){
push();
translate(width/2, height/2);
var a = 200;
var b = 200;
for(r = 0; r < 5; r++){
rotate(r);
noFill();
strokeWeight(0.1);
var red = map(r, 0, 3.14, 0, 255);
stroke(red,0,255-red);
beginShape();
for (var t = 0; t < mouseX; t++){
x = a*cos(t)*cos(t)*cos(t);
y = a*sin(t)*sin(t)*sin(t);
curveVertex(x + random(0, 1),y + random(0, 1));
}
endShape();
}
pop();
}
}
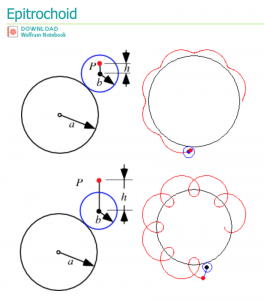
function drawEpispiral(){
push();
translate(width/2, height/2);
var a = 60;
var b = 20;
var h = constrain(mouseX/2, 0, width/2);
var r = mouseX/50;
noFill();
strokeWeight(0.5);
stroke("red");
beginShape();
for (c = 0; c < 200; c++){
var t = map(c, 0, 180, 0, TWO_PI);
x = (a+b)*cos(t)-h*cos(c+t*(a+b)/b);
y = (a+b)*sin(t)-h*sin(c+t*(a+b)/b);
curveVertex(x, y);
}
endShape();
pop();
}
function drawRadialCurve(){
push();
translate(width/2, height/2);
beginShape();
var angle = map(mouseX,0, width, 0, 360);
rotate(radians(angle));
var a = 50;
for (var t = 0; t < 200; t +=2){
stroke(t, 0, 0);
strokeWeight(0.5);
var x = 1/3*a*(2*cos(t)+cos(2*t));
var y = 1/3*a*(2*sin(t)-sin(2*t));
curveVertex(x,y);
}
endShape();
pop();
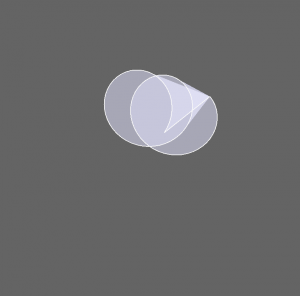
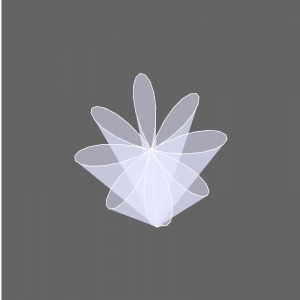
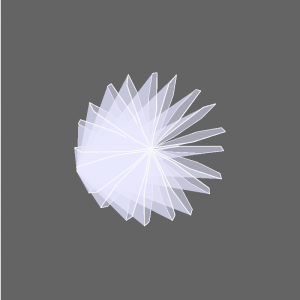
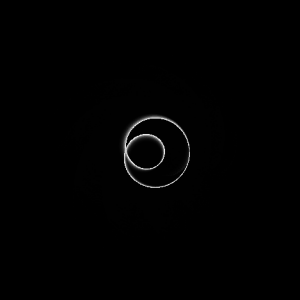
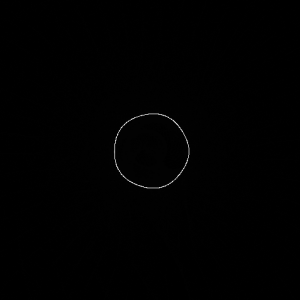
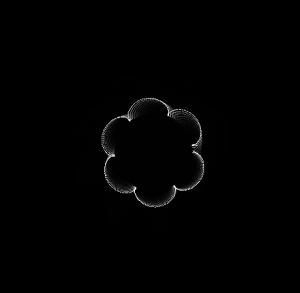
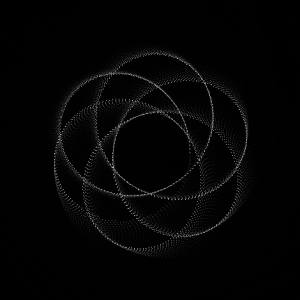
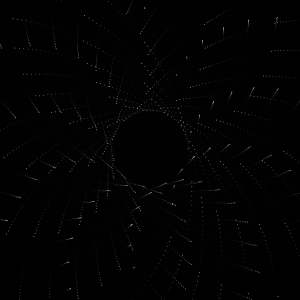
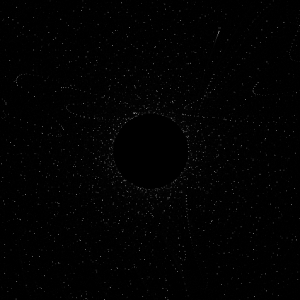
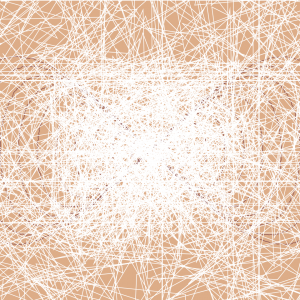
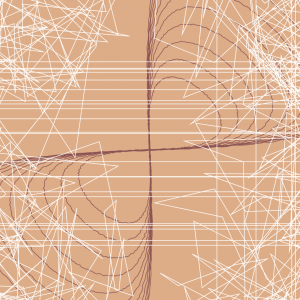
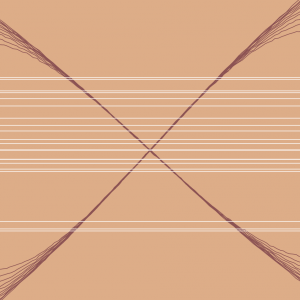
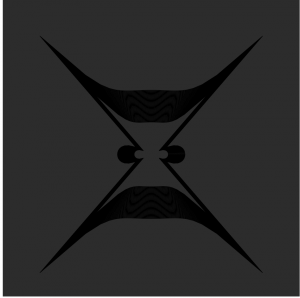
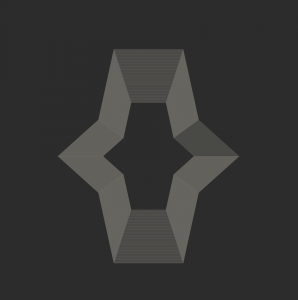
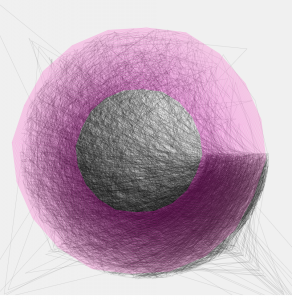
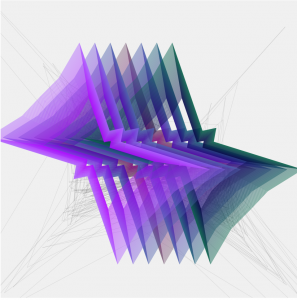
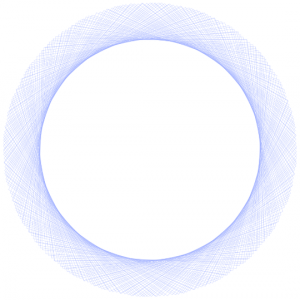
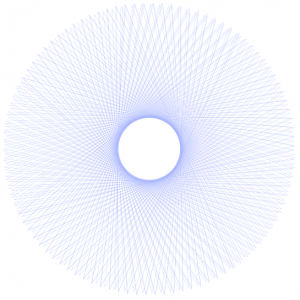
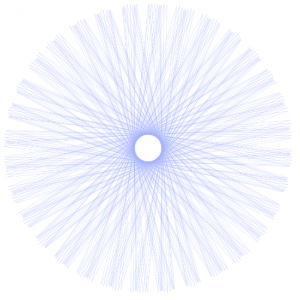
}In this project, I start using functions which make the code more readable and easier to revise if needed. I use three types of curves in this project all involving sin and cos but different from each other and have different movement along the changes of mouse position.