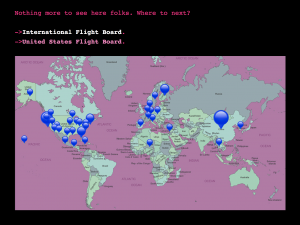
I looked at Angela Washko’s interactive work titled “All The Places You’ll Go”, where she begins to use postcards as found artifacts to unravel the use of women as a representation of place in the lens of the male gaze. I initially gravitated towards this project for its aesthetic appeal, and continued onward into it out of my predisposed interest in postcards as graphic artifacts.
“flight board” where postcard archives may be accessed by location
Diving into the project was eye opening in presenting me with the images in a sterile context, where I could think critically about the content of the postcard and compare it directly to prints with the same objective.
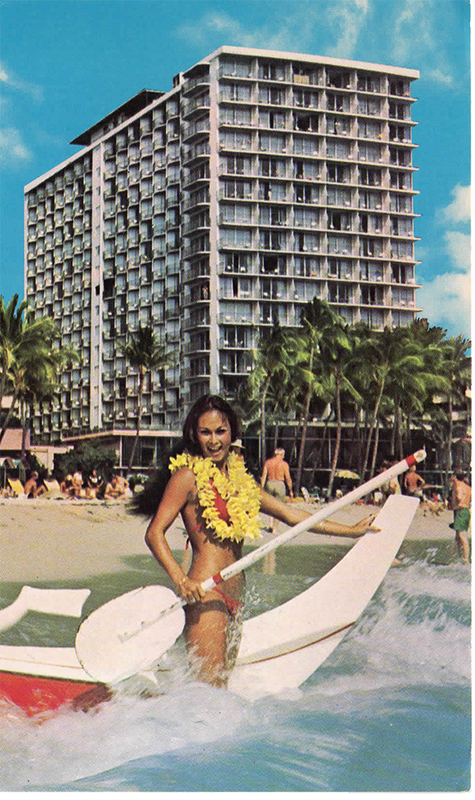
Hawaiian woman used to sell a vacation
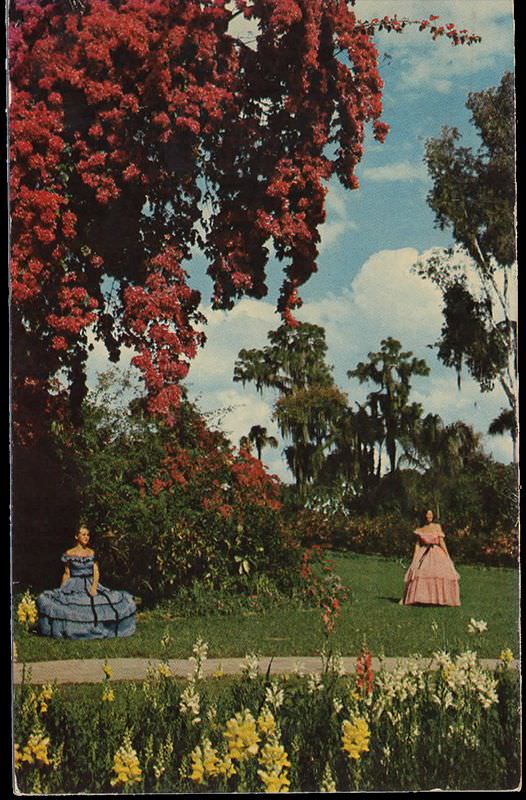
In some images, we see the female figure being used to sell the idea of a location’s beauty. This is seen in a more contemporary example (above) and even in a more conservative context (below).
a conservative balance between beauty in women and environment (Indiana)
I really admire Washko’s ability to create such a unique emotional reaction without it feeling implicitly prescribed. Everybody who interacts with the piece will have a different interpretation and connection (or lack thereof) to each postcard based upon their life experiences and travels. However, the curation of the postcards unifies these reactions to encourage viewers to think critically upon the social implications that these small artifacts are manifestations of, and if they reflect the value systems of viewers.
In an overview of her practice as a whole, Washko works to give platform to conversations about gender and feminism in places where it does not readily exist. These environments have included formal settings such as the Museum of the Moving Image and more uncharted territory such as her performance art within World of Warcraft servers.
Angela Washko earned a BFA in Painting/Drawing/Sculpture at Temple University’s Tyler School of Art. She continued her education at UCSD where she went on to earn her MFA. Angela Washko is an assistant professor of art right here at Carnegie Mellon University.
/*
Min Jun Kim
15104
Project 10
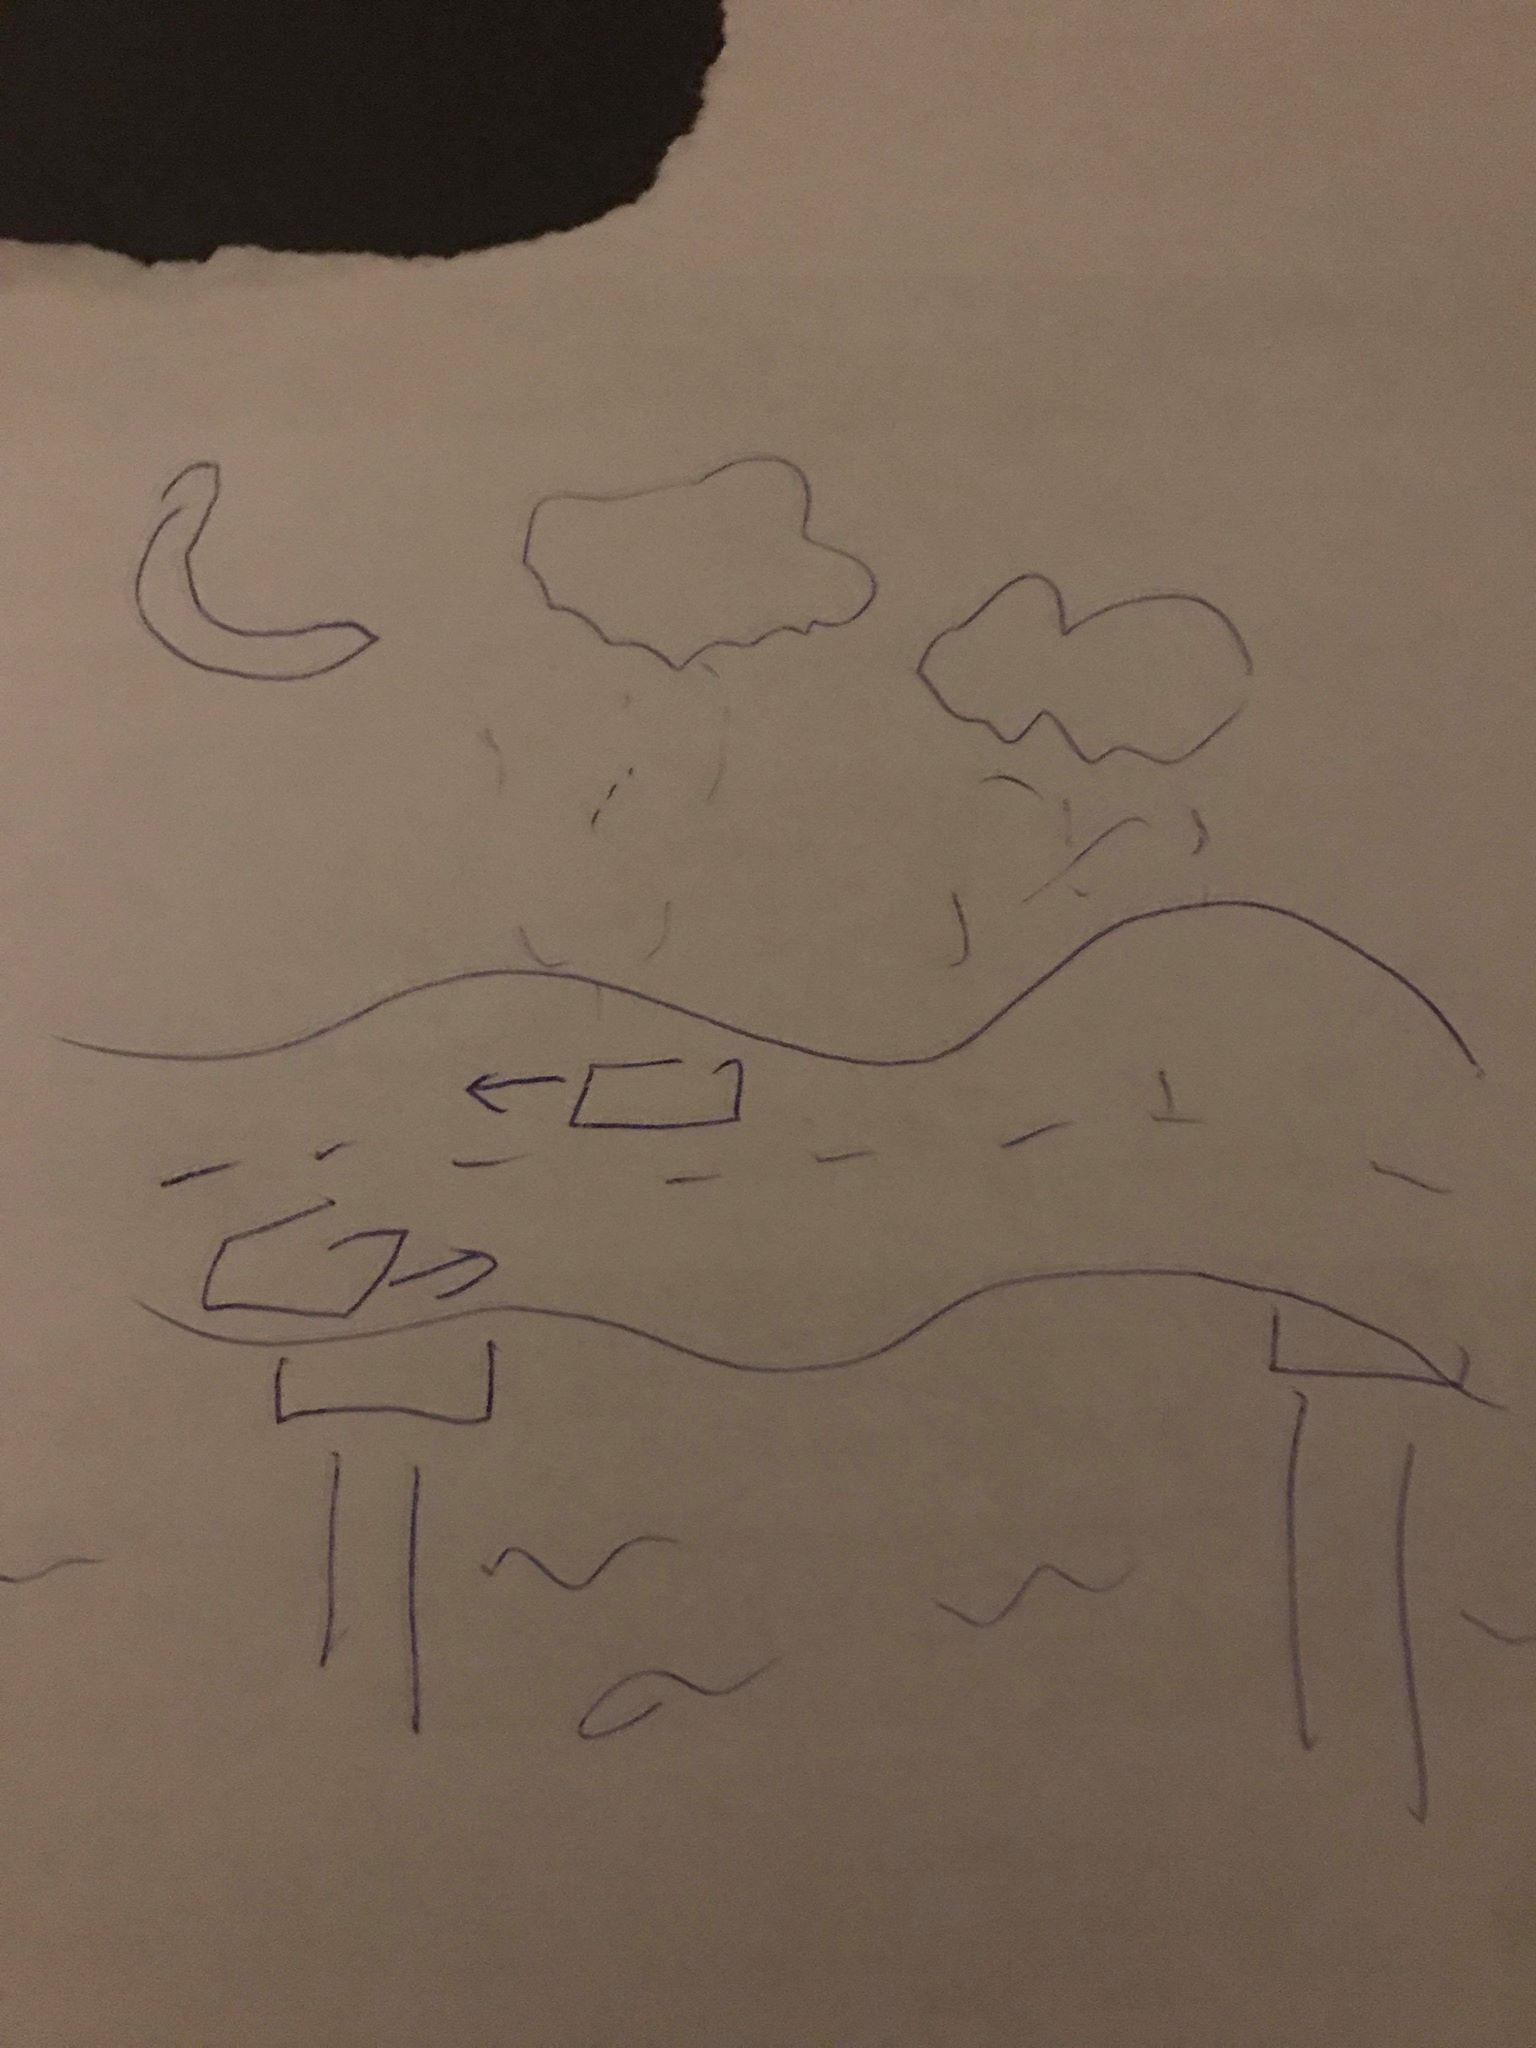
This program draws a highway setting with randomly made objects
*/
var terrainSpeed = 0.0001;
var terrainDetail = 0.0005;
var terrainmapx = [];
var terrainmapy = [];
var dec = 0; //counter for time
var cars = []; //array of cars
function setup() {
//sets up canvas and initial 3 cars
createCanvas(640, 400);
for (var i = 0; i < 3; i++) {
var rx = random(width);
cars[i] = makeCar(rx);
}
}
function draw() {
background(0);
fill(0);
stroke(0);
beginShape();
for (var x = -30; x < width; x++) {
var t = (x * terrainDetail) + (millis() * terrainSpeed);
var y = map(noise(t), 0,1, 0, height)+100;
//draws the wavey terrain background
vertex(0,height);
vertex(width/2, height);
vertex(width, height);
vertex(x, y);
//index the values for access
terrainmapx[x]=x;
terrainmapy[x]= y;
}
endShape();
//specifications of drawing future items
stroke(100);
rectMode(CENTER);
//when the array gets too full erase the old values
for (i = 0; i < terrainmapx.length; i+=1) {
if(terrainmapx.length > 700) {
terrainmapx.pop();
terrainmapy.pop();
}
//draws the highway
stroke(50);
fill(50);
rect(i, terrainmapy[i]-65,30,110);
fill(100);
stroke(100);
rect(i, terrainmapy[i],30,20);
rect(i, terrainmapy[i]-130,20,20);
}
//draws the while center line of the highway
for (i = 0; i < width+55; i += 50) {
fill(240);
rect(i+20, terrainmapy[i]-60, 30, 7);
}
//calls functions for the car
DisplaynUpdateCars();
addCarWithSomeRandomProbability();
//draw the car going right that stays on the canvas
push();
translate(150, terrainmapy[150]-30);
rotate(degrees((atan2(terrainmapy[640]-terrainmapy[150]-30,640-150))+360%360))
fill(250,240,95,80);
noStroke();
triangle(15,0,100,40,100,-40);
fill(0);
rect(0,0, 60, 30);
fill(240,0,0);
rect(0,0, 30, 30);
pop()
//draws the moon
fill(250,240,95);
ellipse(50, terrainmapy[50]-300, 50,50);
fill(0);
ellipse(62, terrainmapy[50]-300, 30,30);
//draws the raindrops
for (var y = 5; y <= 480; y+=20) {
for (var x = 5; x <= 640; x += 10) {
stroke(0,40,50,80);
line(x,y,x,y+random(0,20));
}
}
}
function carMove() {
//updates the speed and location of the car
if (oldspeed > this.speed) {
this.speed = this.speed+ 10;
}
var oldspeed = this.speed;
this.x += this.speed;
}
function DisplaynUpdateCars() {
//calls the display and update function
for (var i = 0; i < cars.length; i++) {
cars[i].display();
cars[i].move();
}
}
function carsDisplay() {
//draws the car itself
noStroke();
var heighty= terrainmapy[round(this.x)];
push();
for (i=0; i<10; i++) {
fill(250,240,95,10);
triangle(this.x, heighty-85, this.x-this.sizeX, heighty-85-40,this.x-this.sizeX,heighty-85+40);
fill(this.colory,100,100);
rect(this.x, heighty-85, this.sizeX, this.sizeX/2);
push();
fill(200);
rect(this.x, heighty-85, this.sizeX/2, this.sizeX/2);
pop()
}
pop();
}
function addCarWithSomeRandomProbability() {
//probability of a car increases over time, which guarentees
//that there won't be too long of a gap between cars
dec += 1;
if (random(0,1) < dec/500) {
cars.push(makeCar(width));
dec = 0;
}
}
function makeCar(birthLocationX) {
//specifications of the car
var car = {x: birthLocationX,
sizeX: random(60,120),
colory: random(250),
speed: random(-20,-15),
move: carMove,
display: carsDisplay
}
return car;
}
I wanted to make a program that draws on uniquely created terrain, so I studied the way of using noise to create new terrain. Then I made it such that the terrain appears to be smooth and wavy. I indexed the values for later use, and made it such that it disappears when reaching a certain limit- This helped improve the speed of the animation and reduced the need for indexing the x value. I then made it such that random cars appear on both sides, but it looked unrealistic (physics wise) so I made one car stay in the same spot. To make things more moody, I changed it to a night-setting with transparent headlights, a moon and the rain. One problem that I had was that sometimes, the car would overlap when initially starting out, and I tried to go around this problem by changing the range of the speed and adding a counter to the probability of making a new car. I really liked how this project turned out and it taught me well about object programming.
I am using 1 of my grace days for this late submission.
For this Looking Outwards post, I was inspired by Kai Zhang’s post on Kinetic Generative Music Installation (2017) by Andrius Sarapovas. This project creates an environment that you walk into, which contains various forms of instruments that create sounds meant to represent connections to a 4G network in Lithuania. There are a lot of features of the instrumental setup that correlate to the amount of data being processed and the number of connections to the network. The setup was also designed to take into account the size and features of the space it was built in. I think that this installation is a really cool idea, something I would want to experience myself. I like how the experience of this project has the potential to meet the expectations of the subject, or to make them view big data in a new way. I agree with Kai’s assessment that this exhibit made something relatively “cold” such as data connections into something “warm” like the echoing music which was produced. I think that this project could also have the effect of making the subject feel as if they are “part of something bigger”, through the experience of literally walking within the space and experiencing something that creates a sonic collage of interconnected events which are happening in the world. I also appreciated the pleasant nature of the sound that was created – for example, the designer could have chosen to make the sounds more harsh or pointed, but this richer sound has a more welcoming and relaxing effect on the listener. I think that this choice reflects the designer’s intent with this piece.
Scene Design, 2009Carnival Interactive Aquarium, NYC 2009
Emily Gobeille is an artist and renowned designer who specializes in merging technology and design to create rich and immersive design experiences. She is a Partner and Creative Director of Design I/O, and due to her unbound energy and affinity for telling stories, she tends to create of high-end but playful interactive installations for children. With an emphasis on meaningful interaction and systems built to support open play and discovery, her work creates a sense of wonder and delight.
Installation in Use, Baltimore, 2009
The Carnival Interactive Aquarium, commissioned by Arnold R&D, was installed in storefront windows in 6 cities across the US. Gobeille used computer vision to cause the seascape to react to the motion of a user – seaweed will sway and fish will scatter – who can dial in with any mobile device and create a fish using their voice. Users play a game with the installation in real time through voice and phone keypad. I think this installation, though it was created as an advertisement, is really neat in how the public can interact with it.
//Elizabeth Maday
//Section A
//emaday@andrew.cmu.edu
//Project 9
var theImage;
function preload() {
theImage = loadImage("https://i.imgur.com/zBgacYu.png");
}
function setup() {
createCanvas(400, 480);
background(0);
theImage.loadPixels();
frameRate(100);
}
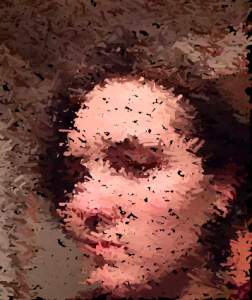
function draw() {
translate(-10, -10);
var x = random(width);
var y = random(height);
var col = theImage.get(x, y);
stroke(col);
var lengthmap = constrain(map(15, 0, mouseY, 0, 20), 5, 50);
var weightmap = constrain(map(3, 0, 10, 0, mouseX/50), 0.2, 5);
push();
strokeWeight(weightmap);
line(x + random(-20, 20), y + random(-10, 10), x + lengthmap, y + lengthmap);
pop();
if (mouseX > width/2) {
fill(col);
ellipse(x, y, 2, 2);
}
}
I liked working on this project because I got to see all the things that I could play around with while working in this format of altering a pre-existing image. I am interested in doing more creative things with this in the future. For this project, I used the position of the mouse to manipulate line length, strokeWeight, and whether or not ellipses are drawn.
// Jisoo Geum
// Section B
// jgeum@andrew.cmu.edu
// Project-09
var underlyingImage;
function preload() {
var myImageURL = "https://i.imgur.com/B1NyNfc.jpg";
underlyingImage = loadImage(myImageURL);
}
function setup() {
createCanvas(480, 480);
background(255);
underlyingImage.loadPixels();
frameRate(5000);
}
function draw() {
var px = random(width);
var py = random(height);
var ix = constrain(floor(px), 0, width-1);
var iy = constrain(floor(py), 0, height-1);
var theColorAtLocationXY = underlyingImage.get(ix, iy);
noStroke();
fill(theColorAtLocationXY);
textSize(random(5,30));
textFont('Futura');
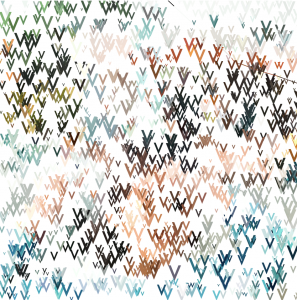
text( "V", px, py);
var theColorAtTheMouse = underlyingImage.get(mouseX, mouseY);
stroke(theColorAtTheMouse);
line(pmouseX, pmouseY, mouseX, mouseY);
}
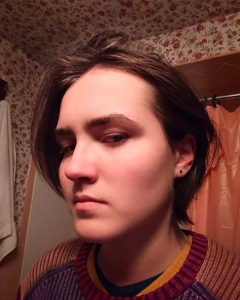
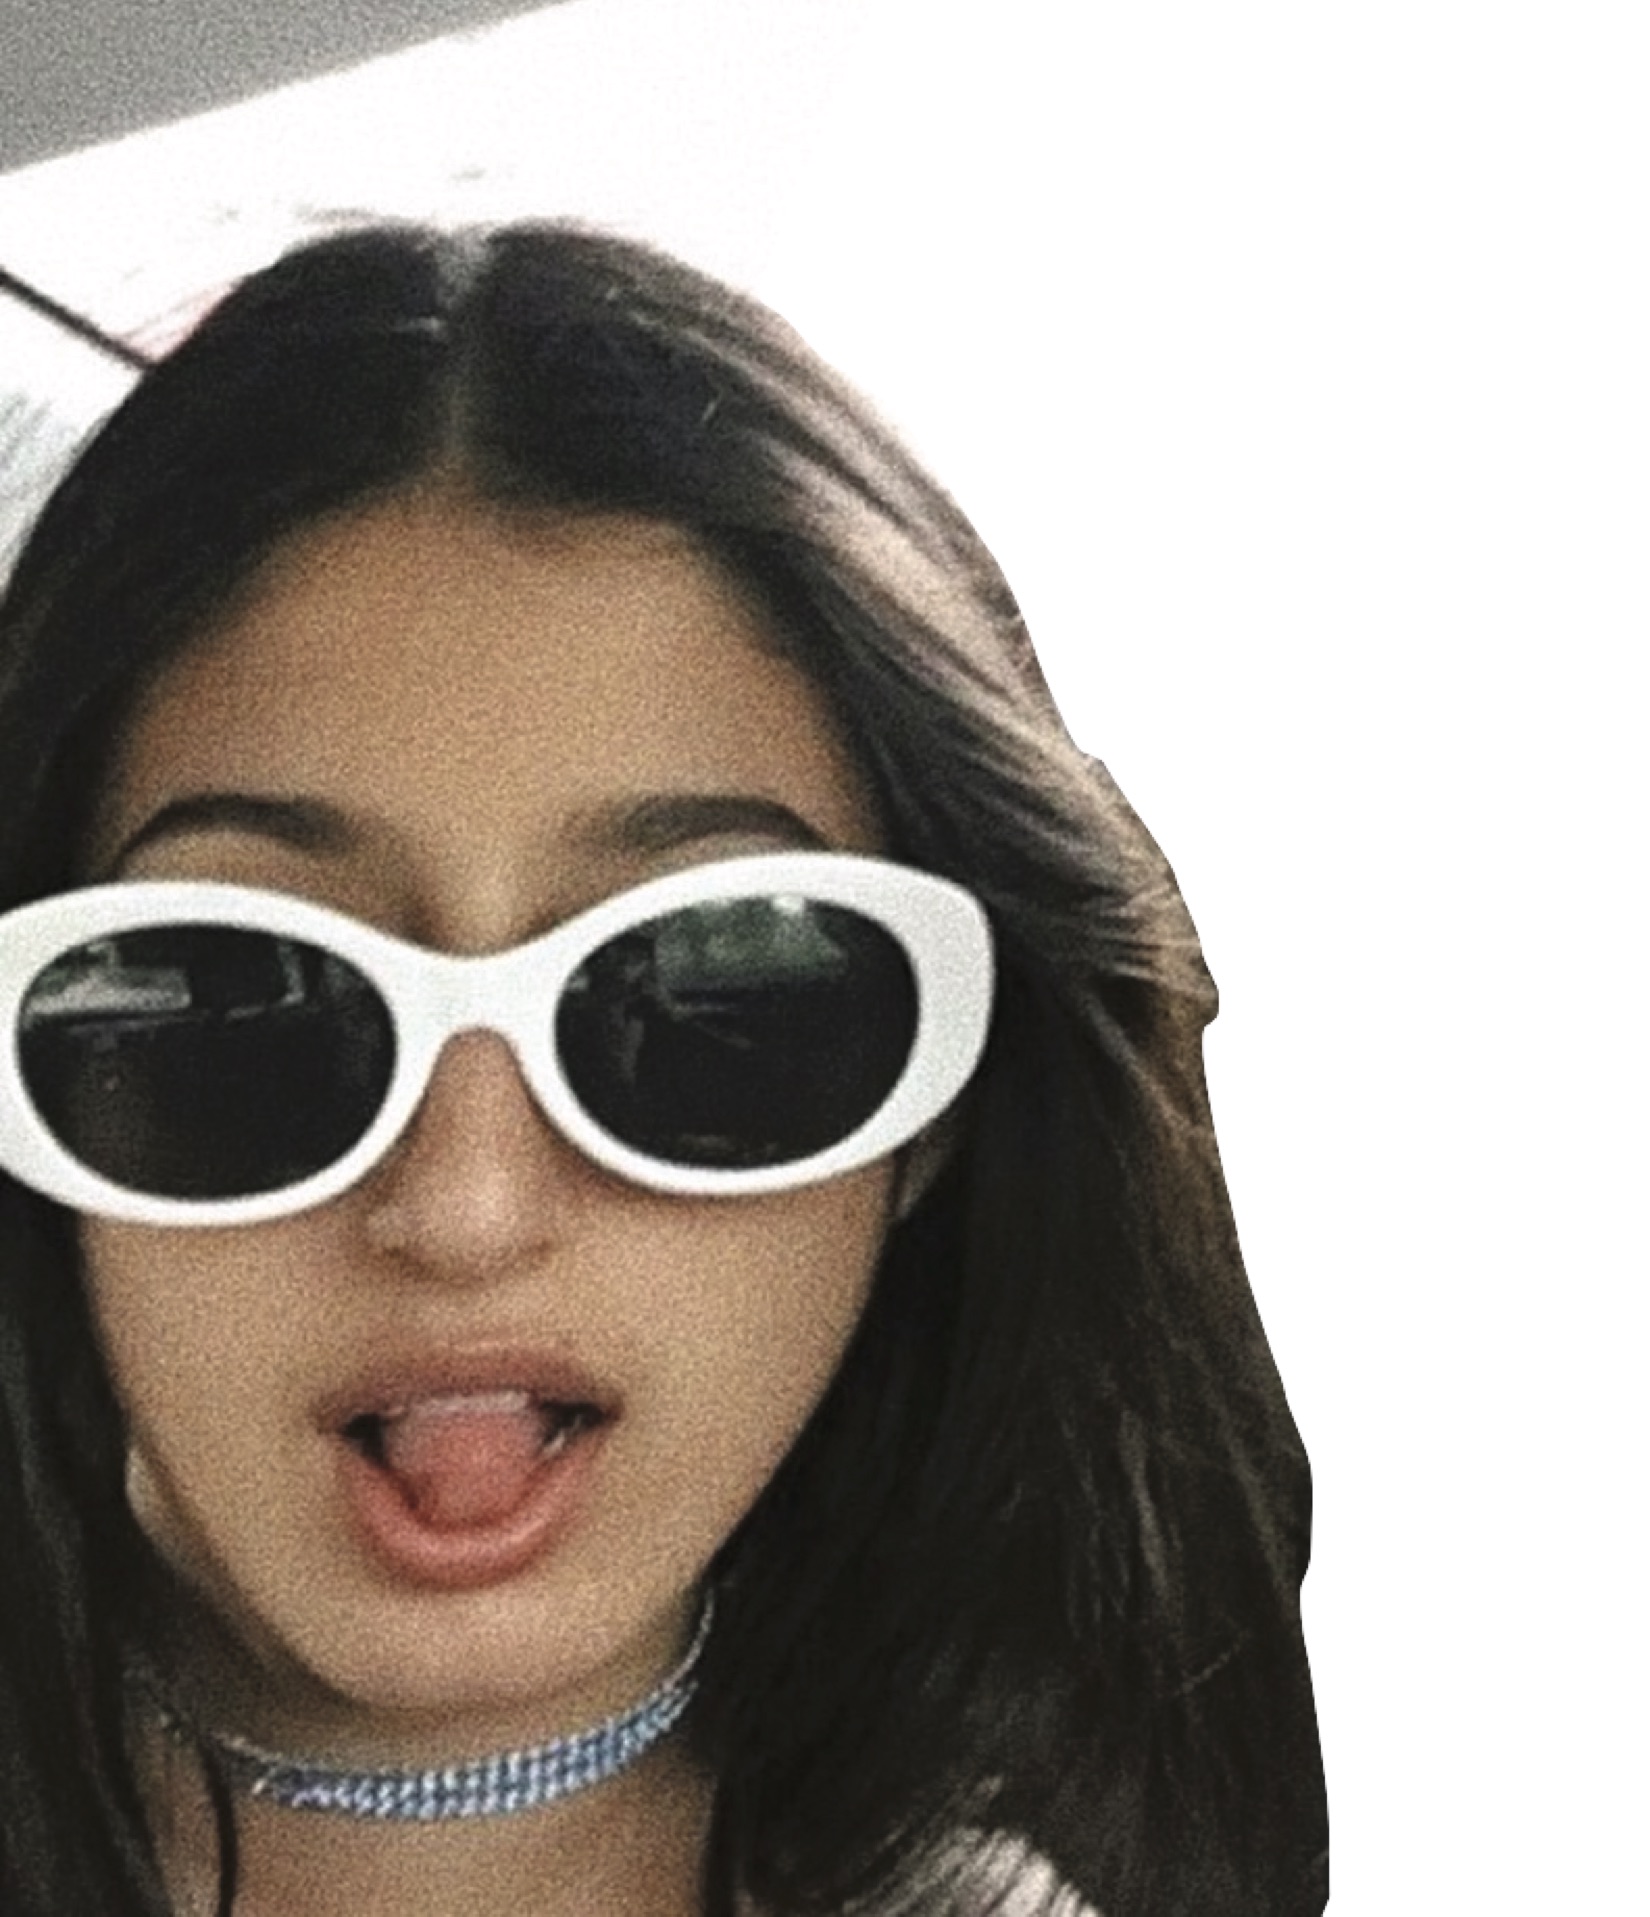
I figured that the color palette of the image would be more important than the details so I chose a photo that has all my favorite colors – green, orange, and blue. The girl in the picture is me when I was 8. I changed the ellipse shape into ‘V’ letter simply because I am making a V shape with my fingers. I had fun choosing the photos for this project!
// Catherine Coyle
// ccoyle@andrew.cmu.edu
// section C
// project 9

var img;
var currColor;
var ix;
var iy;
var seenColors = [];

// basic image loading code

function preload() {
    var imgurl = 'https://i.imgur.com/2TSW1Hy.png';
    img = loadImage(imgurl)

}

function setup() {
   createCanvas(480, 480);
   background(0);
   img.loadPixels();
}

function draw() {
    // this basic pixel grabbing format was taken from the example on the website
    var px = random(width);
    var py = random(height);
    ix = constrain(floor(px), 0, width-1);
    iy = constrain(floor(py), 0, height-1);
    currColor = img.get(ix, iy);
    // will draw the shape/pixel with the right color
    stroke(currColor);
    drawShape(px, py);
}

// drawing the pixel at given location
function drawShape(x, y) {
    var donutSize = calcSize();
    strokeWeight(donutSize);
    noFill();
    ellipse(x, y, donutSize * 2, donutSize * 2);

}


// the size of the donuts is based on the frequency of
// pixels w the same color
function calcSize() {
      var currColorBr = floor(brightness(currColor));
      seenColors.push(currColorBr);
      return constrain(countElements(currColorBr), 0, 20);
}


// idk if theres a java function that counts elements but
// i couldnt find one when i looked so i wrote one
function countElements(element) {
    var c = 0;
    for(var i = 0; i < seenColors.length; i++) {
        if (seenColors[i] == element) {
            c++;
        }
    }
    // mod 10 to make them not get too big
    return c % 10;
}
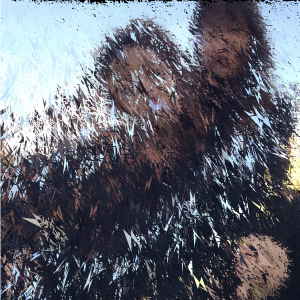
I thought this was a cool project! I chose my close friend Melissa as the subject because I think this is a really pretty picture of her that I took over the summer. She really likes donuts so I decided to make the ‘pixels’ all donut shaped. It felt too simple just doing that though so I wanted to add another aspect to it. I decided to have the sizes of the donuts be based on the frequency of the brightness of the pixels. It took a while because I found out that javascript doesn’t really have dictionaries which was disappointing so I just stored all the information in a list and wrote functions to count the frequency.
I am happy with how it turned out in the end!
A possible unfinished outcome
Early design I was just figuring out how to make it workOriginal picture of Melissa! I had to crop and resize the one used for the project
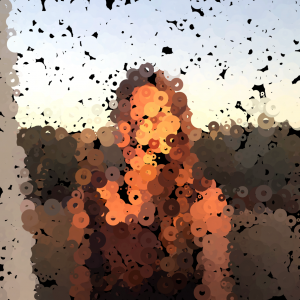
/*
Arden Wolf
ardenw@andrew.cmu.edu
Section B
project 09

*/


var underlyingImage;

function preload() {
    var myImageURL = "https://i.imgur.com/JSqV6vs.jpg?2";
    underlyingImage = loadImage(myImageURL);
}

function setup() {
    createCanvas(413, 480);
    background(0);
    underlyingImage.loadPixels();
    frameRate(1000);
}

function draw() {
    var px = random(width);
    var py = random(height);
    var ix = constrain(floor(px), 0, width-1);
    var iy = constrain(floor(py), 0, height-1);
    var theColorAtLocationXY = underlyingImage.get(ix, iy);
    var size = random(7,20);
    var pie = random(HALF_PI, QUARTER_PI, TWO_PI,PI)

    noStroke();
    fill(theColorAtLocationXY);
    //ellipse(px, py, size, size);
    arc(px, py, size, size, size, pie);


    var theColorAtTheMouse = underlyingImage.get(mouseX, mouseY);
    fill(theColorAtTheMouse);
    arc(pmouseX, pmouseY, size, size, size, pie);
}
I randomized the size and the arc degrees as the shapes that make up the image and also made the color at mouse the same shapes so that the viewer can interact and contribute to the creation of the image.
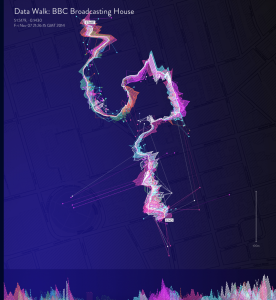
Phantom Terrains – 2014 – Stefanie Posavec, Frank Swain, Daniel Jones
Kat Hua’s post on week 7 for looking outwards was a report on the abstract visualization from the work of Phantom Terrains by Frank Swain, Stefanie Posavec, and Daniel Jones. I had only looked at acstract work that had apurpose of manipulating different data such as math equations or preset numbers, but it was interesting to see the way people would abstractly represent the data from something such as the internet data. I agree with Kat on her admiration of the project and how the project’s purpose was to present the data of streaming wireless data surges from our everyday lives. What I can add to it is that I liked out they had an abstract view of the data, but also a more commonly known set of data which is the sound waves, which helps the viewers to read the data better.
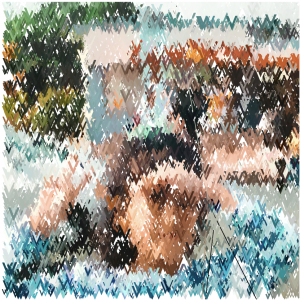
/*Julie Choi
15-104 Section E
jjchoi@andrew.cmu.edu
Project-09
*/
var underlyingImage;

function preload() {
    var myImageURL = "https://i.imgur.com/re8jPYz.jpg";
    underlyingImage = loadImage(myImageURL);
}

function setup() {
    createCanvas(700, 700);
    background(0);
    underlyingImage.loadPixels();
    frameRate(1000);
}

function draw() {
    var px = random(width);
    var py = random(height);
    var ix = constrain(floor(px), 0, width-1);
    var iy = constrain(floor(py), 0, height-1);
    var theColorAtLocationXY = underlyingImage.get(ix, iy);
    var ballSize = map(mouseX, 0, width, 4, 20);

    stroke(theColorAtLocationXY);
    strokeWeight(2);
    line(px + random(10), py + random(10), px + random(30), py + random(30));

    push();
    rotate(random(0, PI));
    noStroke();
    fill(theColorAtLocationXY);
    quad(px + random(30), py + random(30), px-random(30), py-random(30), px+random(30), py+random(30), px - random(30), py - random(30));
    pop();
}
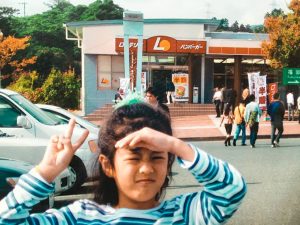
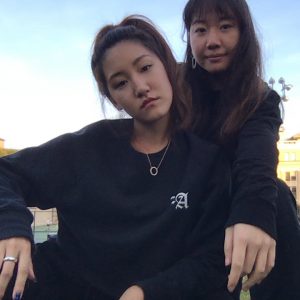
I had a lot of fun doing this project because I had the chance to use my personal photo as a visual element of the project. I chose a photo of me and my friend that we took during the sunset of an afternoon.
![[OLD FALL 2018] 15-104 • Introduction to Computing for Creative Practice](https://courses.ideate.cmu.edu/15-104/f2018/wp-content/uploads/2020/08/stop-banner.png)