Katrina Hu – Project 04 – String Art

sketch_project4

/*Katrina Hu
15104-C
kfh@andrew.cmu.edu
Project-04-String Art*/


function setup() {
    createCanvas(400, 300);
    background(0);
}

function draw() {
    background(0);
    //yellow curve
    for(var i = 0; i < 400; i += 5) {
        stroke(255, 250, 158);
        strokeWeight(0.5);
        line(i, mouseY, 400 , i);
    }
    //green curve
    for(var b = 0; b < 400; b += 5) {
        stroke(167, 255, 158);
        strokeWeight(0.5);
        line(b, mouseX, 400 , b);
    }
    //pink curve
    for(var a = 0; a < 400; a += 5) {
        stroke(255, 158, 158);
        strokeWeight(0.5);
        line(mouseY, a, a, 300);
    }
    //blue curve
    for(var c = 0; c < 400; c += 5) {
        stroke(158, 243, 255);
        strokeWeight(0.5);
        line(mouseX, c, c, 300);
    }
}

This was a fun project to do to experiment with different lines and colors. It was also interesting so see how the lines shifted with the mouse.

lee chu – project 04 – string art

lrchu

// lee chu
// section c
// lrchu@andrew.cmu.edu
// project - 04

var x1 = 0;
var y1 = 0;
var x2 = 0;
var y2 = 0;
var xSpacing;
var ySpacing;
var offset = 5;

function setup() {
    createCanvas(400, 300);
    fill(100);
    strokeWeight(0.25);
    xSpacing = width / 100;
    ySpacing = height / 100;
}

function draw() {
    background(50);
    triangle(0, 0, width, 0, width, height);

    // mouse control
    if (height / 2 < mouseY & mouseY < height) {
        offset = (mouseY - height / 2) / (height / 2) * 30;
    }
    if (height / 2 > mouseY & mouseY > 0) {
        offset = (mouseY - height / 2) / (height / 2) * 30;
    }

    // see functions below
    whiteLines();
    orangeLines();
    cyanLines();
}


function whiteLines() {
    stroke('lightGray');
    x2 = xSpacing * offset;
    y2 = ySpacing * offset;

    // left
    for (var y1 = 0; y1 < height + offset * ySpacing; y1 += ySpacing) {
        line(x1, y1, width + x2, height + y2);
        x2 -= xSpacing;
        y2 -= ySpacing;
    }
    x2 = xSpacing * -offset;
    y2 = ySpacing * -offset;

    // right
    for (var y1 = height; y1 > -offset * ySpacing; y1 -= ySpacing) {
        line(width, y1, x2, y2);
        x2 += xSpacing;
        y2 += ySpacing;
    }
    x2 = 0;
    y2 = 0;
}


function orangeLines() {
    stroke('orange');

    // left
    for (var y1 = 0; y1 < height; y1 += ySpacing) {
        line(x1, y1, width - x2, height - y1);
        x2 += xSpacing;
    }
    x2 = 0;

    // right
    for (var y1 = height; y1 > 0; y1 -= ySpacing) {
        line(width, y1, x2, height - y1);
        x2 += xSpacing;
    }
    x2 = 0;
}

function cyanLines() {
    stroke('cyan');
    x2 = xSpacing * offset;
    y2 = ySpacing * offset;

    // left
    for (var y1 = 0; y1 < height - offset * ySpacing; y1 += ySpacing) {
        line(x1, y1, width - x2, height - y2);
        x2 += xSpacing;
        y2 += ySpacing;
    }
    x2 = xSpacing * offset;
    y2 = ySpacing * offset;

    // right
    for (var y1 = height; y1 > offset * ySpacing; y1 -= ySpacing) {
        line(width, y1, x2, y2);
        x2 += xSpacing;
        y2 += ySpacing;
    }
    x2 = 0;
    y2 = 0;
}

I wanted to create a sense of depth by offsetting line functions and including contrasting yet complementary colors. An interesting aspect is that the colors seem to shift as the lines change in overlap.

Mari Kubota- Project 04- String Art

sketch">

/*  Mari Kubota
    49-104 Section D
    mkubota@andrew.cmu.edu 
    Assignment 4
*/

function setup(){
	createCanvas(400,300);
	background (0);
	
	//left white crossed lines
    stroke(255);
    var yl = height*(5/6);
    var ym1 = height*(6/8);

    for(var i=0; i < 15; i++){
        line(0, yl, width/2, ym1);
        yl *=0.97;
        ym1 *= 1.02+mouseX;
    };

    //right white crossed lines
    var yr = height*(5/6);
    var ym2 = height*(6/8);

    for(var i=0; i < 15; i++){
        line(width, yr, width/2, ym2);
        yr *=0.97;
        ym2 *= 1.02;
    };

//diamond 
    stroke(255);

//bottom vertical lines
    var w1= width/4;
    for (var x=w1; x<width*(3/4); x+=14){
        line (x,height/2,width/2,height*(5/6));
    }

//upper left lines
    var w2= width/3;
    var w4= width/2;
    for (var y=height/3; y<height/2; y+=7){
        line (width/4,height/2, w2, y); 
        w2+=5;

        line (width/2-30,height/2, w2-5, height/3); 
        line (width/2-30, height/2, w4, height/3);
        w4-=4;
    }

//upper right lines
    var w3= width*(2/3);
    var w5= width/2;
    for (var y=height/3; y<height/2; y+=7){
        line (width*(3/4),height/2, w3, y); 
        w3-=5;

        line (width/2+30, height/2, w3+5, height/3); 
        line (width/2+30, height/2, w5, height/3);
        w5+=4;
    }

//upper center criss cross lines
    var w6= width/2;
    for (var y=height/3; y<height/2; y+=7){
        line (width/2-30, height/2, w6, y);
        w6+=4;
    }    
    var w7= width/2;
    for (var y=height/3; y<height/2; y+=7){
        line (width/2+30, height/2, w7, y);
        w7-=4;
    }

	
//top of diamond
	line (width/3, height/3, width*(2/3),height/3);

}


In this project I created a diamond out of string out. The numerous lines were made from for loops and line shapes. The challenging part of this project was making the lines in the diamond match up into a cohesive shape.

Ian Kaneko-Project-04-String-Art

I really wanted to show huge amounts of contrast in my drawing, so I made the strings and background always be opposite of each other in terms of gray value. This also leads to a cool middle point where they are the same color.

ikaneko string art

//Ian Kaneko
//Project 4: String Art

var canvasWidth = 300;
var canvasHeight = 400;
var bkgrnd = 250;
var change = -1;

function setup() {
    createCanvas(canvasWidth, canvasHeight);
    
} 

function draw() {
    background(bkgrnd);
    
    strokeWeight(1);
    
    stroke(250 - bkgrnd);

    bkgrnd = bkgrnd + change;

    if(bkgrnd <= 0){
        change = -change;
    }

    if(bkgrnd > 250){
        change = -change;
    }


    for (i = 0; i < 50; i ++){ //diamond forms created by negative space
        line(0, 100 + i * 6, 300, 100 - i * 6); 
    }
    
    for (i = 0; i < 50; i ++){
        line(0, 300 - i * 6, 300, 300 + i * 6);
    }
    
    for (i = 0; i < 50; i ++){
        line(0, 100 - i * 6, 300, 100 + i * 6);
    }

    for (i = 0; i < 50; i ++){
        line(0, 300 + i * 6, 300, 300 - i * 6);
    }

    stroke(150, 100, 150); // colored borders

    for (i = 0; i < 40; i ++){ // purple "web" on top left
        line(0, 200 - 5 * i, i * 5, 0);
    }

    stroke(150, 100, 210);
    for (i = 0; i < 40; i ++){ // purple bottom right web
        line(0, 200 + 5 * i, i * 5, 400);
    }

    stroke(210, 100, 150); // top right web
    for (i = 0; i < 40; i ++){
        line(300, 200 - 5 * i, 300 - i * 5, 0);
    }

    stroke(210, 100, 210); // bottom right web
    for (i = 0; i < 40; i ++){
        line(300, 200 + 5 * i, 300 - i * 5, 400);
    }


}

Xiaoyu Kang – Project 04 – String Art


sketch

//Xiaoyu Kang
//xkang@andrew.cmu.edu
//Section B
//Project-04

var color = 10;
function setup() {
    createCanvas(400,300);
}

function draw() {
	background("black");
	for (var i = 0; i < width; i += 12){
	//curve set 1
        stroke(255,200 + i, mouseX);
        strokeWeight(1);
        line(i + mouseX,0, 0,300);
        line(i - mouseX,0,400,300);
    //curve set 2
        stroke(255,100 + i,200);
        strokeWeight(1);
        line(0,0,i + mouseX,400);
        line(400,0,i - mouseX,400);
    }
    for (var i = 0; i < width; i += 15){
    //curve set 3
        stroke(10,mouseX,255);
        strokeWeight(1);
        line(0 - i, height - mouseX, width + 1, i + mouseY);
        line(0 - i, height - mouseX, width + i, i - mouseY);
    //curve set 4
        stroke(10,mouseY,255);
        strokeWeight(1);
        line(width + i, height - mouseX, 0 - 1, i + mouseY);
        line(width + i, height - mouseX, 0 - 1, i - mouseY);
    }

}

For this project, I attempted weave different sets of strings together to create a complete image. I tried to link the string art’s color and position with the position of the mouse. So as the mouse moves, the strings’ position will be influenced by the mouse and will change color.

Cathy Dong-Project-04-String Art


sketch

/* Cathy Dong
   Section D
   yinhuid
   Project 4-String Art
*/

var sqColor;
var backColor;

function setup() {
	createCanvas(400, 300);
	
}

function draw() {
	background(0);
	//change background color based on mouseY location
	if (mouseY < height / 2) {
		backColor = 'black';
	}
	else if (mouseY >= height / 2) {
		backColor = 'gray';
	}
	//turn background to white when mouse is pressed
	if (mouseIsPressed) {
		backColor = 'white';
	}
	noStroke();
	fill(backColor);
	rectMode(CORNER);
	rect(0, 0, width, height);

	//create a grid of rectangles
	//rectangle color changes based on mouseX
	for (var s = 20; s <= width; s += 30) {
		for (var t = 15; t <= height; t += 30) {
			if (mouseX < width / 2) {
				sqColor = 'gray';
			}
			else if (mouseX >= width / 2) {
				sqColor = 'black';
			}
			noStroke();
			fill(sqColor);
			rectMode(CENTER);
			rect(s, t, 20, 20);	
		}
		
	}
	//lines from mouse to top
	for (var n = 0; n <= width; n += 10) {
		stroke('lightBlue');
		strokeWeight(1);
		line(mouseX, mouseY, n, 0);
	}

	//lines from mouse to bottom
	for (var p = 0; p <= width; p += 10) {
		stroke('lightBlue');
		strokeWeight(1);
		line(mouseX, mouseY, p, height);
	}

	//lines from mouse to left
	for (var q = 0; q <= height; q += 10) {
		stroke('lightBlue');
		strokeWeight(1);
		line(mouseX, mouseY, 0, q);
	}

	//lines from mouse to right
	for (var r = 0; r <= height; r+= 10) {
		stroke('lightBlue');
		strokeWeight(1);
		line(mouseX, mouseY, width, r);
	}

	//curve with lines from top to right (controled by mouseX)
	for (var i = 0; i <= mouseX; i += 3) {
		stroke(255);
		strokeWeight(.5);
		line(i, 0, width, i);
	}
	//curve with lines from right to bottom (controled by mouseY)
	for (var j = 0; j <= mouseY; j += 3) {
		stroke(255);
		strokeWeight(.5);
		line(width, j, width - j, height);
	}
	//curve with lines from bottom to left (controled by mouseX)
	for (var k = 0; k <= mouseX; k += 3) {
		stroke(255);
		strokeWeight(.5);
		line(width- k, height, 0, height - k)
	}
	//curve with lines from left to top (controled by mouseY)
	for (var m = 0; m <= mouseY; m += 3) {
		stroke(255);
		strokeWeight(.5);
		line(0, height - m, m, 0);
	}

	//draw foco point
	stroke(255);
	strokeWeight(2);
	push();
	line(mouseX / 8 * 7, mouseY, mouseX / 8 * 9, mouseY);
	line(mouseX, mouseY / 8 * 7, mouseX, mouseY / 8 * 9);
	pop();

}

In this project, I used loops to create curves with lines and rectangle grids. All lines changed based on mouse location. The background color also changed when mouse is clicked or moved.

Jasmine Lee – Looking Outwards – 04

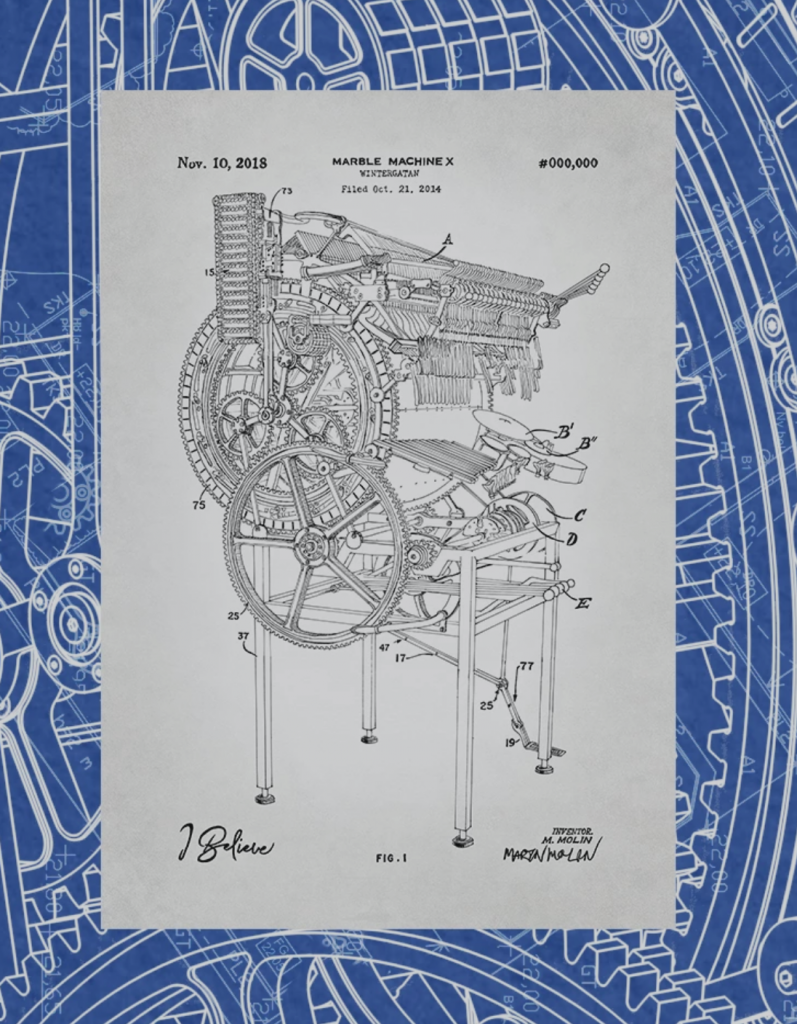
A great example of music and computation is Wintergatan‘s Marble Machine. The music is visualized physically using metal marbles running on a track. These marbles are carried up using a wheel (physically operated by the musician), dropping onto various surfaces such as vibraphone, bass guitar, and cymbals. Other instruments, such as the the kick drum and snare drum are emulated using contact microphones and other software. The music “scores” are actually two giant wooden wheels arranged with LEGO pegs. These pegs, when turning, knock into specific keys which then trigger the release of a marble above a certain vibraphone key.

The person responsible for the machine, Martin Molin, designed and built the machine with the use of a 3D printer and a CNC machine. While not purely a computational project, this project involves the use of computers for the purpose of emulating drums as well as overlaying the music tracks onto each other. It is also computational in the sense that this machine and its parts all had to be carefully calculated and coordinated in order to work. What I admire most about this project is the way in which Molin chose to design the machine. It could’ve been very possible to manifest it as a linear marble track, but Molin chose to design a self-contained machine in which the loop of the marbles is closed. It is also amazing to see the actual physical movements behind the sound that is being produced.

Wintergatan sells blueprint posters of their “Marble Machine” in light of their success with this project.

Jamie Park – Project 04 – String Art

sketch

//Jamie Park           jiminp@andrew.cmu.edu
//15-104          Section E        Project 4

function setup(){
    createCanvas(400, 300);
}

function draw(){
    background(0);

    //random number variable to assign value for colors and coordinate location
    var x = 100;
    var y = 170;
    var z = 50;

    //variable newX and newY to constrain mouseX and mouseY movement to the canvas
    var newX;
    newX = constrain(mouseX, 0, width);
    var newY;
    newY = constrain(mouseY, 0, height);

    //lines for the string art -- are color & mouse location-sensitive
    for (var i = 0; i < width; i+= 8){

        stroke(mouseY, mouseX, x); //central 2 curves that go from top to bottom
        strokeWeight(0.5);
        line(i, newX, newX, i);
        line(i, newY, y, i);

        stroke(mouseX, y, mouseY); //central 3 curves that go from left to right
        line(newX, i, i, z);
        line(i, newY, newX, i);
        line(i, y, newY, i);

        stroke(z, mouseY, mouseX); //bottom left corner lines that overlap
        line(y * 5, i, i, newX);
        line(i, newY, x * 5, i);

        stroke(mouseX, x, y); //top left corner lines that overlap
        line(-x, i, i, newY);
        line(newX, i, i, newX);

        stroke(z, y, mouseY); //very central subtle curve
        line(newY, i, i, y * 2);

        stroke(mouseX, mouseX, y); //top right coner line
        line(i, newX, newY, i);

        stroke(mouseX, mouseY, mouseY); //very left stroke that goes across the width of the canvas
        line(x, i, i, newY);
    }
}

Initially, I was a bit confused with how I should be coding this project. But I became confident after visiting Office Hours and talking to my friends. I added some fun to my code by manipulating colors and location of the curves based on mouseX and mouseY.

Jamie Park – Looking Outwards – 04

Video of Weather Thingy on its official website

Adrien Kaeser demonstrating Weather Thingy (2018)

Weather Thingy, 2018, by Adrien Kaeser

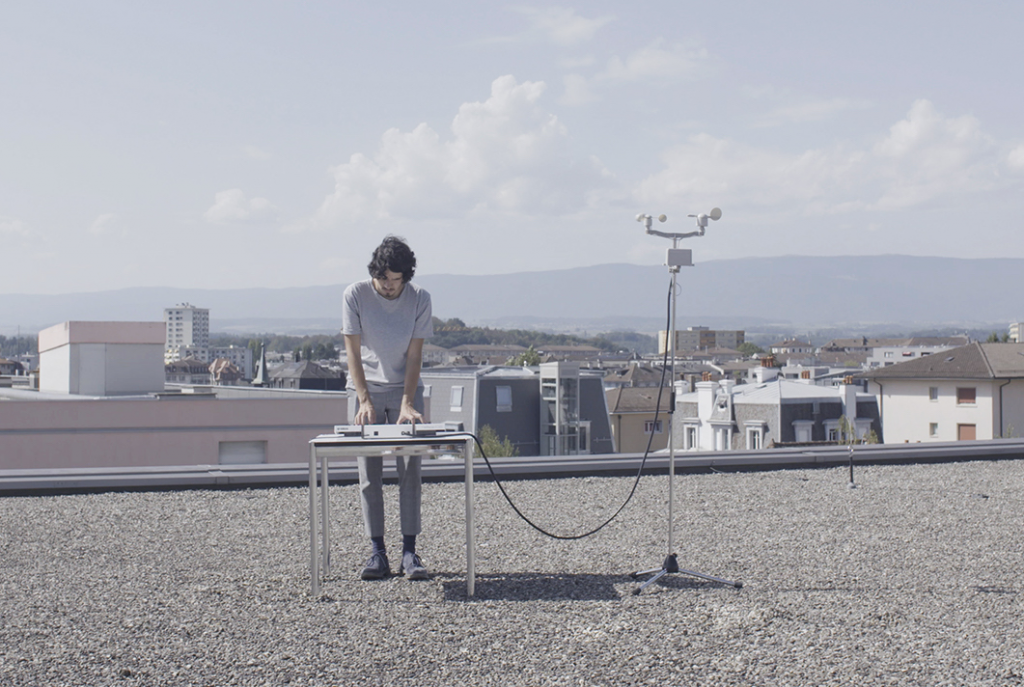
Weather Thingy (2018) is a controller that builds sound using real time climate-related events. The device, composed of weather station on a tripod microphone and a custom built controller, transforms climatic data into midi data, which is then interpreted by programmed instruments. The user can also manipulate the midi channel to modify the effects. The most significant part of Weather Thingy is that it is updated live. When you watch the demo video of the device, wind, sunlight and water have different impacts on the music, creating a unique melody that could not be heard on any other time of the day.

According to the author of the post, the device is coded with Arduino, C++, and midi protocol. Although I have no experience using the three languages, I am thrilled to know that one can use coding to generate sound. Overall, I think it was very creative of Kaeser to convert weather data into melody. It must have been a lot of work and effort with a proper understanding of music, and I admire Kaeser for it.

Joseph Zhang – Project 04 – E

sketch

// Joseph Zhang
// Section E
// haozhez@andrew.cmue.edu
// Project-04: String Art

function setup() {
    createCanvas(400, 300);
    background(0,0,0);
}

function draw(){

    // formation 1 (center)
    push();
    translate(50,0);
    lineArt();
    pop();

    // formation 2 (right)
    push();
    translate(350,0);
    lineArt();
    pop();

    // formation 3 (left)
    push();
    translate(-250,0);
    lineArt();
    pop();
}

//creates one 300x300 square formation
function lineArt(){
    blue = 0;
    green = 20;
    red = 170;
    strokeWeight(.3);

    // create top right and bottom left lines
    for(i = 0; i < 300; i = i + 10){
        stroke(red, green, blue);
        line( 0, i, i, 300);
        line( 300, i, i, 0);

            // randomize colors
        red = random(0,100);
        green = random(0,255);
    }
    
    // create top left and bottom right lines
    oppCount = 0;
    for(i = 300; i > 0; i = i - 10){
        stroke(red, green, blue);   
        line( i, 0, 0, oppCount);
        line( 300, i, oppCount, 300);
        oppCount += 10;
        blue +=10;
    }
}

In this project, I wanted to experiment with how form, color and temporal speed can interact with each other to create something that feels electric. The algorithm was pretty simple; depending on the position, I increased/decreased the x and y positions at the same speed to create a consistent web effect. More detail can be seen in the file comments.