![[OLD FALL 2019] 15-104 • Introduction to Computing for Creative Practice](../../../../wp-content/uploads/2020/08/stop-banner.png)
//alcai@andrew.cmu.edu
//alice cai
//section E
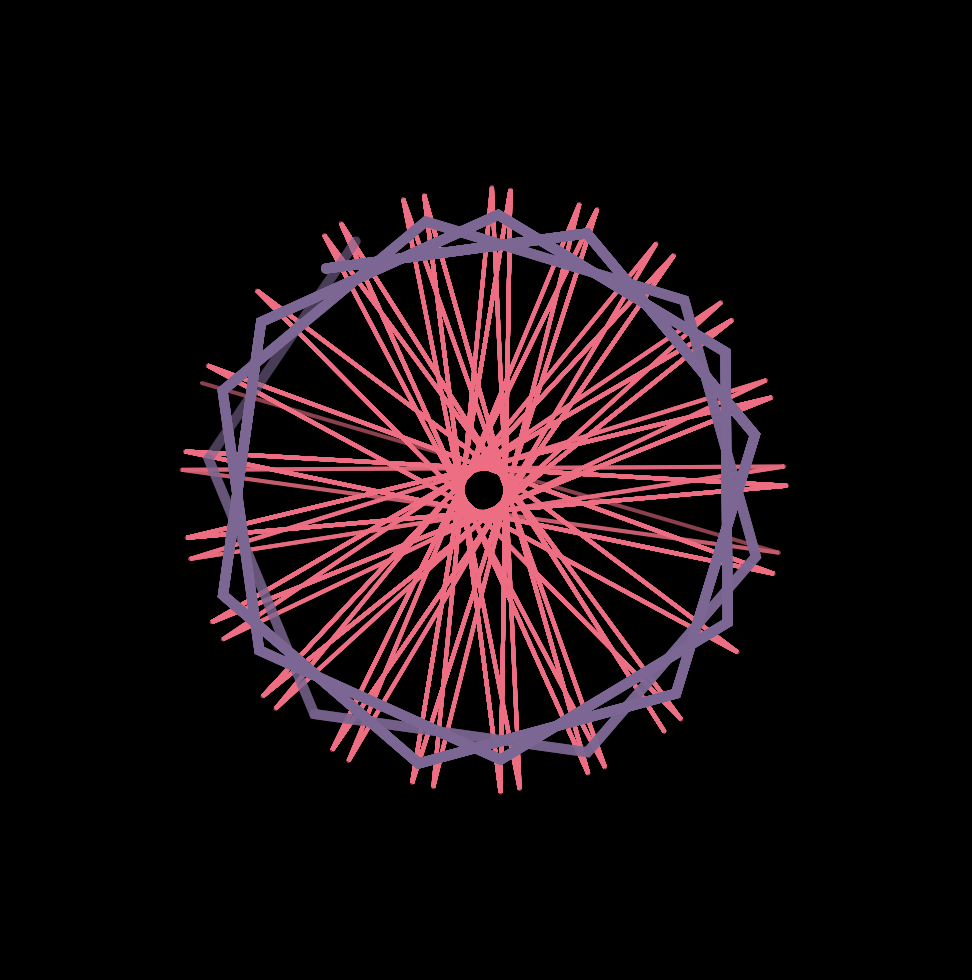
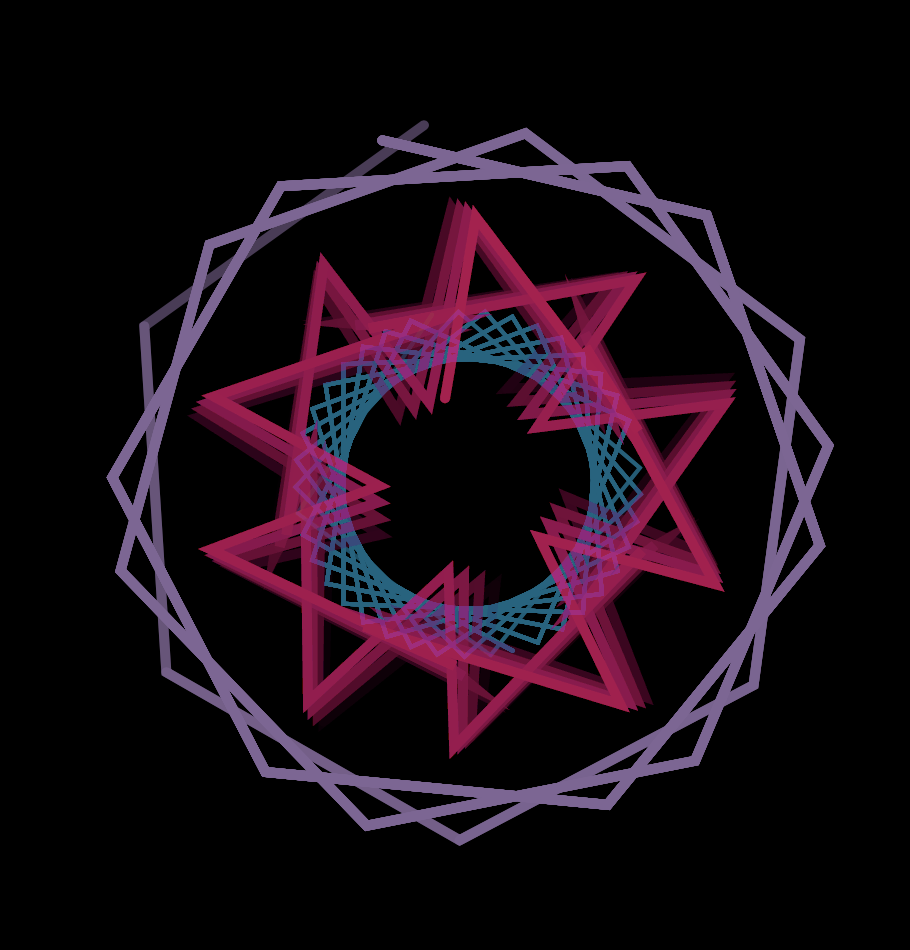
//Project Week 7
//spinning speed
var speed = 0;
function setup() {
createCanvas(500,500);
}
function draw() {
frameRate(30);
background('black');
push();
//draw at middle of canvas
translate(width/2, height/2);
//rotate speed, rotates on its own but also adjusted by mouse X
rotate(speed + mouseX, 0, 200, 0, TWO_PI);
speed = speed + 1;
//call droid draw functions
epicycloid();
astroid();
epitrochoid();
pop();
}
function epicycloid(){
noFill();
strokeWeight(2);
stroke(mouseX, 100, 130,150);
beginShape();
//defining variables, size is corntroled by mouseX/mousY
a = map(mouseX, 0, width, 50,300);
b = map(mouseY, 0, width, 50,300);
//forloop that repeats shape
for (var t = 0; t < 40; t ++) {
var x = (a / (a + 2 * b)) * cos(t) - b * cos(((a + b) / b) * t);
var y = (a / (a + 2 * b)) * sin(t) - b * sin(((a + b) / b) * t);
vertex(x ,y);
endShape();
}
}
function epitrochoid (){
noFill();
strokeWeight(5);
stroke(200,10,100, 5);
beginShape();
//forloop that repeats shape
for (var i = 0; i < 100; i ++) {
//defining variables, size is corntroled by mouseX/mousY
a = map(mouseX, 0, width, 50,300);
b = map(mouseX, 0, width, 50,300);
h = map(mouseX, 0, width, 50,200);
x = (a + b) * cos(i/2) - (h * cos((a + b / b) * i));
y= (a + b) * sin(i/2) - (h * sin((a + b / b) * i));
vertex(x, y);
endShape();
}
}
function astroid(){
noFill();
strokeWeight(5);
stroke(130, 100, 150,150);
beginShape();
//forloop that repeats shape
for (var t = 0; t < 20; t ++) {
//defining variables, size is corntroled by mouseX/mousY
z = map(height - mouseY, 0, width, 50,200);
var x = z * cos(t)^ 3 ;
var y = z * sin (t)^ 3 ;
vertex(x ,y);
endShape();
}
}This project seemed really daunting because all the shapes looked complex and there was a lot going on on the screen, especially those with mouse interaction. Turns out, it’s not as complex as it seems. Although the equations may seem complex, they are also given to us. After that, it’s just about defining the variables in the equation and calling a for loop to draw a pattern with the shape! I used a map function to control the size of the shape with mouseX and mouseY. I also changed the opacity of the line strokes for a more transparent and three-dimensional looks.