Sean Meng – Project – 07 – Curves

hmeng-project 07

//Sean Meng
//hmeng@andrew.cmu.edu
//Section C
//Project-07-Curves

function setup() {
    createCanvas(480, 480);

}

function draw() {
    background(0);

//Rotate the Epicycloid curve at canvas center point   
    push();    
    translate(width / 2, height / 2);
//Constrain and remap mouseX and mouseY value   
    var X = constrain(mouseX, 0, 480);
    var Y = constrain(mouseY, 0, 480);
    var c1 = map(mouseX, 0, 480, 0, 255);
    var c2 = map(mouseX, 0, 480, 0, 255);
//Define the radius of two circles that generate the Epicycloid curve
    var R = map(X, 0, width, 0, 200);
    var r = map(Y, 0, height, 0, 60);
//Change the stroke color as mouseX moves along the canvas 
    stroke(c1, 200, c2);
    noFill();
    beginShape();
    rotate(radians(X));
//Draw the first Epicycloid curve
    for(var angle = 0; angle < 360; angle += 2.5){
        CrvY = (R + r) * sin(angle) - r * sin((R + r) * angle / r);
        CrvX = (R + r) * cos(angle) - r * cos((R + r) * angle / r);
        curveVertex(CrvX, CrvY);
    }
    endShape();
    pop();


    push();
    
    translate(width / 2, height / 2);
    stroke(255);
//Constrain and remap mouseX and mouseY value 
    var X = constrain(mouseX, 0, 480);
    var Y = constrain(mouseY, 0, 480);
    var c3 = map(mouseX, 0, 480, 0, 255);
    var c4 = map(mouseX, 0, 480, 0, 255);
//Define the radius of two circles that generate the Epicycloid curve
    var R1 = map(X, 0, width, 0, 300);
    var r1 = map(Y, 0, height, 0, 60);
//Change the stroke color as mouseX moves along the canvas 
    stroke(c3, c4, 200);
    noFill();
    beginShape();
    rotate(radians(- X));
//Draw the second Epicycloid curve
    for(var angle = 0; angle < 360; angle += 4){
        CrvY1 = (R1 + r1) * sin(angle) - r1 * sin((R1 + r1) * angle / r1);
        CrvX1 = (R1 + r1) * cos(angle) - r1 * cos((R1 + r1) * angle / r1);
        curveVertex(CrvX1, CrvY1);
    }

    endShape();
    pop();    
}

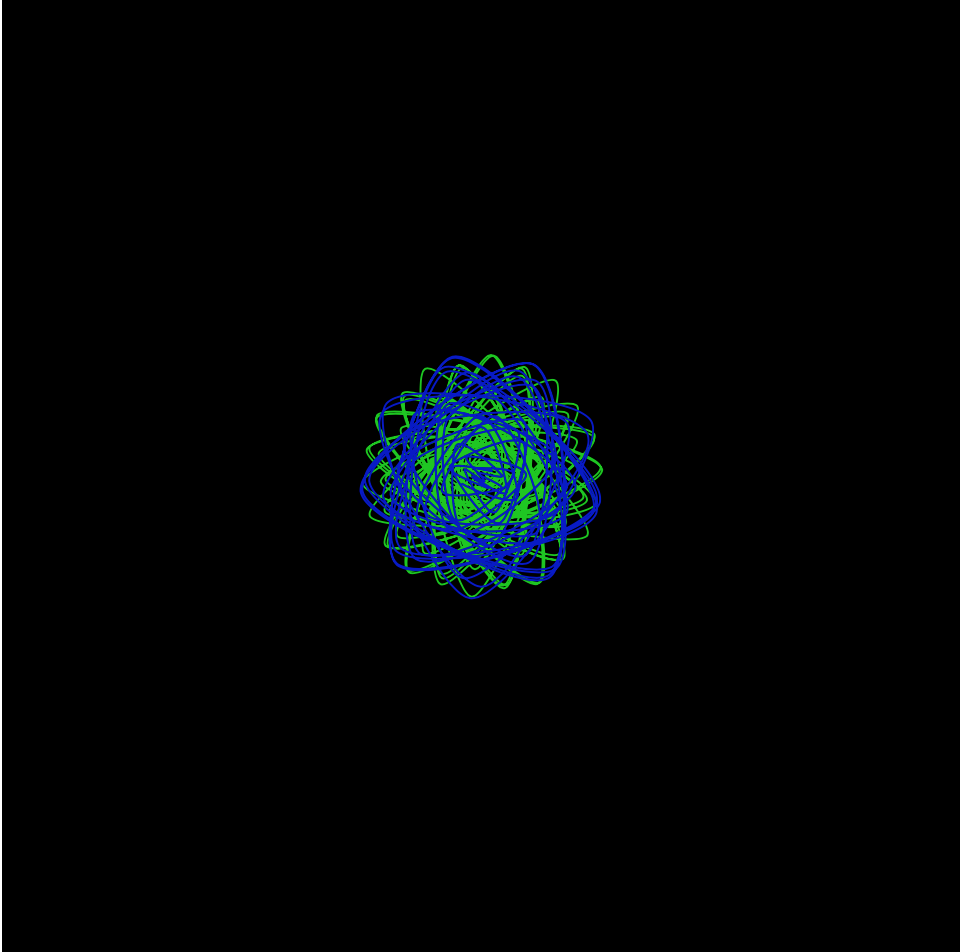
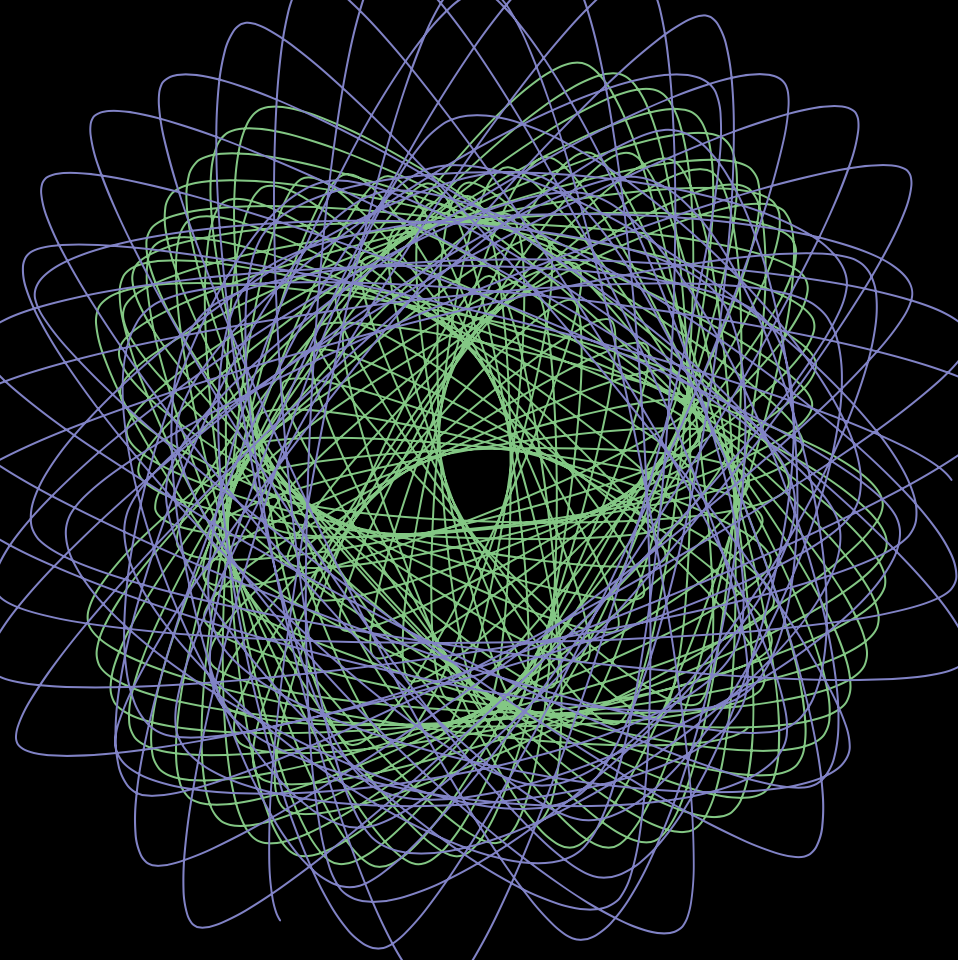
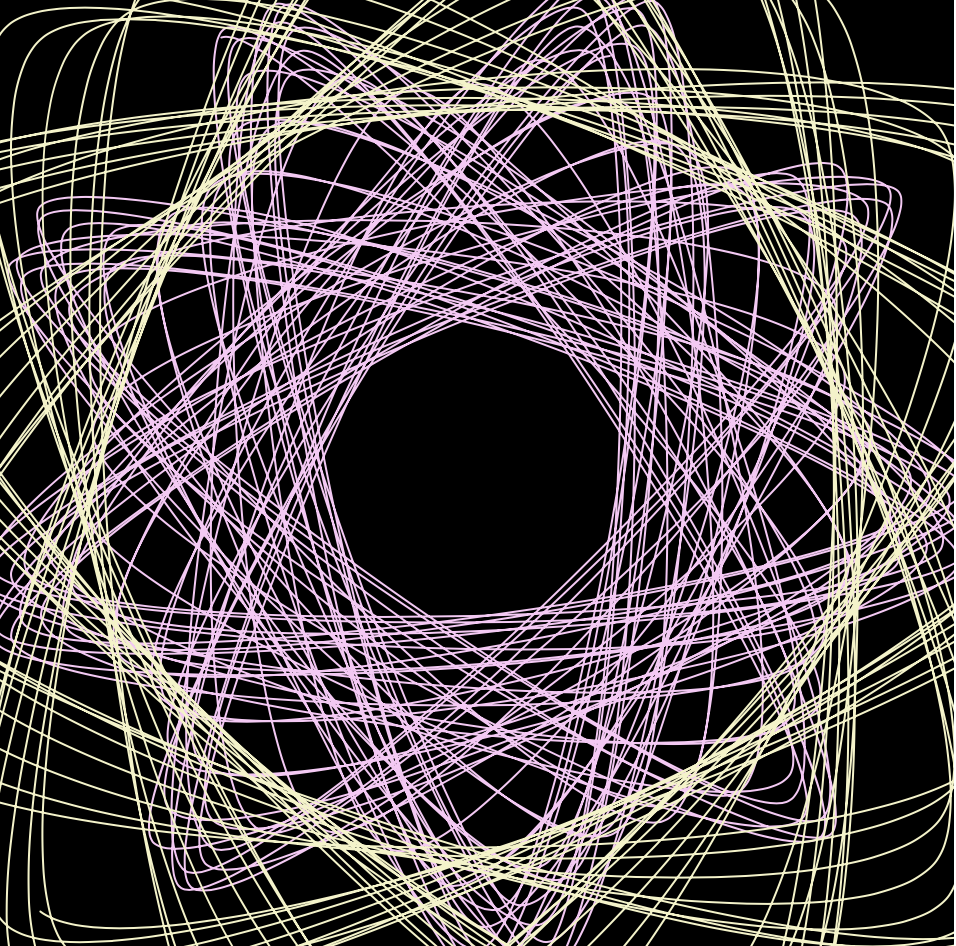
In this project, I found it interesting to generate dynamic parametric drawing by understanding the mathematical equation of the epicycloid or hypercycloid, which is a plane curve produced by tracing the path of a chosen point on the circumference of a circle, which rolls without slipping around a fixed circle. Also, the variability of epicycloid itself is very flexible. By controlling variables such as the radius of the driving circle and the angle interval between each curve, the output image can be parametric and dynamic.

Epicycloid equation:

{\displaystyle x(\theta )=(R+r)\cos \theta \ -r\cos \left({\frac {R+r}{r}}\theta \right)}
{\displaystyle y(\theta )=(R+r)\sin \theta \ -r\sin \left({\frac {R+r}{r}}\theta \right),}
mouseX = 0 mouseY = 240
mouseX = 240 mouseY = 240
mouseX = 460 mouseY = 460

Sean Meng – Looking Outwards – 07

Northeast FAA Data Visualization
Aaron Koblin
Link: http://www.aaronkoblin.com/work/flightpatterns/index.html

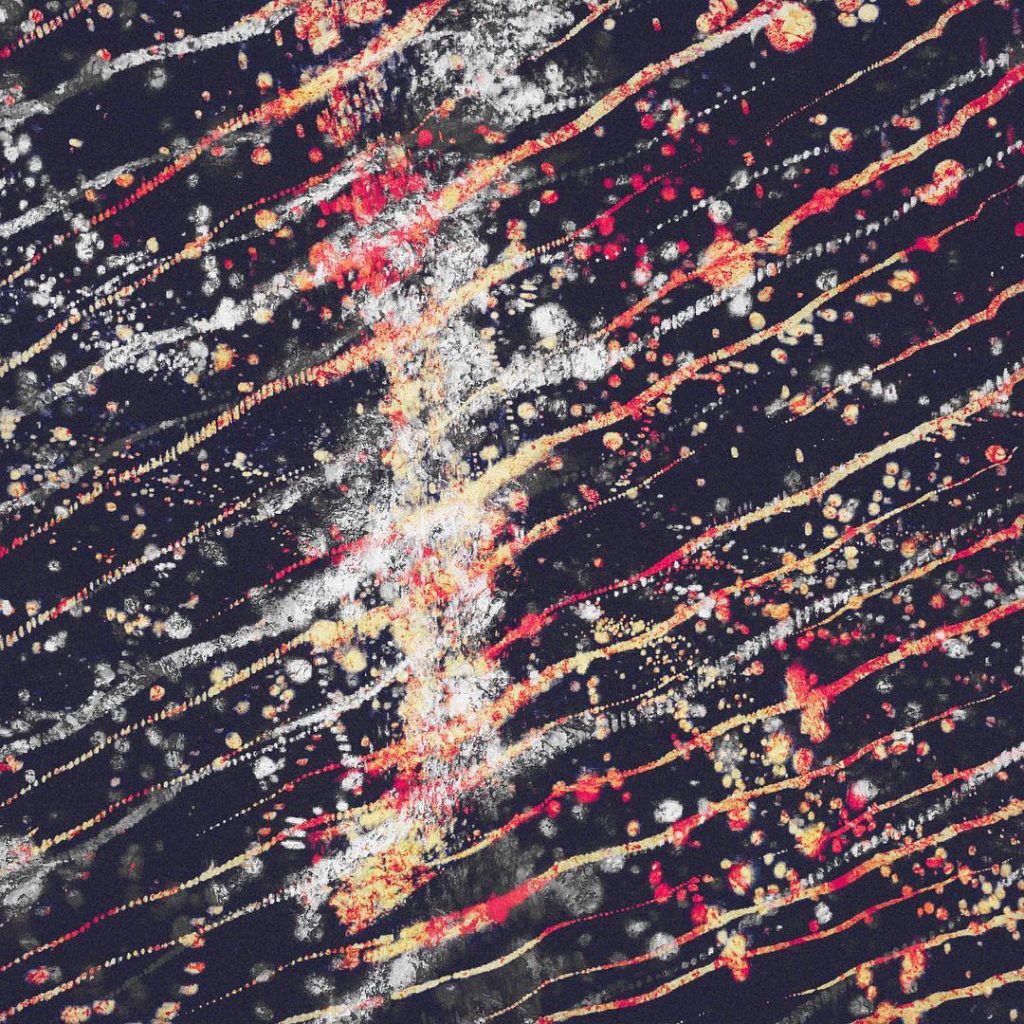
The Flight Patterns visualizations are the result of experiments leading to the project Celestial Mechanics by Scott Hessels and Gabriel Dunne. FAA data was parsed and plotted using the Processing programming environment, which is a flexible software sketchbook and a language for learning how to code within the context of the visual arts. And the frames were composited with Adobe After Effects and/or Maya. The project does not only represent data visually but also experiments with the possibility of representation technique. As a result, the outcome turns out to be more than just information but is also informative art piece that has aesthetic value. 

Sean Meng-Project 06-Abstract Clock

hmeng-project 06

//Sean Meng
//Section C
//hmeng@andrew.cmu.edu
//Project-06-Abstract Clock

function setup() {
    createCanvas(500, 500);   
}

function draw() {
    background(214, 200, 224);
//define current time   
    var S = second();
    var M = minute();
    var H = hour();
    var round = 2 * PI;
    var angle = 0;
//convert time value to radian angles
    var ratioS = S / 60;
    var ratioM = M / 60;
    var start0 = 0;
    var start = PI + HALF_PI;
    var size1 = 200;
//diameters of the arc
    var D1 = 200;
    var D2 = 220;
    var D3 = 170;
    var D4 = 120;
    var D5 = 80;
    
    noStroke();
//Second plate graphics
    fill(255, 216, 224);  //Light pink
    ellipse(180, 180, size1 * ratioS, size1 * ratioS);
    fill(255, 186, 224);  //Pink
    ellipse(210, 150, 100 * ratioS, 100 * ratioS);
    fill(255, 136, 204);  //Dark pink
    ellipse(150, 220, 55 * ratioS, 55 * ratioS);
//Second inner ring
    stroke(200, 64, 150);  //Magenta
    strokeWeight(15 * ratioS);
    noFill();
    arc(180, 180, D1, D1, start, start + round * ratioS);
//Second outter ring
    stroke(255);
    strokeWeight(4 / 60 * S);
    arc(180, 180, D2, D2, start, start + round  * ratioS);
//Second starting line
    fill(255);
    rect(175, 0, 5, 90);

//Minute plate
    stroke(255, 242, 255);  //Light purple
    strokeWeight(5);
    noFill();    
//Minute ring1
    arc(350, 310, D3, D3, start0, round);
    stroke(255, 215, 85);  //Yellow
    strokeWeight(30 * ratioM);
    arc(350, 310, D4, D4, start0, round * ratioM);
//Minute ring2    
    stroke(255, 235, 135);  //Light yellow
    strokeWeight(10 * ratioM);
    arc(350, 310, D4, D4, start0, round * ratioM); 
//Minute starting line
    noStroke();
    fill(255, 242, 255);
    rect(425, 305, 100, 10);

//Hour plate
    fill(255);
    ellipse(200, 390, D5, D5);

//12 Hour operator
    if(H > 12) {
        for(var i = 0; i < H - 12; i += 1){
            fill(151, 59, 227);
            ellipse(200, 320 + i * 15, 10, 10);
        }
    } else {
        for(var i = 0; i < H; i += 1){
            fill(151, 59, 227);
            ellipse(200, 320 + i * 15, 10, 10);
        }
    }

}

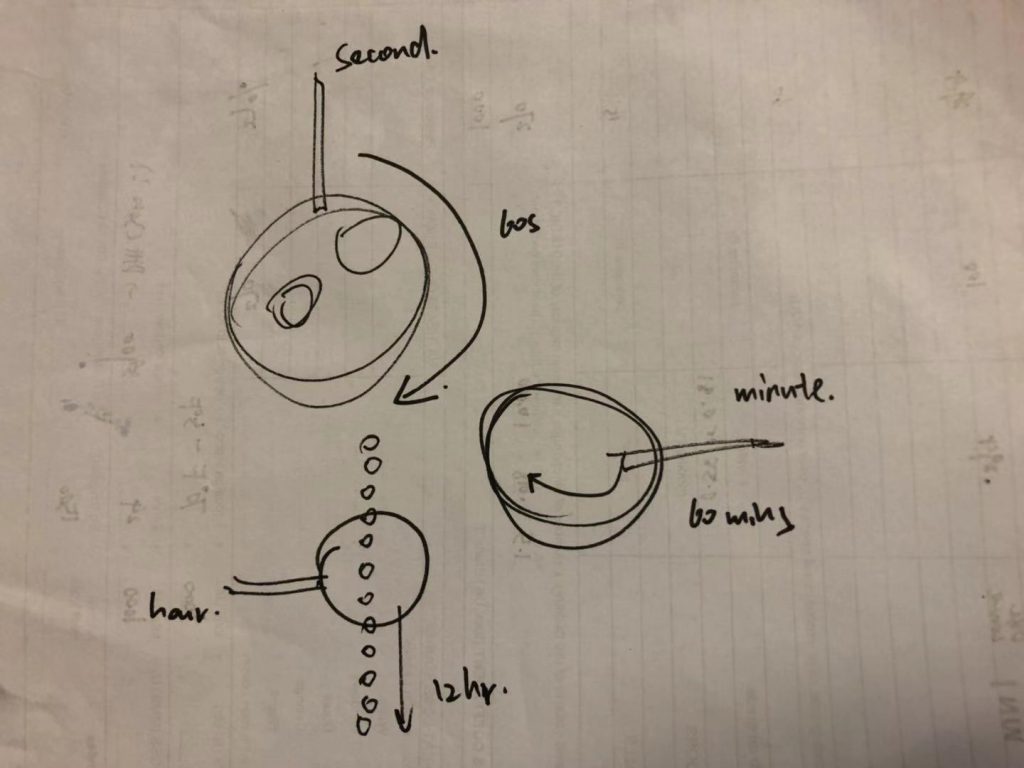
In this project, I explores the representation and abstraction of the clock by engaging geometries and colors. And visualizing the variation of time in a more creative way.

Sean Meng-Looking Outwards-06

Vladimir Kanic’s filmmaking artwork
“Art concept that uses chaos theory and randomness to create structured art.”
Link: https://www.youtube.com/watch?v=Krgp_QwfEJo

Transmedia filmmaking artist Vladimir Kanic used chaos theory* as a filmmaking tool and explored how a film can be made by using randomness as its principal structural language. In order to perform the process, the artist and his team have devised a concept of the Magic box, designed to serve as a model system of randomness. Twelve boxes were given to randomly chosen art directors, and each one had to put a random number of objects inside, seal the box and not disclose the contents to anyone. A group of random people set the boxes into a completely unorganized stash, and the artist had to choose one and pick it up on a random day. Since the artist didn’t know what kind of a film is going to be created, its structural language and technique were decided by observing and measuring randomness that emanated from the objects concealed in the box. The project and methodology explores how randomness can be define in multiple dimensions and how to engage people to interact with randomness and how the final work that had been generated can be unpredictable at the beginning.

Sean Meng-Project 05- Wall paper

hmeng-project 05

//Sean Meng
//Section C
//hmeng@andrew.cmu.edu
//Project-05-Wall paper

var xS = 55;//define x spacing for each feather
var yS = 65;//define y spacing for each feather

function setup() {
    createCanvas(600, 600);  
 
}

function draw() {
	background(0);
    
    for(var x = 1; x <= 8; x += 1){
        for(var y = 1; y <= 7; y += 1){           
            //draw feathers on the even number rows
            if(y % 2 == 0){
                stroke(255);
                strokeWeight(0.5);
                //the branches of the feather
                line(x * xS, y * yS + 30, x * xS, y * yS + 500)
                //outter green part of the feather
                fill(31, y * 30, 111);//color gradiant from blue to green
                ellipse(x * xS, y * yS, 30, 60);
                //inner yellow layer of the feather
                fill(242, 250, 130);
                ellipse(x * xS, y * yS + 8, 20, 40);
                //inner orange layer of the feather
                fill(255, 163, 51);
                ellipse(x * xS, y * yS + 8, 15, 30);
                //inner light blue layer of the feather
                fill(51, 228, 255);
                ellipse(x * xS, y * yS + 14, 10, 10);
                //inner dark blue layer of the feather
                fill(17, 24, 214);
                ellipse(x * xS, y * yS + 12, 7, 7);

            } 
            //draw feathers on the odd number rows
            else if(x <= 9){
                stroke(255);
                strokeWeight(0.5);
                //the branches of the feather
                line(x * xS + xS / 2, y * yS - 20, x * xS + xS / 2, y * yS - 500)
                fill(y * 50, 196, 111);//color gradiant from green to orange
                ellipse(x * xS + xS / 2, y * yS, 20, 40);
            }            
        }
    }

    
}

The drawing is inspired by the repeating pattern of peacock feather. By adding layers of color, gradient and shape, the form of the feather can be abstracted as wall paper

Sean Meng-Looking Outwards-05

Miquela Sousa
video: https://www.youtube.com/watch?v=w1wjiQ0bqic

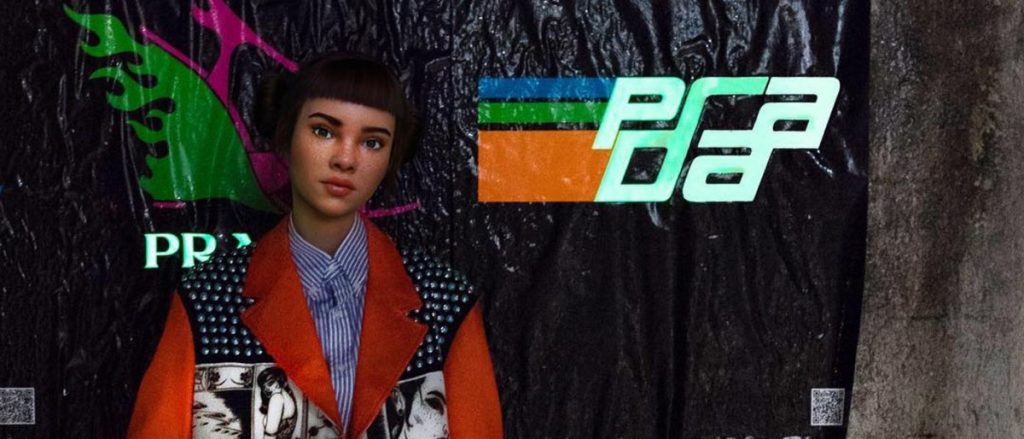
Miquela Sousa, better known as Lil Miquela machuca, is a fictional character and digital art project. Miquela is an Instagram model and music artist claiming to be from Downey, California. The project began in 2016 as an Instagram profile. By April 2018, the account had amassed more than a million followers by portraying the lifestyle of an Instagram it-girl over social media. The account also details a fictional narrative which presents Miquela as a sentient robot in conflict with other digital projects. The team engaged artificial intelligent 3D graphic  while creating and modeling this figure to Make it ultra realistic. Now, the project set a new trend for fashion field to start using fictional computational generated model for their campaign and lookbook. This is also the sign of the overlaps between technology and fashion. 

Sean Meng-Project 04-String Art

hmeng assignment-03-A

//Sean Meng
//Section C
//hmeng@andrew.cmu.edu
//Project-03-String-Art

function setup() {
    createCanvas(400, 300);    
}

function draw() {
	background(0);
    
    for(var i = 0; i <= 400; i += 10){
 //the darkest blue lines
        stroke(0, 0, 255);
    	line(i, 0, 400, i);
//second layer of blue lines with lighter color
    	stroke(100, 100, 255);
    	line(i, 50, 400, i);
//third layer of blue lines with ligher color
    	stroke(150, 150, 255);
    	line(i, 100, 400, i);
//the lightest blue lines
    	stroke(200, 200, 255);
    	line(i, 150, 400, i);
 //the darkest red lines
    	stroke(255, 0, 0);
    	line(i, 300, 0, i);
 //second layer of red lines
    	stroke(255, 100, 100);
    	line(50, i, i, 300);
 //third layer of red lines
    	stroke(255, 150, 150);
    	line(100, i, i, 300);
 //the darkest blue lines
    	stroke(255, 200, 200);
    	line(150, i, i, 300);
    }
    
}

In this project, I intended to create a wavy graphic using string art form. I was also experimenting with visual readability and hierarchy by adding different tones of color and complementary colors to the graphics.

Sean Meng-Looking Outwards-04

Aders Lind generating sounds by appraoching to the LINES

link: https://cycling74.com/projects/lines-interactive-sound-art-exhibition/

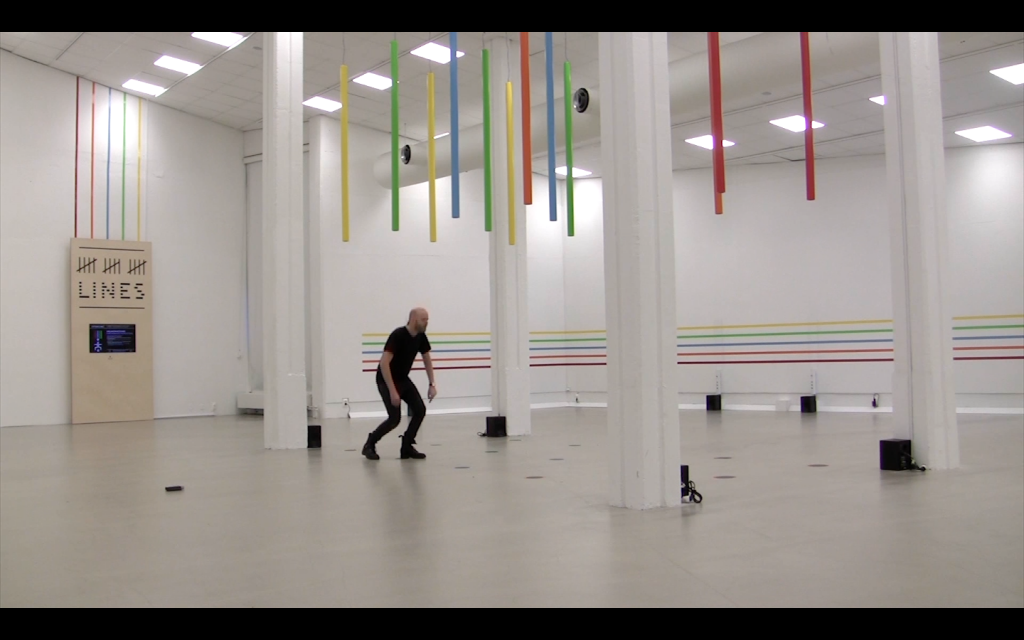
LINES is an interactive sound art exhibition created by Swedish composer Anders Lind in 2016. Lines attached to the wall, on the floor and hanging from the ceiling in combination with sensors and electronics are forming three novel music instruments. No musical experiences are required to perform, while the well-experienced musician or composer finds new musical challenges and opportunities with the instruments. The ambition with LINES is to enable: new forms of musical interaction, an exploration of new artistic expressions and to provide unique and inspiring musical experiences. And more than and art installation, it creates people’s interaction by enabling them playing and composing together with LINES. 

Sean Meng-Project- 03-Dynamic Drawing

hmeng Project-03

//Sean Meng
//Section C
//hmeng@andrew.cmu.edu
//Project-03-Dynamic-Drawing

var angle = 0;
var mouth = 0;
var shark = 0;

function setup() {
    createCanvas(640, 480);
}
 

function draw() {
//the color of the sea varies as the shark moves
    background(mouseX, 190, 200);
    fill(0)
    rect(0, 0, 250, 480)
    noStroke();

//bait
//When shark touches the bait, the sea turns to red
    fill(120)
    push();
    translate(640 - mouseX / 2, mouseY + 45);
    rotate(radians(angle));
    ellipse(0, 0, 30, 30);
    ellipse(0, 0, 10, mouseX * 90 / 300);
    pop();
    angle = angle + 5;
    rect(640 - mouseX / 2, mouseY + 45, 640 - mouseX / 5, 3)


//shark body
    fill(255);
    beginShape();
    vertex(mouseX, mouseY);
    vertex(mouseX - 250, mouseY);
    vertex(mouseX - 160, mouseY + 40);
    vertex(mouseX - 60, mouseY + 60);
    endShape(CLOSE);
//shark fin
    beginShape();
    vertex(mouseX - 80, mouseY);
    vertex(mouseX - 110, mouseY);
    vertex(mouseX - 120, mouseY - 50);
    endShape(CLOSE);

    beginShape();
    vertex(mouseX - 160, mouseY + 40);
    vertex(mouseX - 170, mouseY + 30);
    vertex(mouseX - 180, mouseY + 50)
    endShape(CLOSE);  

    beginShape();
    vertex(mouseX - 70, mouseY + 65);
    vertex(mouseX - 90, mouseY + 30);
    vertex(mouseX - 100 , mouseY + 100);
    endShape(CLOSE);      

//shark tail
    beginShape();
    vertex(mouseX - 230, mouseY + 5);
    vertex(mouseX - 320, mouseY - 40);
    vertex(mouseX - 280, mouseY + 5);
    vertex(mouseX - 320, mouseY + 39);
    endShape(CLOSE); 

//shark eye
    fill(0);
    ellipse(mouseX - 40, mouseY + 17, 10, 10);
    fill(255)
    ellipse(mouseX - 37, mouseY + 17, 5, 4);

//shark mouth appears when it gets out of the dark area
//shark mouth turns red and gets larger when it moves to the right
    if(mouseX > 250){
        fill(mouseX / 500 * 255, 0, 0);
        beginShape();
        vertex(mouseX - 34, mouseY + 35);
        vertex(mouseX - mouseX / 320 * 90, mouth)
        vertex(mouseX - 50, mouseY + 50);
        endShape(CLOSE); 
        mouth = mouseY - mouseX / 640 * 10 + 20
    }


}

In this project, I was interested in the relationship between different visual elements using interactive programming in p5js.

Sean Meng – Looking Outwards 03

Active Inlay Installation by Oyler Wu Collaborative
Link: https://www.oylerwu.com/projects

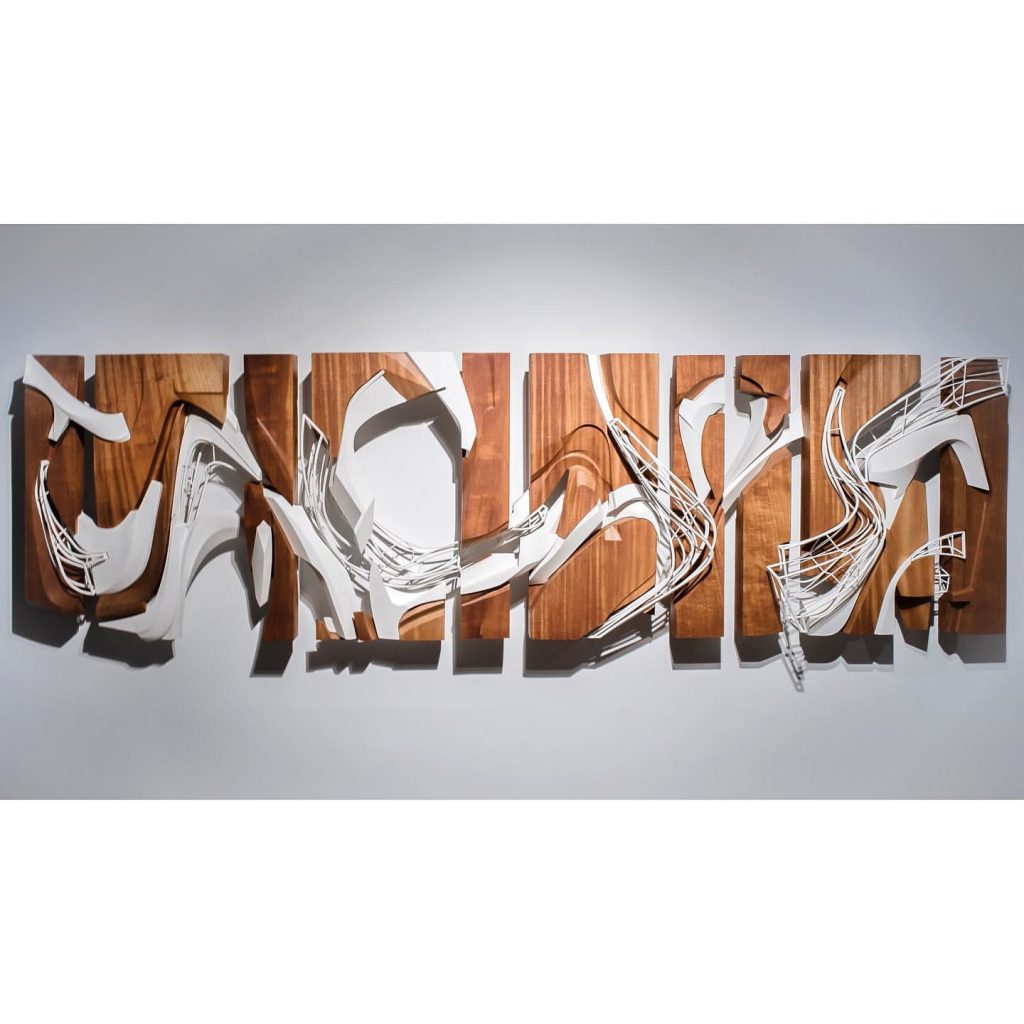
Oyler Wu Collaborative is a versatile design collaborative found by architects Dwayne Oyler and Jenny Wu. The firm focuse on architecture design and expand their unique design language and workflow to a broader design field. In their work, they frequently engage computational fabrication technique such as CNC routing and 3D printing to present their study model and other design collections. In their “Active Inlay” project, a set of art piece that discusses spatial condition such as line, surface and volume was generated and designed with computational modeling tool like grasshopper and Rhinoceros. And they are fabricated in CNC routed wood and 3D printed plaster. The final presentation of the work truly shows the expandable potential of architecture design and digital fabrication.