Rachel Shin – LO 12

For this looking outwards blog post, I decided to explore other sound art and a mobile game. I decided to look into François Quévillon’s Algorithmic Drive and the mobile game Tap Tap Revolution. 

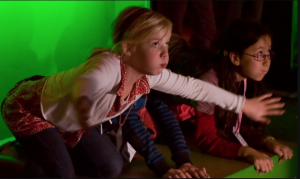
I found François Quévillon’s sound project intriguing because it invited audience members to experience sound from a slightly skewed perspective. It explores upon the intersection of sound with the concept of the unpredictable nature of the world. The description “unpredictable nature” inspired me to explore the idea of how unpredictable fires can be and how unpredictable of an impact it could have on society.

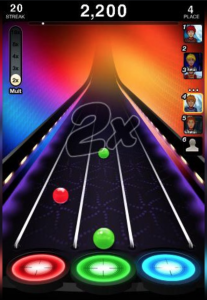
Tap Tap Revolution uses the user’s tap response on the screen to produce certain sounds– in the game, songs. This concept inspired me because I wanted to conjoin user’s response to produce a sound. 

These two projects are similar in the way that they depend on data to produce various sounds that explore the intersection of the data and a concept– unpredictable nature of the world and music respectively.

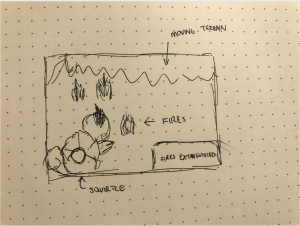
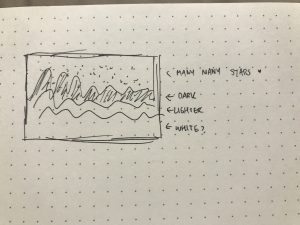
From these two projects and my childhood game– Pokemon– I decided to create an interactive game to demonstrate the unpredictable nature of the California fires and sounds accompanied with it.

Tap Tap Revolution

Rachel Shin – Project 12 Proposal

For my project, I wanted to create an interactive game that combined the suggested prompt– climate crisis and my own personal favorite childhood game Pokemon. I will be incorporating multiple elements that I’ve learned throughout the course. The game I will be coding allows players to use the Pokemon character Squirtle to extinguish the fires. As someone from California, I’ve been very concerned with the number of fires that have been occurring and the impact the fires have been having on the air that my family breathes back home. The fires will pop up at a random position on the screen while the player can use Squirtle’s water gun attack to extinguish the fire. The game will also feature a score tracker at the screen of a corner to keep track of the number of fires the player’s Squirtle has extinguished. I will also attempt to include the sound feature as Squirtle extinguishes each fire. For graphics, I will be creating an animated landscape accompanied by sprites of Squirtle online. 

Project 12 Sketch

Rachel Shin – Project 11

reshin-project11

/* Rachel Shin
reshin@andrew.cmu.edu
15-104 Section B
Project 11 - Landscape
*/

var terrainSpeed = 0.0005;
var terrainDetail = 0.0195;
var terrainDetail1 = 0.04;
var stars = [];

function setup() {
    createCanvas(400, 300);
    frameRate(15);
    for (var i = 0; i < 70; i++){
        var starX = random(width);
        var starY = random(0, height/4);
        stars[i] = makeStar(starX, starY);
    }

}

function draw() {
    background(0);
    displayStars(); //bottom layer
    darkTerrain(); //next layer
    terrain(); //second to top layer
    bottomTerrain(); //top layer

    
}

function terrain() {
    noStroke();
    fill(220);
    beginShape(); 

    for (var x = 0; x < width; x ++) {
      var t = (x * terrainDetail) + (millis() * terrainSpeed);
      var y = map(noise(t), 0, 1, 200, 100);
      vertex(x, y);
    }
    
    vertex(width, height);
    vertex(0, height);
    endShape();
}

function darkTerrain() {
    noStroke();
    fill(17, 25, 36);
    beginShape(); 

    for (var x = 0; x < width; x ++) {
      var t = (x * terrainDetail1) + (millis() * terrainSpeed);
      var y = map(noise(t), 0, 2, 0, 300);
      vertex(x, y);
    }

    vertex(width, height);
    vertex(0, height);
    endShape();
}

function bottomTerrain() {
    noStroke();
    fill(255);
    beginShape();

    for (var x = 0; x < width; x ++) {
        var t = (x * terrainDetail1) + (millis() * terrainSpeed);
        var y = map(noise(t), 0, 1, 50, 300);
        vertex(x, y);
    }

    vertex(width, height);
    vertex(0, height);
    endShape();
}

function drawStar() {
    noStroke();
    fill(230, 242, 174);
    push();
    translate(this.x, this.y);
    ellipse(5, 10, 5, 5);
    pop();
}

function makeStar(starX, starY) {
    var makeStar = {x: starX,
                y: starY,
                speed: -1,
                move: moveStar,
                draw: drawStar}
    return makeStar;
}

function moveStar() {
    this.x += this.speed;
    if (this.x <= -10){
        this.x += width;
    }
}

function displayStars() {
    for(i = 0; i < stars.length; i ++) {
        stars[i].move();
        stars[i].draw();
    }
}

As a kid, I often went on trips to Reno or Lake Tahoe with my family and family friends. If I wasn’t playing video games in the car, I would stare at the mountains that we drove past and was mesmerized by the stars that I couldn’t see in Cupertino because of all the light pollution there. I decided to create 3 different terrains to create more depth in my production and put many stars in it to represent the countless number of stars that I saw during the drive.

sketch

Rachel Shin – LO 11


Emily Gobeille is a visual design, motion graphics, and interactions artist based in Brooklyn, New York and from Amsterdam, Netherlands who produces high-end installations for children. As an artist that values interaction with the audience, Gobeille sought to produce technology-based art that invited her audience members to directly interact with the piece. One of her interactive pieces, “Knee Deep,” invites children to “explore unexpected worlds of different proportions with their feet” (zanyparade.com). 


Gobeille created “Knee Deep” with openFrameworks and combined real-time greenscreening with stomp detection to produce an interactive space that revealed seemingly impossible scales of different landscapes like those on Earth and those in space. The stomp-detection aspect of “Knee Deep” allows children to interact with the piece physically, making it more than a visual thing to admire but a fun activity to spend time in.


I particularly liked this piece because it focuses its attention on children. Art is usually viewed as something for adults, but Gobeille breaks that stigma by steering the piece’s attention towards children and creating a space that allows them to interact with a seemingly impossible scenario. As a child, I often enjoyed the interactive, stomp-detection spots in Korean malls, not wanting to leave the mall for that sole reason. Artists like Gobeille provide children with a spark of curiosity that allow them to imagine beyond a real-time setting.

Real time green screening


Coded stomp detection

Rachel Shin – LO 10

In 2018, Japanese sound artist Ryoji Ikeda created an audiovisual “Code-Verse”l that took computer graphics and translated them into electronic noises and drones, coining it as “code-verse.” Ikeda created this code-verse project after creating his own type of techno music that was formed from sonic textures from graphics. The code probably was composed of a series of sonic partnership with the direction and speed of the graphics from Code-Verse. I found this project very interesting because it was a balanced intersection of two forms of entertainment– visuals and audio. By conjoining the two mediums, Ikeda created a mesmerizing audiovisual that allowed viewers to feel as if they were placed in a new dimension. Ikeda sought to create a unique art form that escaped from the media-infested society we live in and a form that allowed viewers to feel as if they were interacting and in the actual art environment, and this was manifested in Code-Verse which allowed visitors to feel as if they were in a different dimension from the Big Data world that we live in.

Rachel Shin – Project 10 – Pokemon

reshin-10-pokemon

/* Rachel Shin
reshin@andrew.cmu.edu
15-104 Section B
Project 10 

*/

// sketch.js template for sound and DOM
//
// This is the 15104 Version 1 template for sound and Dom.
// This template prompts the user to click on the web page
// when it is first loaded.
// The function useSound() must be called in setup() if you
// use sound functions.
// The function soundSetup() is called when it is safe
// to call sound functions, so put sound initialization there.
// (But loadSound() should still be called in preload().)

var imageLinks = [
    "https://i.imgur.com/VyMU3A0.png", //charmander
    "https://i.imgur.com/qji2HbI.png", //pikachu
    "https://i.imgur.com/dHUobNP.png", //squirtle
    "https://i.imgur.com/bugsaaS.png", //bulbasaur
]

//image variables

var charmander;
var pikachu;
var squirtle;
var bulbasaur;

//sound variables;
var fire;
var thunder;
var water;
var grass;

function preload() {
    //loading images
    charmander = loadImage("https://i.imgur.com/VyMU3A0.png");
    pikachu = loadImage("https://i.imgur.com/qji2HbI.png");
    squirtle = loadImage("https://i.imgur.com/dHUobNP.png");
    bulbasaur = loadImage("https://i.imgur.com/bugsaaS.png");

    //loading sounds
    fire = loadSound("fire-2.wav");
    thunder = loadSound("thunder.wav");
    water = loadSound("water-4.wav");
    grass = loadSound("grass.wav");

    // call loadImage() and loadSound() for all media files here
}


function setup() {
    // you can change the next 2 lines:
    createCanvas(480, 480);
    usesound();
}


function soundSetup() { // setup for audio generation
    fire.setVolume(3);
    thunder.setVolume(1);
    water.setVolume(1.5);
    grass.setVolume(1.2);
}


function draw() {
    background(196, 186, 118);;

    // images of the four elements
    image(charmander, 0, 0, width/2, height/2);
    image(pikachu, width/2, 0, width/2, height/2);
    image(squirtle, 0, height/2, width/2, height/2);
    image(bulbasaur, width/2, height/2, width/2, height/2);
}
  
function mousePressed() {

    if (mouseX >= 0 & mouseX < width/2 && mouseY >= 0 && mouseY < height/2) {
        fire.play();
    } 
    else { 
        fire.pause();
    }

    if (mouseX >= 0 & mouseX < width/2 && mouseY >= height/2 && mouseY < height) {
        water.play();
    } 
    else {
        water.pause();
    }

    if (mouseX >= width/2 & mouseX < width && mouseY >= 0 && mouseY < height/2) {
        thunder.play();
    } 
    else {
        thunder.pause(); 
    }

    if (mouseX >= width/2 & mouseX < width && mouseY >= height/2 && mouseY < height) {
        grass.play();
    } 
    else {
        grass.pause();
    }
}

After thinking of ways to incorporate 4 different sounds, I immediately thought of the 4 elements, and I decided to connect it to one of my childhood favorites- Pokemon. I decided to use the first four Pokemon that I loved and used their types and connected it to different sounds. I was inspired by the legendary Pokemon mural from the first season of Pokemon. It was fun to configure sound and visuals together especially when it came to designing my own version of the mural with 4 basic Pokemon that I loved as a kid.

Rachel Shin – Project 09 – Portrait

reshin-project-09

/*
Rachel Shin
reshin@andrew.cmu.edu
15-104 Section B
Project 09 - Computational Portrait: Michelle
*/

var michelle;

function preload() {
//load image from imugr.com
    var myImageURL = "https://i.imgur.com/5AfjBeG.jpg";
    michelle = loadImage(myImageURL);
}

function setup() {
    createCanvas(500, 500);
    background(0);
    michelle.loadPixels();
    frameRate(200);
}

function draw() {
    var px = random(width);
    var py = random(height);
    var ix = constrain(floor(px), 0, width-1);
    var iy = constrain(floor(py), 0, height-1);
    var theColorAtLocationXY = michelle.get(ix, iy);

    noStroke();
    fill(theColorAtLocationXY);
    text("One FaceTime Away", px, py);
}

For this project, I decided to use a photo of one of my closest and best friends from home, Michelle. Ever since we met at orchestra camp, we didn’t get to see each other too often because we went to different high schools. Even now, she goes to school in Georgia now, so I don’t get to see her as often as I’d want. Both in high school and in college, we always remind each other that we’d be “One FaceTime Away,” and that became the basis and foundation of our time as best friends.

I found it fun to play around with what variable and pixel shapes I could change especially to literally compute an image that represented my friendship with Michelle.

Rendering
Fully Rendered
Original image of my number one cheerleader

Rachel Shin – LO 9

I decided to do this week’s Looking Outwards on my friend Joseph Zhang’s LO-7 which was on the eCloud project in the San Jose Airport. Coming from the same hometown as Joseph, I’ve also passed by this computational data visualization project several times, admiring it, but not thinking much of it.

Like Joseph, I also found out that the project took into account real-time weather reports of cities all around the country which would be helpful particularly for people in the airport. 

After coding arrays the past weeks, I was able to make an observation that the projects that I see around me like eCloud in the San Jose airport is one that utilizes arrays of several compilations of data to create a visual that translates numbers into better communication methods for consumers like me.

Rachel Shin – LO 8 – Mapping Police Violence

In 2015, Deray Mckesson and Samuel Sinyangwe shared their beliefs in the imbalance of social roles between police and population and sought out to create a data visualization that shone light on the police violence that was shoved under the carpet.

Deray Mckesson, a government and legal studies from Bowdoin College, found his passion and embarked upon his path as an activist as he participated in a protest and discovered the ability of Twitter to tell stories in real-time. Prompted by police brutality tweets tweeted at him minutes after occurrence, Mckesson sought out to translate quantitative data into one of many stories to be told. Samuel Sinyangwe is a researcher and activist who studied race, politics, economics, and class at Stanford University who found his passion for activism after the shooting death of Trayvon Martin in Florida where Sinyangwe had regularly gone to for sports practice. After discovering how real the scenario of police brutality could be, Sinyangwe sought to develop an organization that used digital media to support Black Lives Matter activism.

In the video, Mckesson and Sinyangwe presented their ideas and beliefs through three main points: data, lived reality, and numbers & policy in a comfortable manner rather than with a business/professional tone to eliminate the presenter-audience barrier. They also answered audience members’ questions to better persuade them the benefits of their data visualization.

Mckesson and Sinyangwe developed a dataset-based map that pictured a timeline that can be scrubbed through that colorized and highlighted locations of police violence. I believe that this was created through loops, arrays, and functions that allowed the program to run through the dataset of cited police violence accounts and locations. The loop and functions then allowed Mckesson and Sinyangwe to develop an interactive map that allowed audience members to see for themselves how often police violence occurs. I admired this particular project because it allows an Internet-user like me to visually see how real this modern-day issue really is. Growing up in a sheltered bubble, I never considered the weight of police brutality, so this data visualization map breaks that wall of ignorance.

Rachel Shin – LO 7

“Flight Patterns” by Aaron Koblin is a computation information visualization composed by a history of air traffic. Data was collected from FAA data, and it was put together and computed via Processing programming. Koblin used Adobe After Effects and Maya to put together this visual. I personally admired the cohesive nature of this visual. While it showed chaos of air traffic, it portrayed a simple, calm, and unified visual. I personally never considered air traffic like the way I thought about road traffic, so it was an interesting outlook for me to see Koblin’s creation. I suppose that the algorithms used were tracking the departure and destination location and creating curves with those points and using a specific color for each one to specify which curve represented which flight. The creator’s artistic sensibilities were manifested in portraying a unity of air traffic with a variety of curves and color.