![[OLD FALL 2019] 15-104 • Introduction to Computing for Creative Practice](../../../../wp-content/uploads/2020/08/stop-banner.png)
/*Rachel Shin
reshin@andrew.cmu.edu
15-104 Section B
Project 07- Composition with Curves
*/

var numPoints = 300;
var angle = 0;


function setup() {
    createCanvas(480, 480)
    r = random(255);
    g = random(255);
    b = random(255);
}


function draw() {
    background(0);

    push();
    translate(width / 2, height / 2); //center on canvas
    drawHypotrochoid();
    pop();

    push();
    translate(mouseX, mouseY); //center of curve based on mouse position
    rotate(radians(angle)); //rotates on center point
    drawTrifolium();
    pop();

    angle = angle + 4; // speed of rotation
}

function drawHypotrochoid() { //http://mathworld.wolfram.com/Hypotrochoid.html
    var x;
    var y;

    //map boundaries
    var h = map(mouseY, 0, height, 0, 200); //size changes based on mouseY
    var a = map(mouseX, 0, width, 0, 200); //size changes based on mouseX
    var b = a / 8;

    //Hypotrochoid curve
    beginShape();
    for (var i = 0; i < numPoints; i ++) {
        stroke(r, g, b);
        strokeWeight(2);
        noFill();
        var t = map(i, 0, 200, 0, TWO_PI)
        x = (a - b) * cos(t) + h * cos(((a - b) / b) * t)
        y = (a - b) * sin(t) - h * sin(((a - b) / b) * t)
        vertex (x, y)
    }
    endShape(CLOSE);
}


function drawTrifolium() { //http://mathworld.wolfram.com/ConicalSpiral.html
    var x;
    var y;
    var r;

    //constrain
    var a = constrain(mouseX, width / 5, width / 2);

    //outline of light blue spinning trifolium
    noFill();
    stroke(195, 217, 227);
    strokeWeight(0.5);

    //Trifolium curve
    beginShape();
    for (var i = 0; i < numPoints; i++) {
        var t = map(i, 0, numPoints, 0, TWO_PI);
        r = - a * cos(3 * t);
        x = r * cos(t);
        y = r * sin(t);
        vertex(x, y);
    }
    endShape(CLOSE);
}
This project took me a while because it took me a while to figure out how to compute each curves. Maneuvering it around the canvas was more interesting for me because it allowed me observe how the code I wrote computed it to animate a certain way.
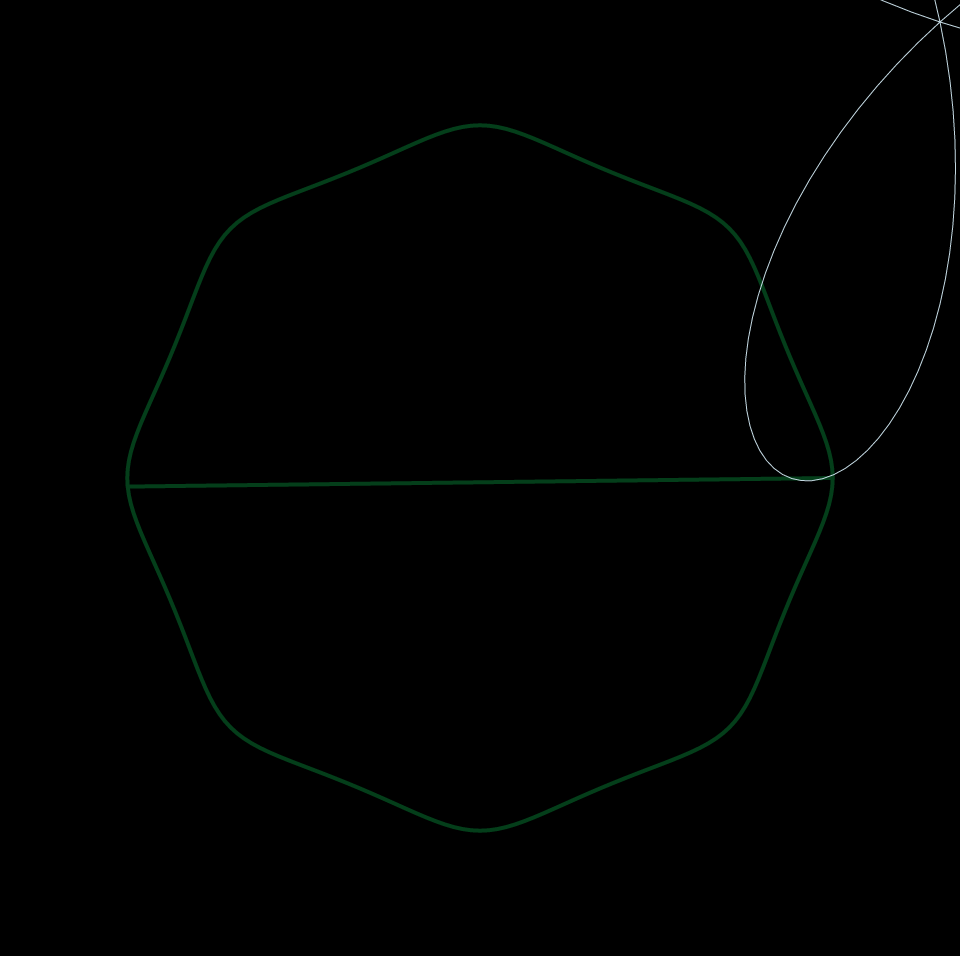
Mouse at Top Right of Canvas 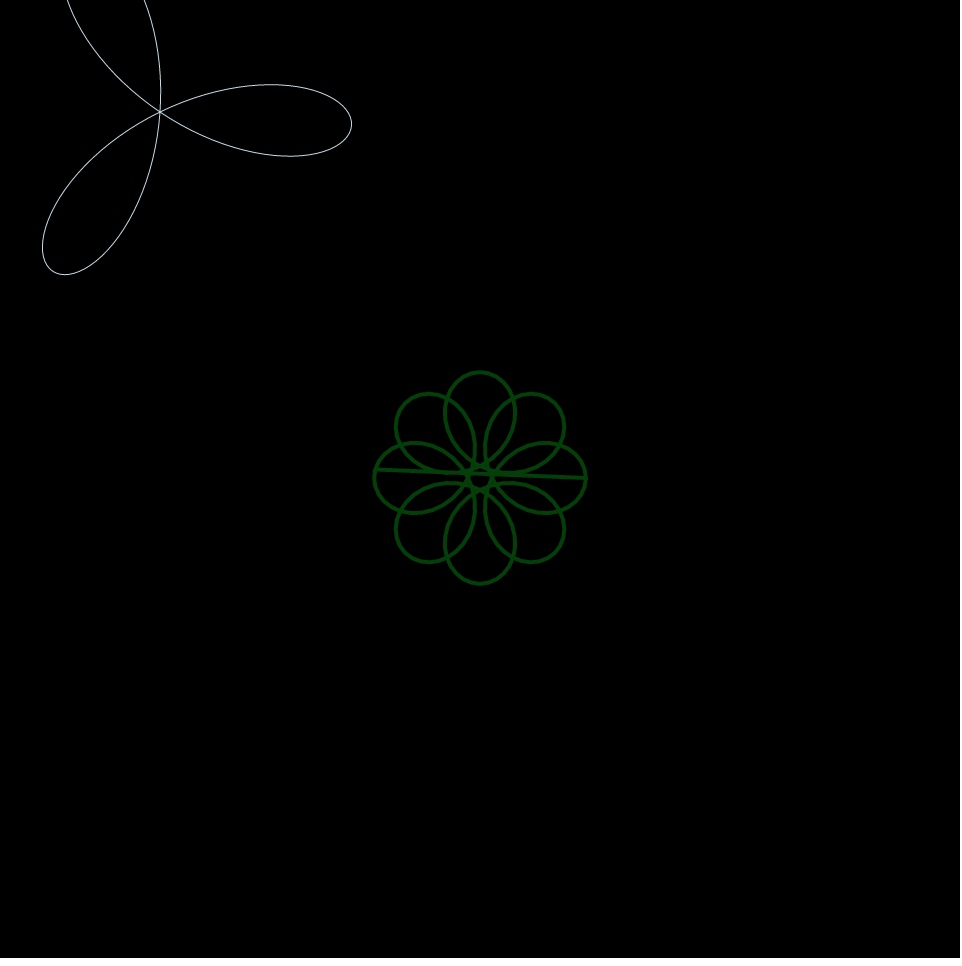
Mouse at Top Left of Canvas 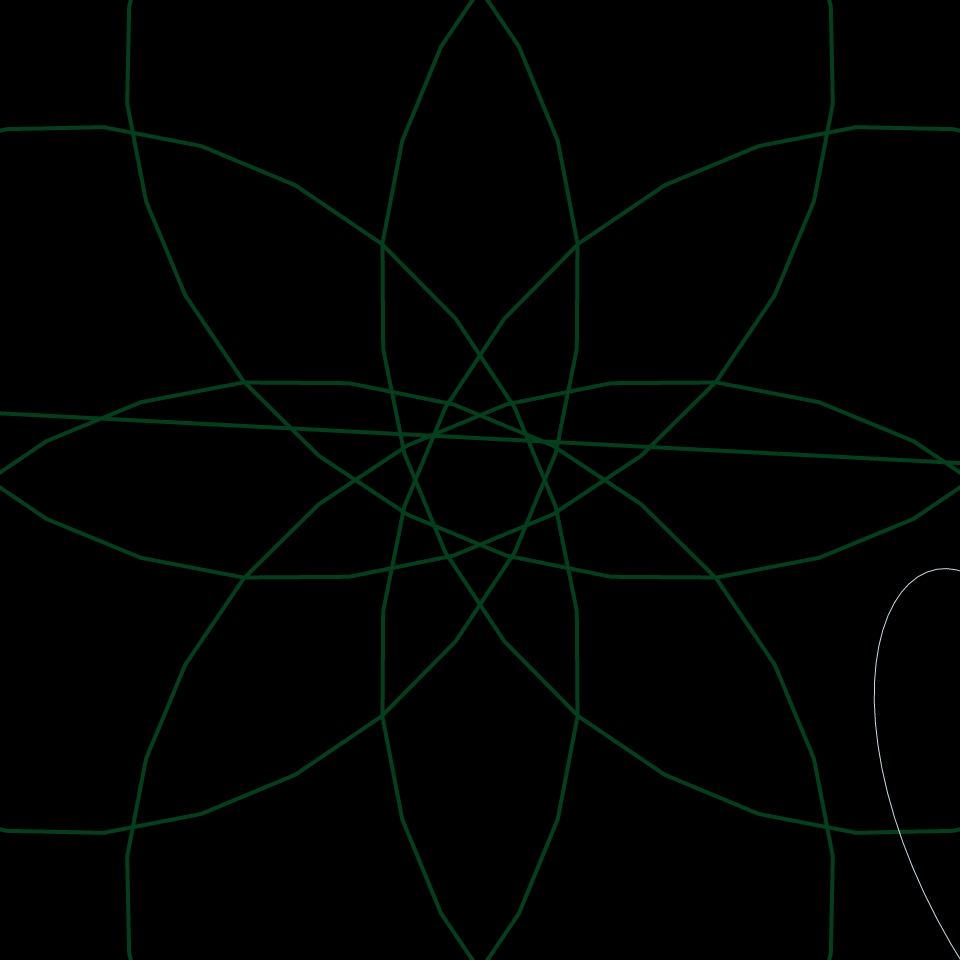
Mouse at Bottom Right of Canvas 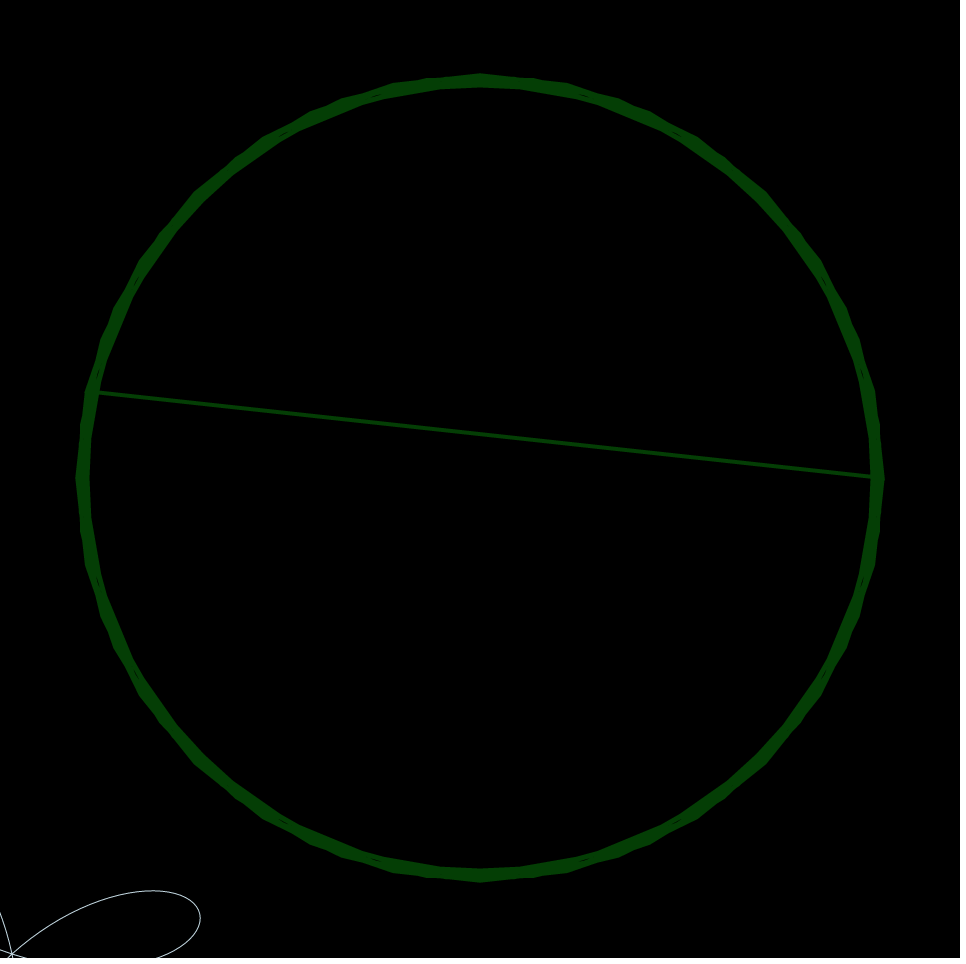
Mouse at Bottom Left of Canvas 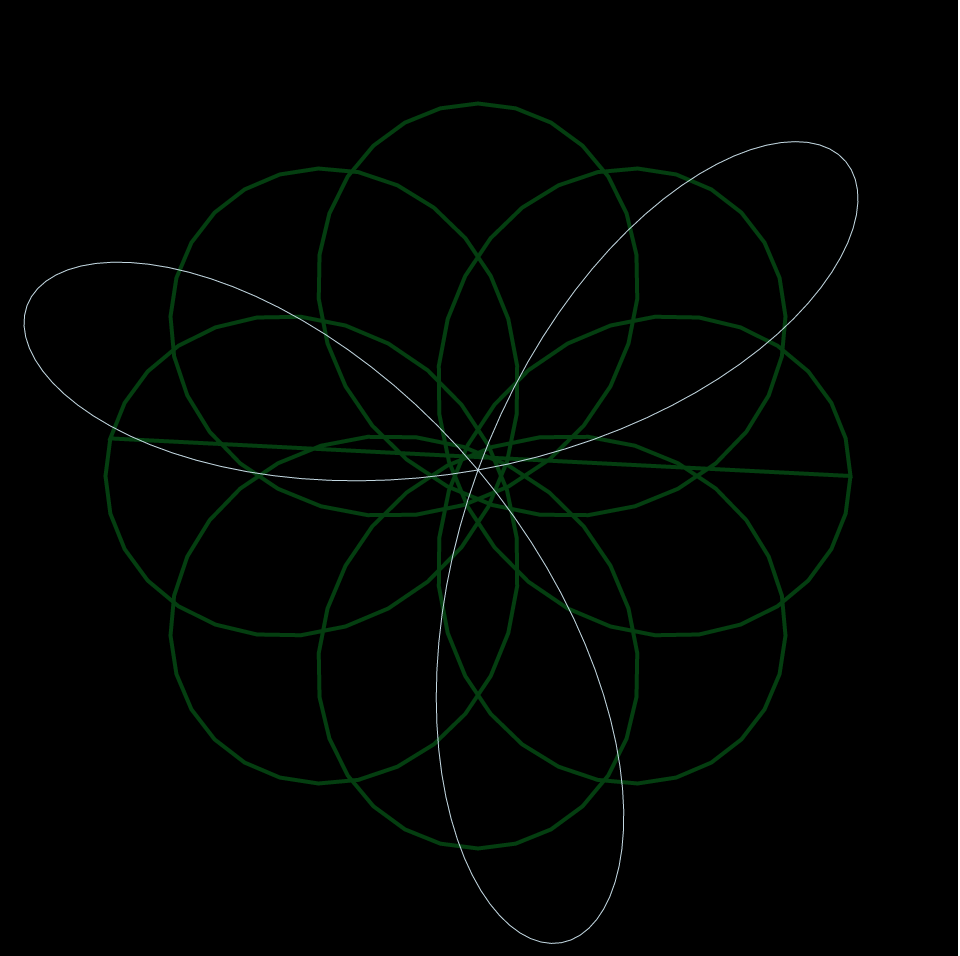
Mouse at Center of Canvas