Making of Off the Staff (link)
By Nicholas Rougeux, September 6, 2016 in Art, Data
Seeing music
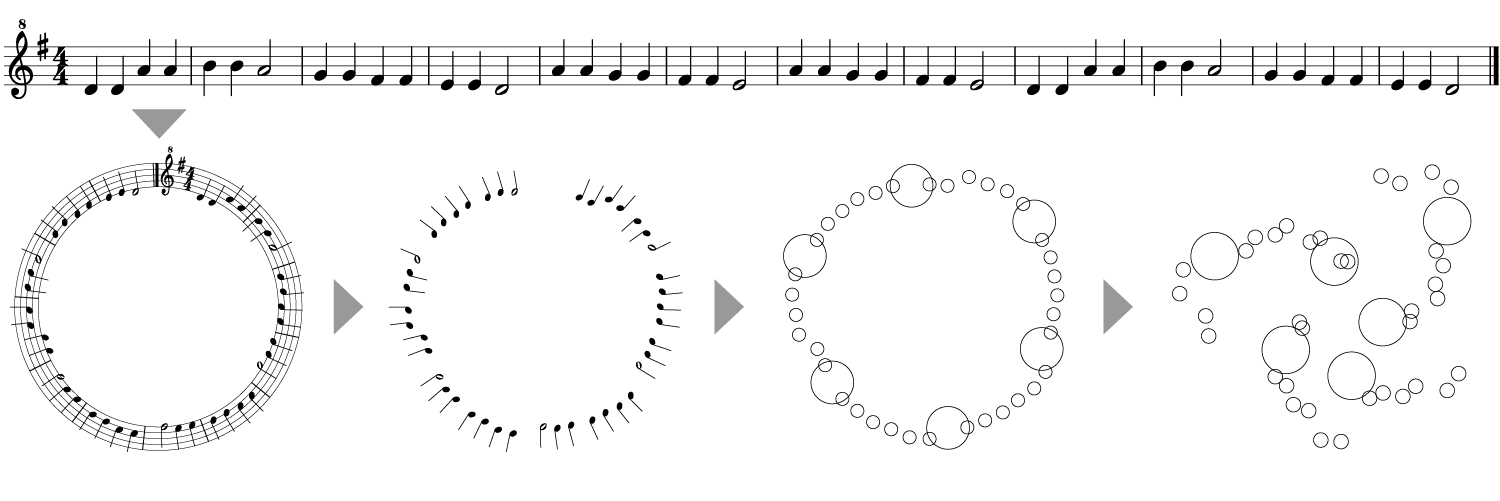
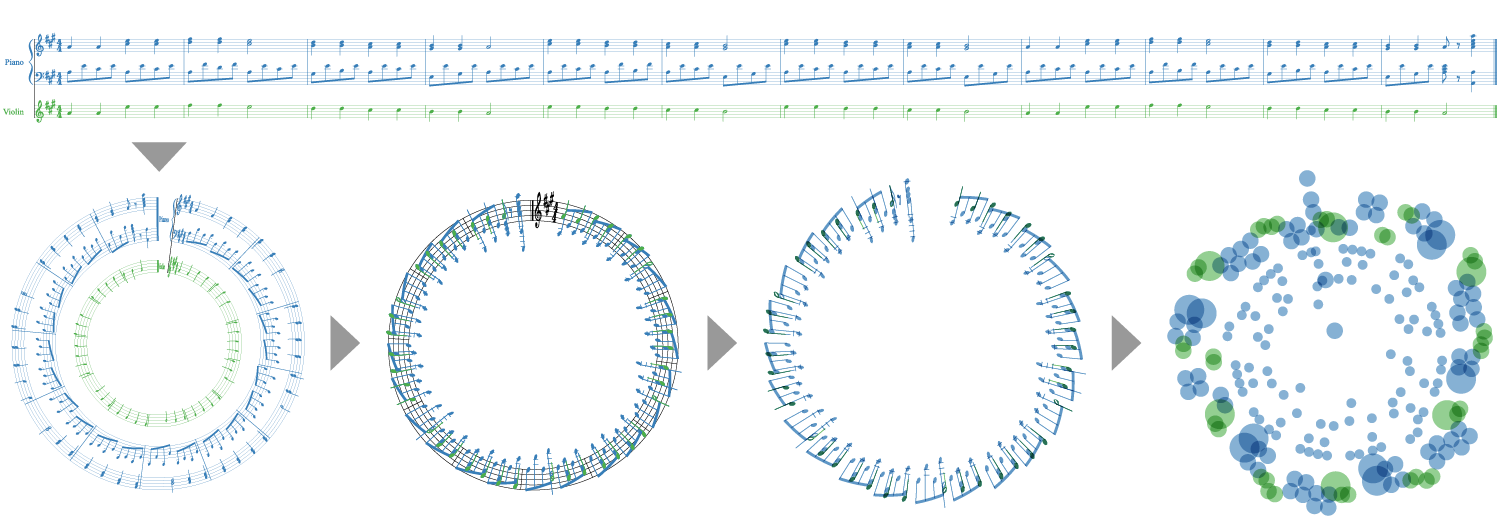
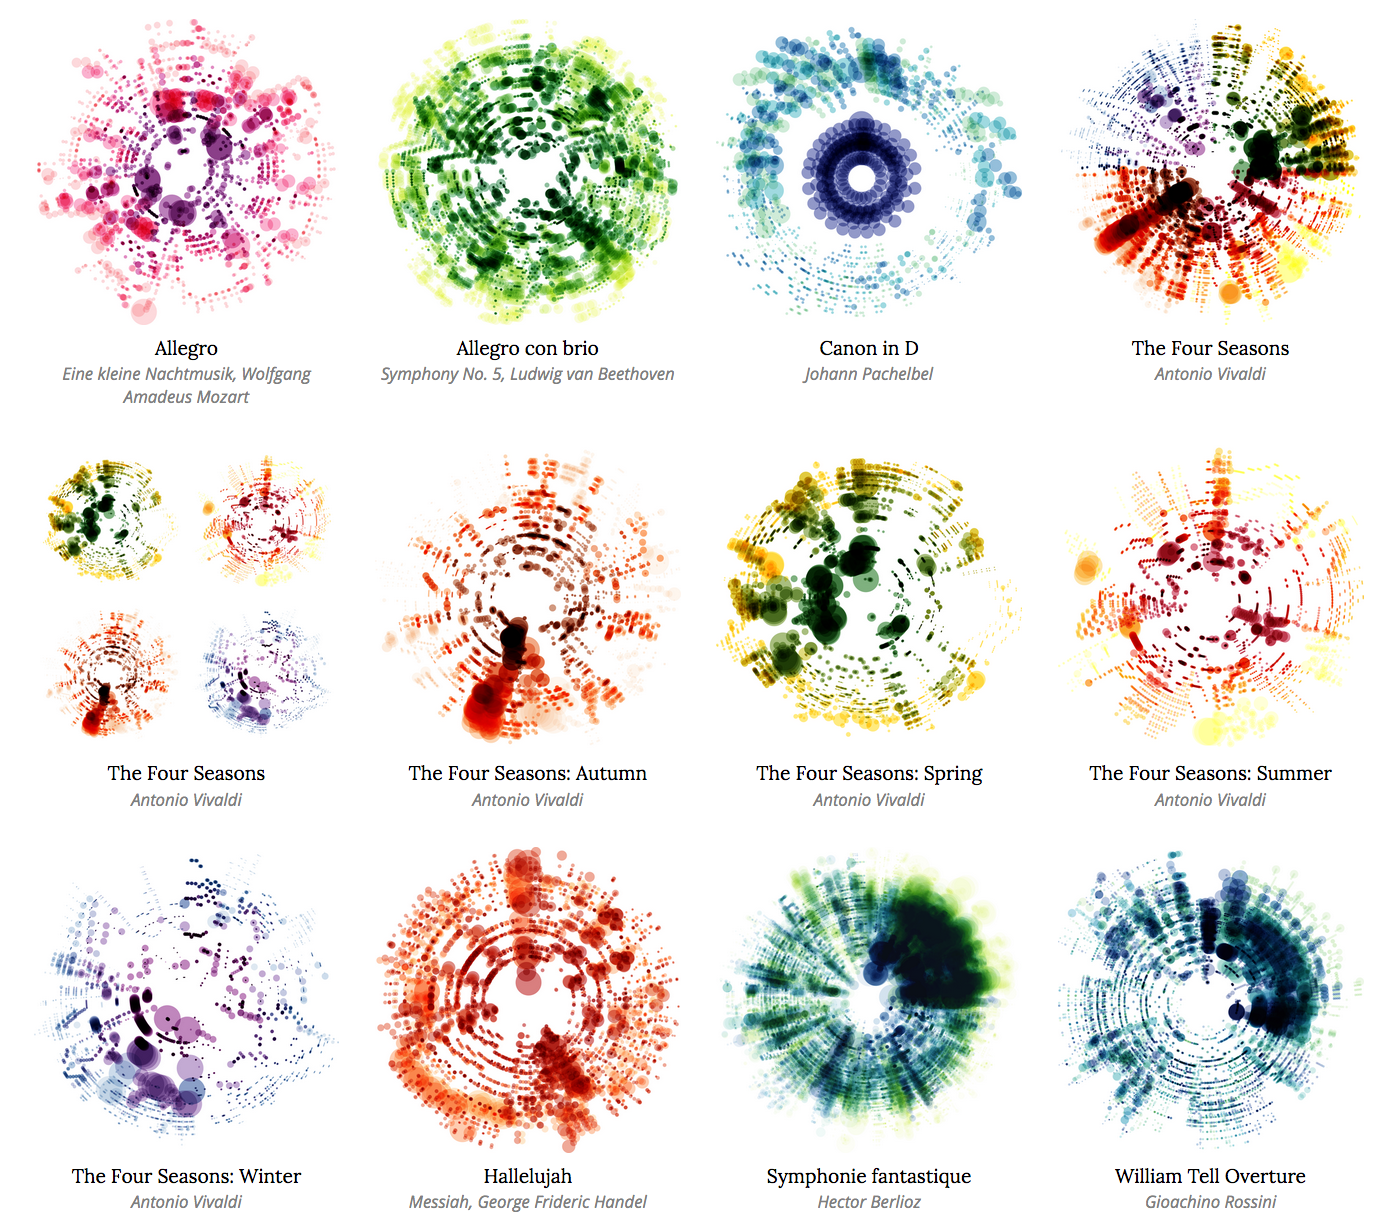
Each dot represents a note in the score. Pitch is indicated by the distance from the center of the image, while the time at which the note occurs is given by the angle from the 12 o’clock position. The size of the dot indicates the duration of the note, and the color of the dot is different for each instrument.

How they were made
“I can’t read music but I can parse it. The talent of reading music has always escaped me which is a little ironic considering I grew up in a musical family. However, I’ve always enjoyed how sheet music looks so I took a shot at visualizing the notes from musical scores and the result is this series of posters.”
Nicholas Rougeux (the artist)


The original process was:
- Original MethoExport XML from MuseScore
- Convert XML to CSV with Luxon
- Upload select CSV files to Google Sheets: “Copying and pasting tens of thousands of cells into Google Sheets was a slow process and prone to failing—even with the speediest of browsers.”
- Combine CSV files with Google Sheets: “The process of combining CSV files with Google Sheets was the most time-consuming step of the original process and had the risk for inaccuracy.”
- Import CSV into NodeBox to generate images
The new process is:
- Export MIDI from MuseScore
- Generate CSV from MIDI file with midicsv-process
- Import CSV into NodeBox to generate images
More details on the process here. This includes early versions and tools used. Earlier process can be found here.

![[OLD FALL 2019] 15-104 • Introduction to Computing for Creative Practice](wp-content/uploads/2020/08/stop-banner.png)