//Steven Fei
//Section A
//zfei@andrew.cmu.edu
//Project-07
var nPoints = 100;

function setup() {
    createCanvas(480, 480);

}


function draw() {
    background("pink");
    push();
    translate(width/2, height/2);

    hypocycloidInvolute();
    hypotrochoid();

    pop();

}
function hypotrochoid(){
    //http://mathworld.wolfram.com/Hypotrochoid.html
    var x;
    var y;
    var x2;
    var y2;
    var a = constrain(mouseX,60, 180) ;//variable for hypotrochoid with 1/6radius
    var b = a/6; //variable for hypotrochoid with 1/6 radius
    var h = constrain(mouseY/8, 0, 2*b); // control the size of the radius
    var ph = mouseX/20; // control the starting angle of the radius
    var a2 = map(mouseY,0,480,30,80); // variable for hypotrochoid with 1/2 radius
    var b2 = a/2; // variable for hypotrochoid with 1/2 radius
    var a3 = a-20;//variable for the grey hypotrochoid
    var b3 = a3/4;//variable for the grey hypotrochoid
    var h3 = constrain(mouseY/8,0,2.5*b3);//variable for the grey hypotrochoid
    var lineV1x = []; // arrays to collect the hypotroid coordinates with 1/2 radius
    var lineV1y = []; // arrays to collect the hypotroid coordinates with 1/2 radius
    var lv2x = [];//arrays to collect the white hypotrochoid coordinates
    var lv2y = [];//array to collect the white hypotrochoid coordinates
    var lv3x = [];//arrays to collect the grey hypotrochoid coordinates
    var lv3y = [];//arrays to collect the grey hypotrochoid
    noFill();
    //draw the grey hypochocoid with 1/4 radius
    beginShape();
    stroke("grey");
    strokeWeight(1);
    for (var z = 0; z<nPoints; z++){
        var tz = map(z, 0, nPoints, 0, TWO_PI);
        x2 = (a3-b3) * cos(tz) - h3*cos(ph + tz*(a3+b3)/b3);
        y2 = (a3-b3) * sin(tz) - h3*sin(ph + tz*(a3+b3)/b3);
        vertex(x2,y2);
        lv3x.push(x2);
        lv3y.push(y2);
    }
    endShape(CLOSE);

    //begin drawing the hypotrochoid with 1/6 radius
    beginShape();
    stroke("white");
    strokeWeight(2);
    for (var i = 0; i<nPoints; i++){
        var t = map(i, 0, nPoints, 0, TWO_PI);
        x = (a-b) * cos(t) - h*cos(ph + t*(a+b)/b);
        y = (a-b) * sin(t) - h*sin(ph + t*(a+b)/b);
        vertex(x,y);
        lv2x.push(x);
        lv2y.push(y);
    }
    endShape(CLOSE);
    //draw the blue vains
    for (var d = 0; d<lv2x.length; d++){
        stroke("cyan");
        strokeWeight(1);
        line(lv2x[d],lv2y[d],lv3x[d],lv3y[d]);
    }

    //begin drawing the hypotrochoid with 1/2 radius
    beginShape();
    stroke(0);
    strokeWeight(1);
    for (var j = 0; j<nPoints; j++){
        var t2 = map(j, 0, nPoints, 0, TWO_PI);
        x = (a2-b2) * cos(t2) - h*cos(ph + t2*(a2+b2)/b2);
        y = (a2+b2) * sin(t2) - h*sin(ph + t2*(a2+b2)/b2);
        vertex(x,y);
        lineV1x.push(x);
        lineV1y.push(y);
    }
    endShape(CLOSE);
    // creating the mark pen effect by adding lines with 4 spacings of the inddex
    for (var j2 = 0; j2 < lineV1x.length-1; j2++){
        strokeWeight(1);
        stroke(0);
        line(lineV1x[j2], lineV1y[j2],lineV1x[j2+4],lineV1y[j2+4]);
        stroke("lightgreen");
        line(0,0,lineV1x[j2],lineV1y[j2]);//drawing the green veins
    }
}
function hypocycloidInvolute(){
    //http://mathworld.wolfram.com/HypocycloidInvolute.html
    var x1;//vertex for the red hypocycloid
    var y1;//vertex for the red hypocycloid
    var x2;//vertex for the orange hypocycloid
    var y2;//vertex for the orange hypocycloid
    var lx1 = [];//array for collecting the coordinates of the red hypocycloid
    var lx2 = [];//array for collecting the coordinates of the red hypocycloid
    var ly1 = [];//array for collecting the coordinates of the orange hypocycloid
    var ly2 = [];//array for collecting the coordinates of the orange hypocycloid
    var a = map(mouseY,0,480,90,180);//size of the red hypocycloid
    var b = a/7; //sides for the red hyposycloid
    var h = b; //determine the sharp corners
    var ph = mouseX/20;
    noFill();
    // red hypocycloid
    beginShape();
    stroke("red");
    strokeWeight(4);
    for (var i = 0; i<nPoints; i++){
        var t = map(i, 0, nPoints, 0, TWO_PI);
        x1 = a/(a-2*b) * ( (a-b)*cos(t) - h*cos( ph + (a-b)/b*t) );
        y1 = a/(a-2*b) * ( (a-b)*sin(t) + h*sin( ph + (a-b)/b*t) );
        vertex(x1,y1);
        lx1.push(x1);
        ly1.push(y1);
    }
    endShape(CLOSE);
    // begin drawing orange involute of the hypocycloid
    beginShape();
    stroke("orange");
    strokeWeight(3);
    for (var j = 0; j<nPoints; j++){
        var th = map(j, 0, nPoints, 0, TWO_PI);
        x2 = 1.5*((a-2*b)/a * ( (a-b)*cos(th) + h*cos( ph + (a-b)/b*th) ));
        y2 = 1.5*((a-2*b)/a * ( (a-b)*sin(th) - h*sin( ph + (a-b)/b*th) ));
        vertex(x2,y2);
        lx2.push(x2);
        ly2.push(y2);
    }
    endShape(CLOSE);
    // drawing the connection of the two hypocycloids
    for (var k = 0; k < lx1.length; k++){
        stroke("yellow");
        strokeWeight(1);
        line(lx1[k],ly1[k],lx2[k],ly2[k]);
    }

}
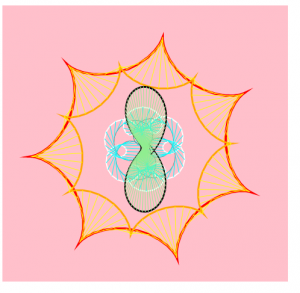
For this project, I was fascinated with the curves generated by those functions to breakdown the x and y coordinates. Then I started to play it around with mouse positions to create a growing, blooming effect. Generally, I used 2 types of curves — hypocycloid and hypotrocloid — to construct the imaginary veins and flowers. The central “mark-pen” drawing of the hypotrocloid was discovered accidentally when I tried to add varying thickness to the lines and now it gave a more realistic and 3D effect when combined with the light green lines. The blooming process integrates a series of overlappings among different elements. The white, cyan, and grey lines are related to give an impression of how the flowers can “squeeze” and “expand” during the process. The outer red,orange, and yellow lines give the basic pedestals for the drawing.


![[OLD FALL 2019] 15-104 • Introduction to Computing for Creative Practice](wp-content/uploads/2020/08/stop-banner.png)