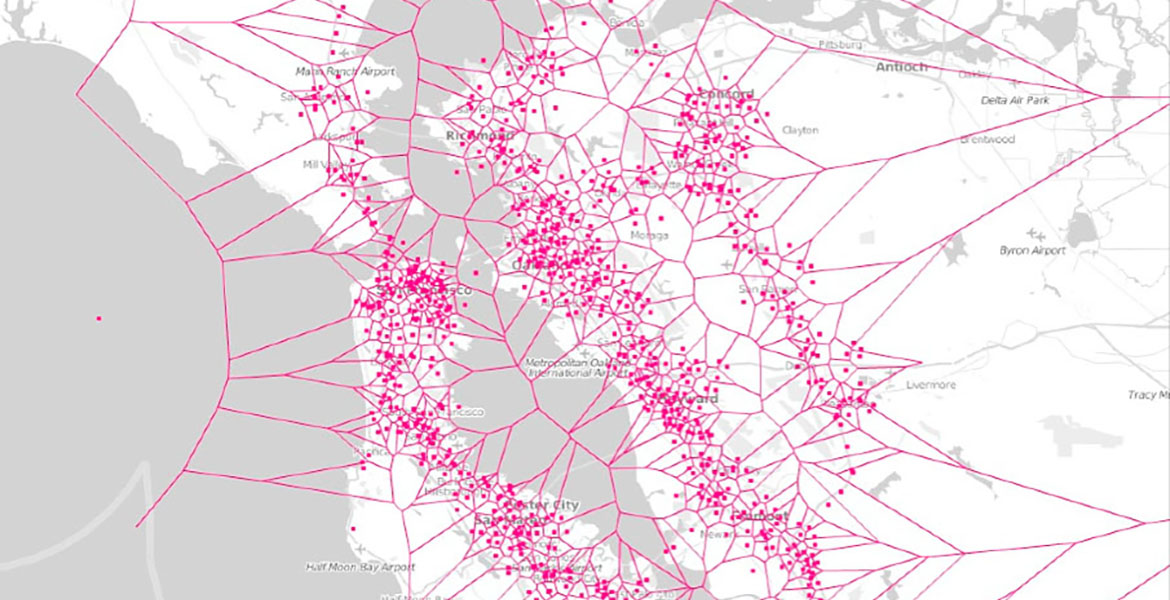
I chose to write about Stamen Design’s Cell Phone Coverage in the Bay Area. I do admire the firm’s work as a whole, but I thought that the designs they chose to generate from this particular dataset was really interesting to look at. I really liked how they took as mundane of a topic as cell phone coverage and made it into something visually appealing and beautiful. It was also really fascinating to see the variety in the different kinds of designs that they made out of the same type of data. I think that this set of designs is a really good representation of Stamen Design’s artistic sensibilities in that the firm considers itself to be sitting at the intersection between design and data science, and the collection embodies that combination.

Specifically, the Cell Phone Coverage in San Francisco is meant to visualize cellular network strength across four major carriers in the Bay Area through data-driven algorithms and interactive sketches. Although I’m not really sure about this, I think that this kind of data-derived design algorithm would involve importing data into the code editor and then inputting the values into some type of array structure to generate the patterns. It also looks like there are preset color and shapes that go with the information, so I would assume those use some type of array as well.
![[OLD FALL 2019] 15-104 • Introduction to Computing for Creative Practice](wp-content/uploads/2020/08/stop-banner.png)