//Caroline Song
//chsong@andrew.cmu.edu
//Section E
//Project 07-Curves

var nPoints = 800;

function setup (){
    createCanvas(480, 480);
}

function draw(){
    background(0);
    //calling functions
    drawHypotrochoid1();
    drawHypotrochoid2();
    drawHypotrochoid3();
}

function drawHypotrochoid1() {
    //Hypotrochoid
    //http://mathworld.wolfram.com/Hypotrochoid.html

    //setting variables for light pink hypotrichoid
    var x1 = constrain(mouseX, 0, width);
    var y1 = constrain(mouseY, 0, height);
    var a1 = 100;
    var b1 = map(mouseY, 0, 500, 0, width);
    var h1 = map(mouseX/10, 0, 500, 0, height);

    push();
    //light pink stroke
    noFill();
    stroke(251, 227, 255);
    strokeWeight(2);
    translate(width/2, height/2); //translate hypotrochoid to middle of canvas
    beginShape();
    for(var i = 0; i < nPoints; i++) {
        var t1 = map(i, 0, 100, 0, TWO_PI);
        x1 = (a1 - b1)*cos(t1) + h1*cos(((a1 - b1)/ b1) * t1);
        y1 = (a1 - b1)*sin(t1) - h1*sin(((a1 - b1)/ b1) * t1);
        vertex(x1, y1);
    }
    endShape(CLOSE);
    pop();

}

function drawHypotrochoid2() {
    //Hypotrochoid
    //http://mathworld.wolfram.com/Hypotrochoid.html

    //setting variables for pink hypotrichoid on the edges of canvas
    var x2;
    var y2;
    var a2 = 300;
    var b2 = 20;
    var h2 = constrain(mouseY/10, 0, height);

    push();
    noFill();
    stroke(237, 162, 250);
    strokeWeight(2);
    translate(width/2, height/2); //translate to middle of canvas
    beginShape();
    for(var i = 0; i < nPoints; i++) {
        var t2 = map(i, 0, 100, 0, TWO_PI);

        x2 = (a2 - b2)*cos(t2) + h2*cos(((a2 - b2)/ b2) * t2);
        y2 = (a2 - b2)*sin(t2) - h2*sin(((a2 - b2)/ b2) * t2);
        vertex(x2, y2);
    }
    endShape(CLOSE);
    pop();

}

function drawHypotrochoid3() {
    //Hypotrochoid
    //http://mathworld.wolfram.com/Hypotrochoid.html

    //setting variables for dark pink hypotrochoid
    var x3;
    var y3;
    var a3 = 600;
    var b3 = 50;
    var h3 = mouseY;

    noFill();
    stroke(227, 92, 250);
    strokeWeight(4);
    translate(width/2, height/2); //translate to middle of canvas
    beginShape();
    for(var i = 0; i < nPoints; i++) {
        var t3 = map(i, 0, 100, 0, TWO_PI);

        x3 = (a3 - b3)*cos(t3) + h3*cos(((a3 - b3)/ b3) * t3);
        y3 = (a3 - b3)*sin(t3) - h3*sin(((a3 - b3)/ b3) * t3);
        vertex(x3, y3);
    }
    endShape(CLOSE);

}
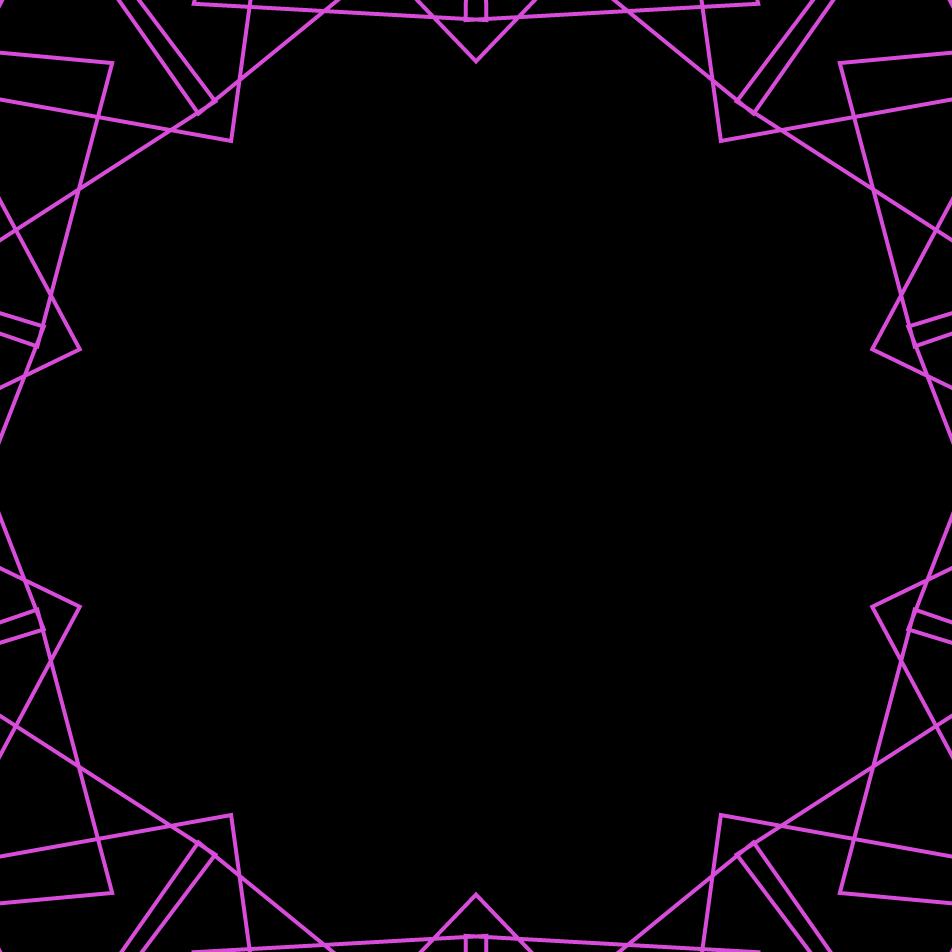
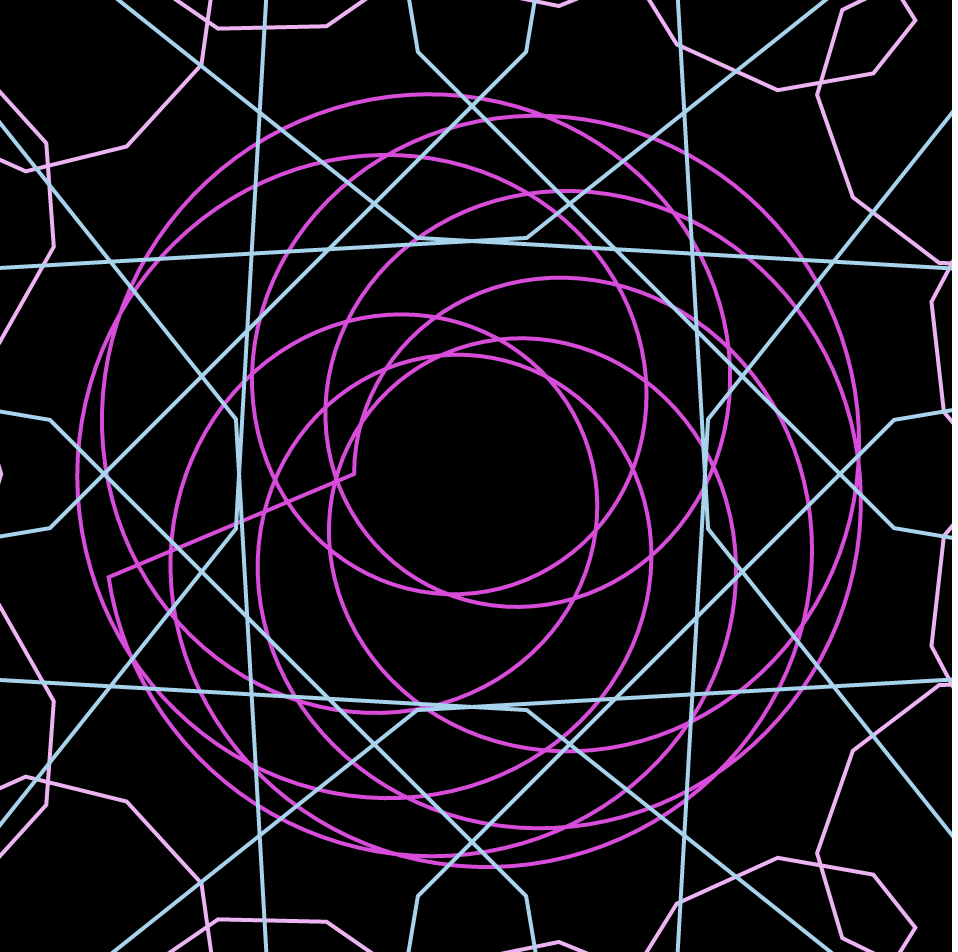
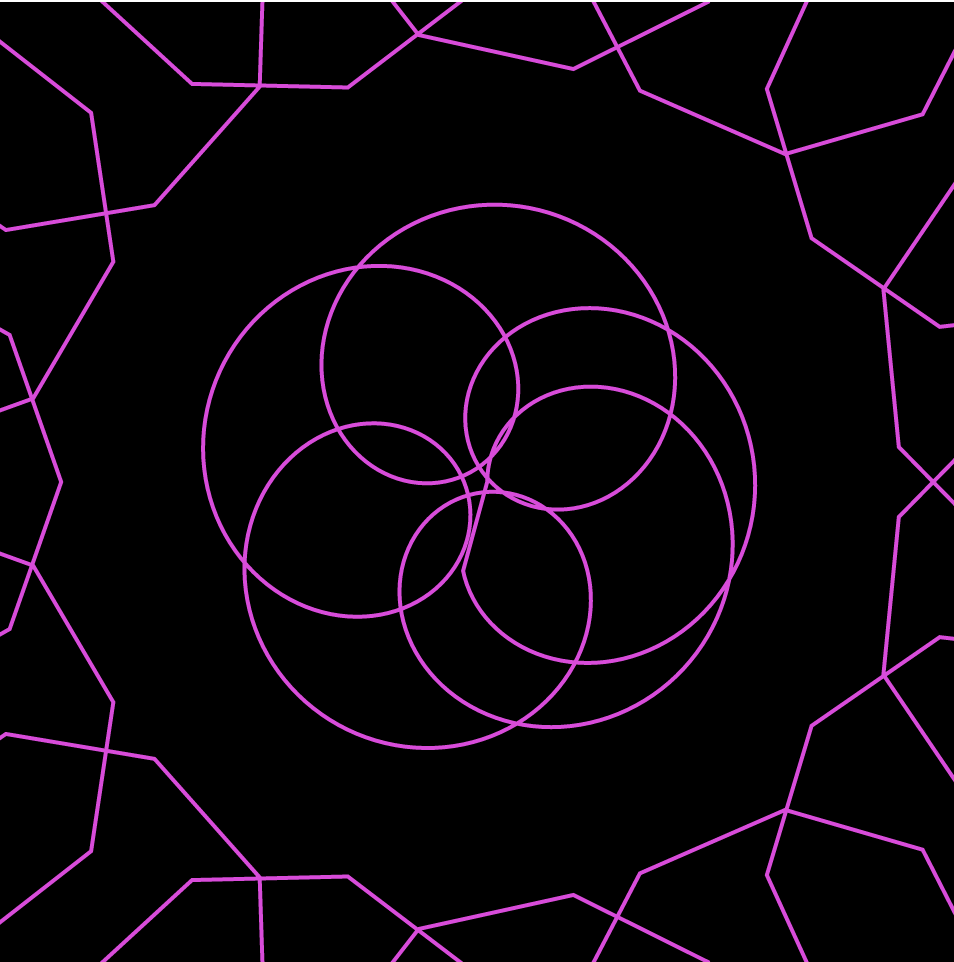
During the project, I didn’t know exactly what I was looking for. I spent a lot of time on the MathWorld site simply trying to decide what kind of curves to play with. I ended up playing with different epispirals and astroids before becoming intrigued with hypotrochoids. I started playing around with the equations itself, plugging in different numbers to simply experiments with how that affects the curve and the interaction it has with the canvas.


![[OLD FALL 2019] 15-104 • Introduction to Computing for Creative Practice](wp-content/uploads/2020/08/stop-banner.png)