/*
Joanne Chui
Section C
Project 6
*/

var nPoints = 200;

function setup(){
  createCanvas(400,400);
  frameRate(10);
}

function draw(){
  background(227, 127, 190);
  stroke(227, 175, 127);
  spirograph();
  push();
  translate(200, 200);
  for(var a = 0; a < 5; a++){
    rotate(a * PI/2);
    strokeWeight(3);
    spirograph();
  }
  pop();

}

function spirograph(){
  var x = constrain(mouseX, 0, width);
  var y = constrain(mouseY, 0, height);
  var r = 40;
  var s = 100;

  push();
  translate(200, 200);
  beginShape();
  noFill();
  for(i = 0; i<nPoints; i++){
    var t = map(i, 0, nPoints, 0, 5*TWO_PI);
    x = (s - r)*cos(r*t/s) + i*(mouseX/100)*cos((1 - r/s)*t);
    y = (s - r)*sin(r*t/s) + i*(mouseX/100)*sin((1 - r/s)*t);
    vertex(x, y);
  }
  endShape(CLOSE);
  pop();
}


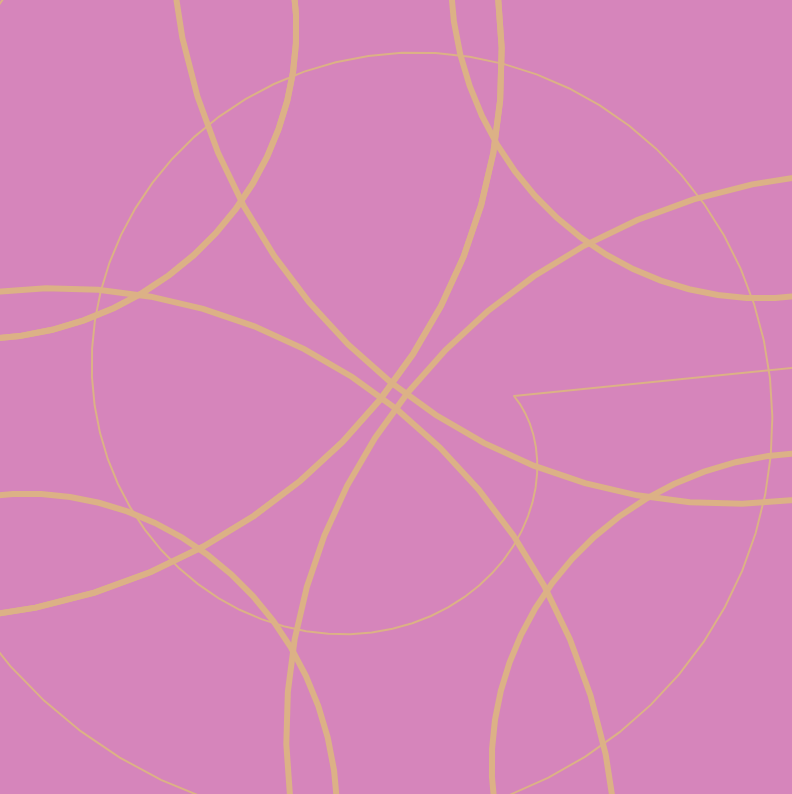
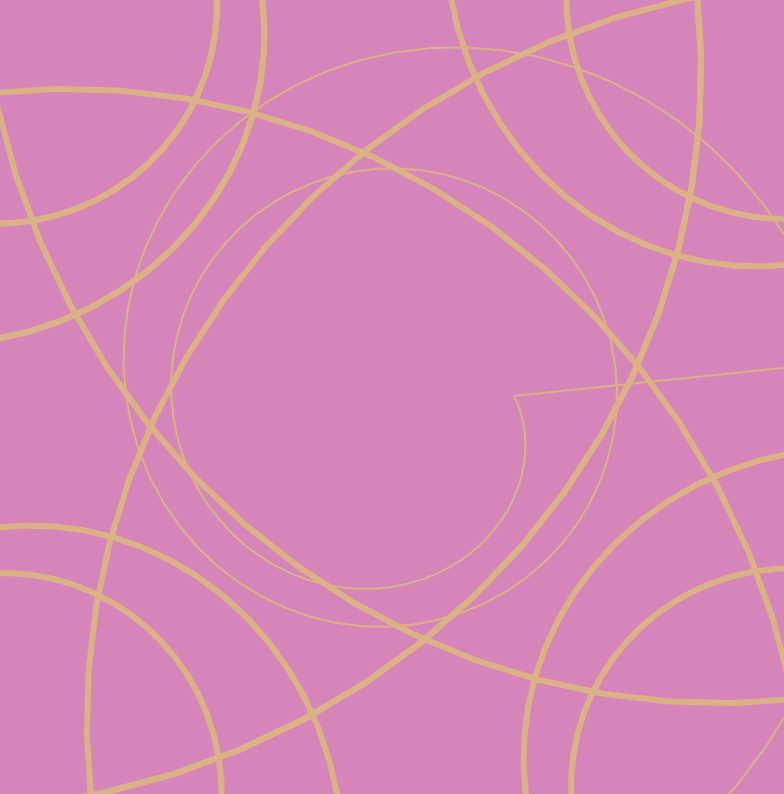
I made the original curve visible so that when a pattern is generated on the screen you can see where the pattern is derived from. I also liked the look of fewer lines so that the pattern seems more abstract.
![[OLD FALL 2019] 15-104 • Introduction to Computing for Creative Practice](wp-content/uploads/2020/08/stop-banner.png)