![[OLD FALL 2019] 15-104 • Introduction to Computing for Creative Practice](wp-content/uploads/2020/08/stop-banner.png)
//Charmaine Qiu
//charmaiq@andrew.cmu.edu
//section E
//Project - 07 - Composition Curve
function setup() {
createCanvas(480, 480);
}
function draw() {
//set color to change with movement of mouse
background(mouseX, mouseY, 100);
drawHypotrochoid();
drawAstroid();
}
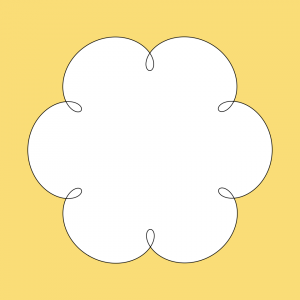
function drawHypotrochoid() {
//http://mathworld.wolfram.com/Hypotrochoid.html
//constraining the mouse action to the canvas
//map the variables in equation to a fit proportion of the curve
var x = constrain(mouseX, 0, width);
var y = constrain(mouseY, 0, height);
var a = map(x, 0, width, 150, 200);
var b = map(y, 0, height, 0, 50);
var h = map(x, 0, width, 0, 50);
//draw the first curve
push();
strokeWeight(10);
beginShape();
//rotate so that the beginning of curve does not show
rotate(radians(120));
//for loop that makes the shape
for(var i = 0; i < 300; i += .045){
var t = map(i, 0, 300, 0, TWO_PI);
//equation of the curve
x = (a - b) * cos(t) + h * cos(((a - b) / b) * t);
y = (a - b) * sin(t) + h * sin(((a - b) / b) * t);
vertex(x, y);
}
endShape(CLOSE);
pop();
//drawing the sencond curve
push();
//place it at the right bottom corner of canvas
translate(width, height);
strokeWeight(10);
beginShape();
//for loop that makes the shape
for(var i = 0; i < 300; i += 0.045){
var t = map(i, 0, 300, 0, TWO_PI);
//equation of the curve
x = (a - b) * cos(t) + h * cos(((a - b) / b) * t);
y = (a - b) * sin(t) + h * sin(((a - b) / b) * t);
vertex(x, y);
}
endShape(CLOSE);
pop();
}
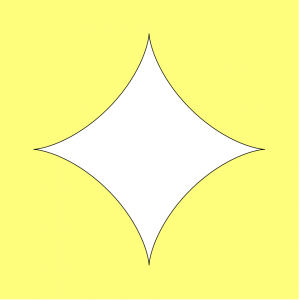
function drawAstroid(){
//http://mathworld.wolfram.com/Astroid.html
//draw first curve
push();
//place curve at center of canvas
translate(width / 2, height / 2);
strokeWeight(10);
//constraining the mouse action to the canvas
//map the variables in equation to a fit proportion of the curve
var x = constrain(mouseX, 0, width);
var y = constrain(mouseY, 0, height);
var a = map(mouseX, 0, width, 150, 200);
beginShape();
//for loop that makes the shape
for(var i = 0; i < 2 * PI; i += 0.045){
//rotate with the increment of mouseX
rotate(radians(x));
//equation of the curve
y = a * pow(sin(i), 3);
x = a * pow(cos(i), 3);
vertex(x, y);
}
endShape();
pop();
//draw first curve
push();
//place curve at center of canvas
translate(width / 2, height / 2);
strokeWeight(10);
//constraining the mouse action to the canvas
//map the variables in equation to a fit proportion of the curve
var x = constrain(mouseX, 0, width);
var y = constrain(mouseY, 0, height);
var a = map(mouseX, 0, width, 20, 70);
beginShape();
//for loop that makes the shape
for(var i = 0; i < 2 * PI; i += 0.045){
//rotate with the increment of mouseY
rotate(radians(y));
//equation of the curve
y = a * pow(sin(i), 3);
x = a * pow(cos(i), 3);
vertex(x, y);
}
endShape();
pop();
}
In this project, it was fun to explore the different kinds of curves that can be created with math equations, and it intrigues me how interesting patterns can be generated through math. I took a pop art approach to my project by using bright colors and thick outlines.