LO-09

After browsing through the Looking Outwards posts by my classmates, Maggie’s 3D Computer Graphics post on the Amigos Project by Zigor Samaniego caught my attention. Amigos Project is a series of art by Samaniego started in 2016 using tools such as Photoshop, Pixologic Zbrush, Maxon Cinema 4D, and Wacom Cintiq. As Maggie pointed out, these computer-generated “monsters” are super cute, a reason why I wanted to learn more about it. As they also mentioned, it’s really interesting and impressive how Samaniego was able to achieve such realistic textures using 3D rendering tools to create the adorable “realistic” creatures. Along with that, I am also fascinated by how Samaniego made certain choices while programming and designing to be able to maintain the creatures’ “cuteness” despite making them super realistic (especially since the “more real” something appears, the less “cute” it becomes).

Amigos Project 5
Amigos Project 7

LO 09 – On Looking Outwards

All Streets Limited (2007) by Ben Fry

In Bon’s Looking Outwards on Data Visualization, he examined All Streets Limited by Ben Fry. Fry used data from the U.S. Census Bureau to code the map in Javascript, which consists of 240 million individual road segments across the United States. He applied the Albers equal-area conic projection to obtain the longitude and latitude coordinates of the streets. I agree with Bon that the illustration provides a macro view of our national interconnectedness. After doing my own research, I also found it interesting that the map contains no other terrain (canyons, rivers, mountains, etc.), yet we can still see the shapes of these natural forms emerge as roads weave and navigate around, demonstrating the power dynamics between the natural and artificial/industrial. 

Ben Fry’s All Streets Limited.
Closeup of the roadless terrain that forms the Appalachian Mountains.

Project-09: Portrait

For this week’s project, I chose to draw a picture of me when I was a baby holding up a peace sign. I tried to draw the portrait by mimicking short paint strokes. To do so, instead of making random dots, I drew random short lines whose directions can be changed by pressing the mouse (there is a total of 4 directions). I also thought it would be interesting to see how the different directions of the same shape can alter the way the portrait was drawn so ran the code several times with the direction being different each time.

sketch
let img;
var lineType = 1;

function preload() {
	img = loadImage("https://i.imgur.com/dy7iC57.jpg");
}

function setup() {
  createCanvas(480, 480);
  background(255);
  img.resize(width, height);
  img.loadPixels();
  frameRate(50);
}

function draw() {
  	var x = floor(random(img.width)); // random x position
  	var y = floor(random(img.height)); // random y position
  	var pixel = img.get(x, y); // single pixel from image (color)
  	stroke(pixel);
  	strokeWeight(3);
	if(lineType == 1) { // slanted lines starting from left
  		line(x, y, x + 7, y + 7);
  	}
 	else if(lineType == 2){ // horizontal lines
  		line(x, y, x + 7, y);	
  	}
  	else if(lineType == 3){ // slanted lines starting from right
  		line(x + 7, y, x, y + 7);
  	}
  	else { // vertical lines
  		line(x, y, x, y + 7);
  	}
}

function mousePressed() {
	if(lineType == 1) {
		lineType = 2;
	}
	else if(lineType == 2) {
		lineType = 3;
	}
	else if(lineType == 3) {
		lineType = 4;
	}
	else {
		lineType = 1;
	}
}
final with all strokes
final with one type of stroke (slanted from left)

Project 09 – Portrait of my Brother

For my portrait I chose to draw my little brother. I had him choose his favorite images from a set of keyboard symbols. The random symbols increase in size as the mouse moves to the right. Symbols also draw along with mouse movement. If you click the mouse, the canvas wipes white and resets.

Maggie – Portrait
//Maggie Ma
//Section D
//Self-Portrait

let img;
let symbols=["☻","☺","♬","☾","⍣","㋡","☀","♟"]; //array of symbols

function preload() {
  img = loadImage('https://i.imgur.com/M8aUttC.jpg'); 

}

function setup() {
  createCanvas(400, 533);
  background(255);
  img.loadPixels();
  noStroke();
}

function draw() {
  let x = floor(random(img.width)); //x position of symbols
  let y = floor(random(img.height)); //y position of symbols
  let pixels = img.get(x, y); //grab pixels from image

  //randomly select symbols from array
  var r = int(random(0,9));
  var randompicker = symbols[r]; 


  fill(pixels); //fill symbol with proper pixel color
  //prevent symbols from getting too large
  //symbols increase in size as mouse moves to right
  textSize(mouseX/20); 
  text(randompicker, x,y);

  //draw symbols as mouse moves
  textSize(10);
  text(randompicker, mouseX, mouseY);

  //refresh to white canvas when mouse is pressed
  if (mouseIsPressed) {
  	background(255);
  }
}
Beginning of Rendering.
Middle of Rendering.
Near-completed Render.
Original of my adorable brother.

Project-09 Portrait

project
let portrait;
var radius = 0;
var angle = 0;
var framecount = 1;
var size = 0.5;

function preload() {
  portrait = loadImage('https://i.imgur.com/EquKB8x.png');
}

function setup() {
  createCanvas(480, 480); 
  background(0);
  imageMode(CENTER);
  portrait.loadPixels();
}

function draw() {
  var centerX = width/2;
  var centerY = height/2;
  var circleX = radius * cos(radians(angle));
  var circleY = radius * sin(radians(angle));

  var clrX = random(0, width);
  var clrY = random(0, height);
  var clr = portrait.get(clrX, clrY);

  //pointillize 
  for (var i= 0; i < 10; i++) {
    fill(clr);
    circle(clrX, clrY, size);
  }

  //top left spiral of hearts of image 
  noStroke();
  var clr1 = portrait.get(circleX, circleY);
  fill(clr1);
  drawHeart(circleX, circleY, 15);

  //bottom right spiral of hearts of image 
  push();
  translate(centerX, centerY);
  var clr2 = portrait.get(480-circleX, 480-circleY);
  fill(clr2);
  drawHeart(centerX-circleX, centerY-circleY, 15);
  pop();

  topInstagramBar();
  bottomInstagramBar();

  radius += 0.1;
  angle += 7;

  frameCount += 1;
  if (frameCount > 13000) {
    //"instagram tag" of my nickname where mouse is 
    fill(85);
    triangle(mouseX, mouseY-10, mouseX+10, mouseY-20, mouseX-10, mouseY-20);
    rect(mouseX-40, mouseY-40, 80, 20);
    fill(255);
    text('rishdish', mouseX-20, mouseY-27);

    //stops when portrait is complete
    noLoop();
  }
}

function drawHeart(x, y, s) {
  beginShape();
  vertex(x,y);
  bezierVertex(x-s/2, y-s/2, x-s, y+s/3, x, y+s);
  bezierVertex(x+s, y+s/3, x+s/2, y-s/2, x, y);
  endShape(CLOSE);
}

function mousePressed() {
  //points get bigger as you click 
  size += 0.5;
  if (size == 7) {
    size = 0.5;
  }
}

function topInstagramBar() {
  //instagram bar 
  fill(240);
  rect(0, 0, 480, 30);

  //profile pic 
  fill(230, 210, 210);
  circle(20, 15, 15);
  stroke(195, 45, 140);
  noFill();
  circle(20, 15, 18);
  noStroke();
  fill(0);
  text('15-104',35, 19);

  //three dots in right hand corner
  fill(10);
  circle(455, 15, 3);
  circle(460, 15, 3);
  circle(465, 15, 3);
}

function bottomInstagramBar() {
  //instagram bar 
  fill(240);
  rect(0, 450, 480, 30);
  
  //"like" icon
  stroke(0);
  fill(255);
  drawHeart(20, 460, 15);
  
  //"comment" icon
  triangle(53, 471, 60, 471, 58, 467);
  circle(50, 465, 16);
  stroke(255);
  circle(55, 468, 5);

  //"share" icon
  stroke(0);
  triangle(75, 457, 92, 457, 80, 463);
  triangle(80, 463, 92, 458, 82,472);

  //"save"icon
  beginShape();
  vertex(454, 457);
  vertex(454, 472);
  vertex(460, 467);
  vertex(466, 472);
  vertex(466, 457);
  endShape(CLOSE);

  //image scroll through icons
  noStroke();
  fill(65, 141, 204);
  circle(230, 465, 5);
  fill(165);
  circle(240, 465, 5);
  circle(250, 465, 5);
}

Start of portrait/halfway completed portrait
Completed portrait

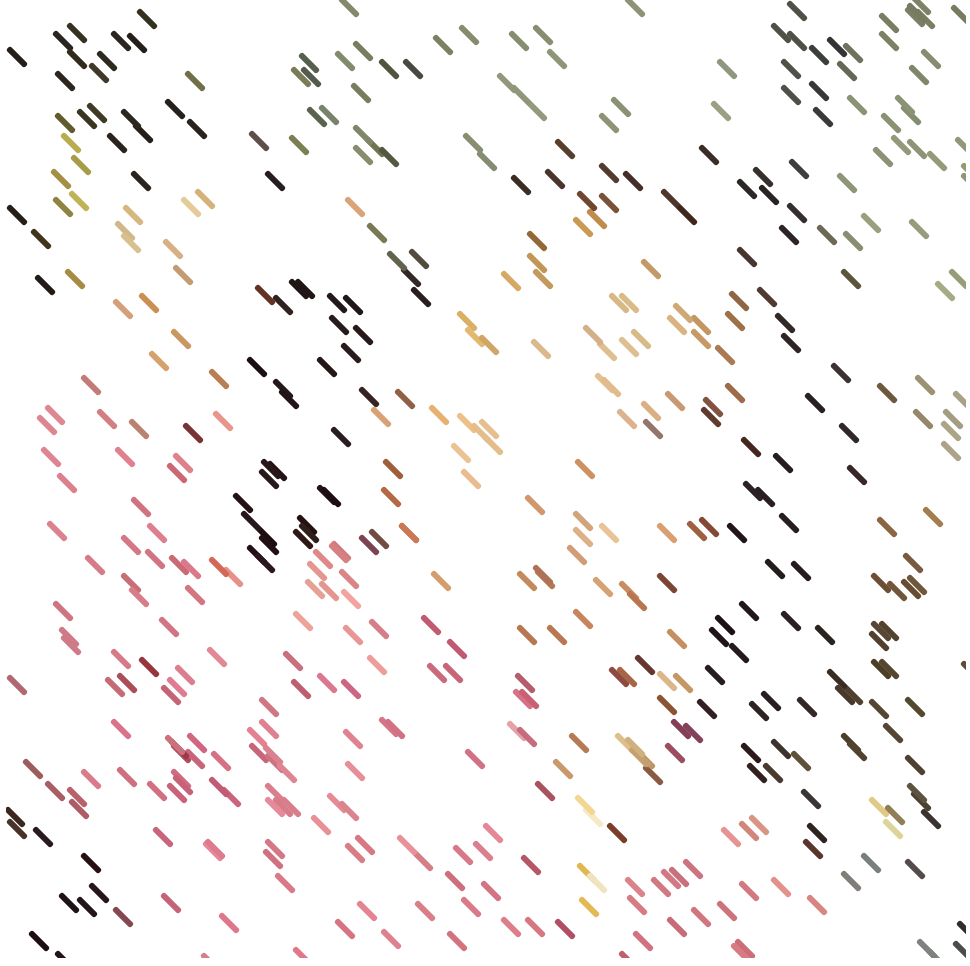
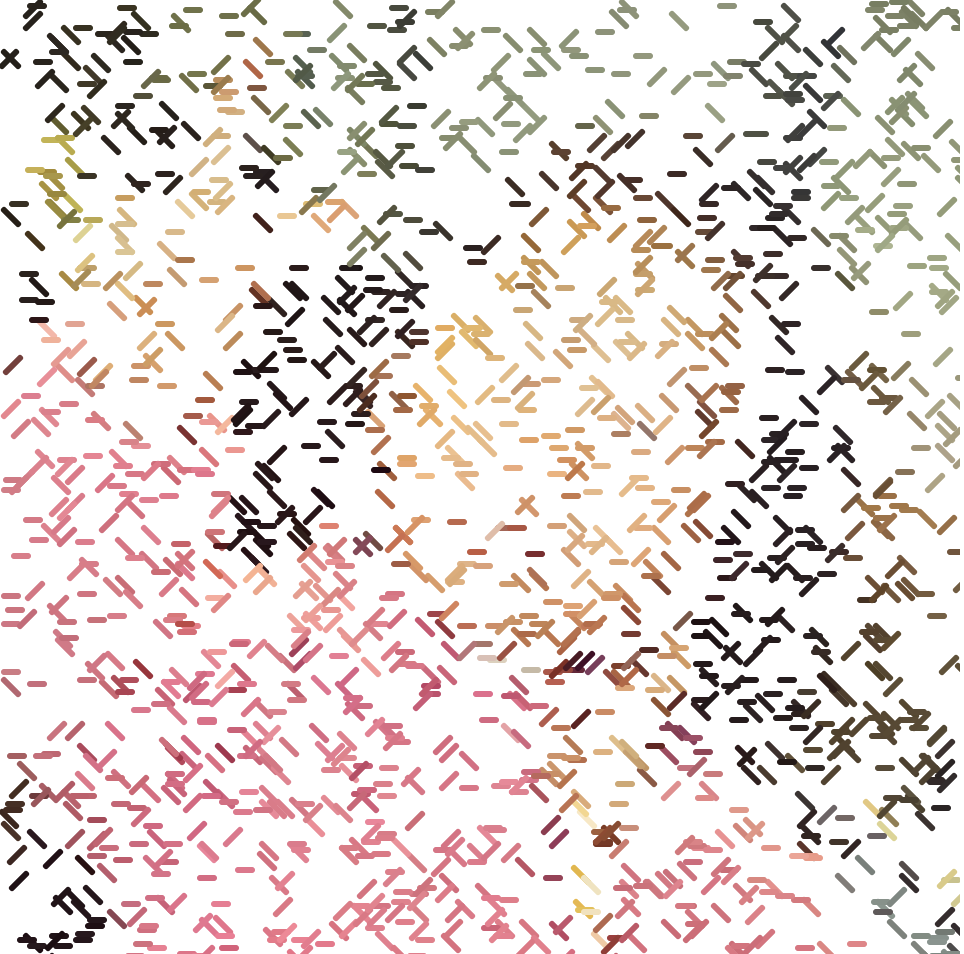
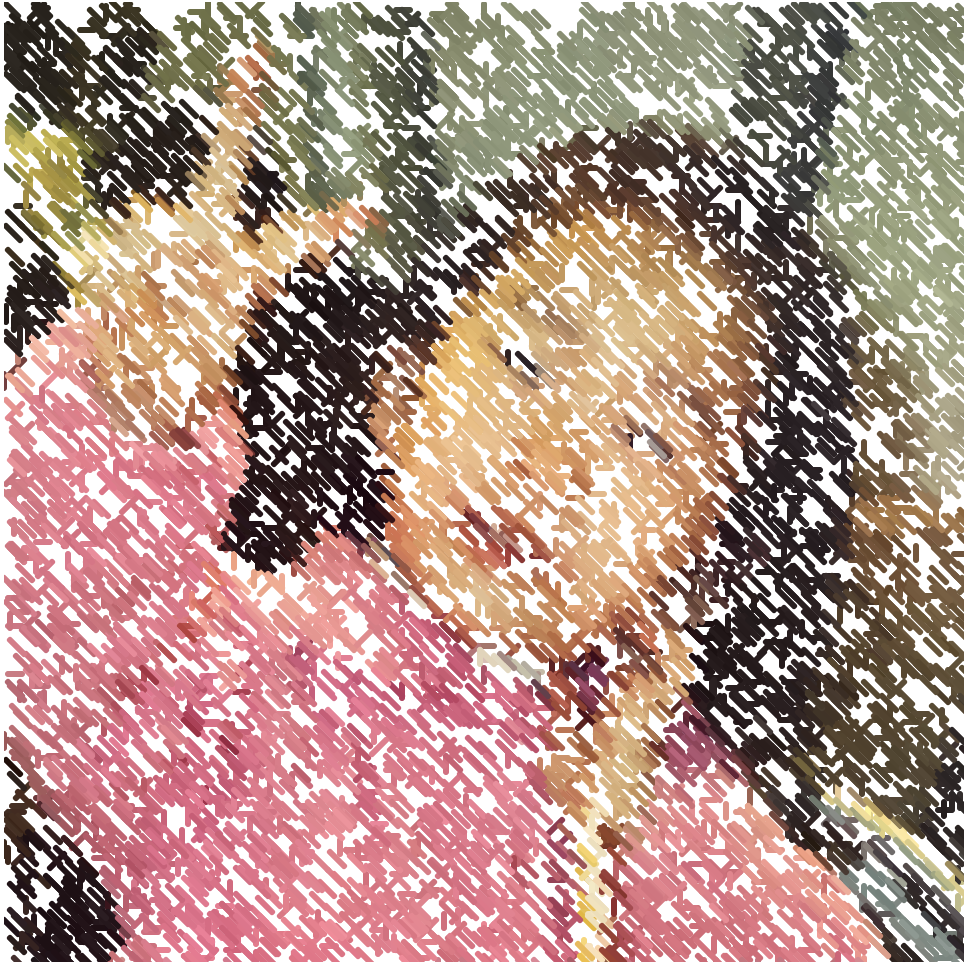
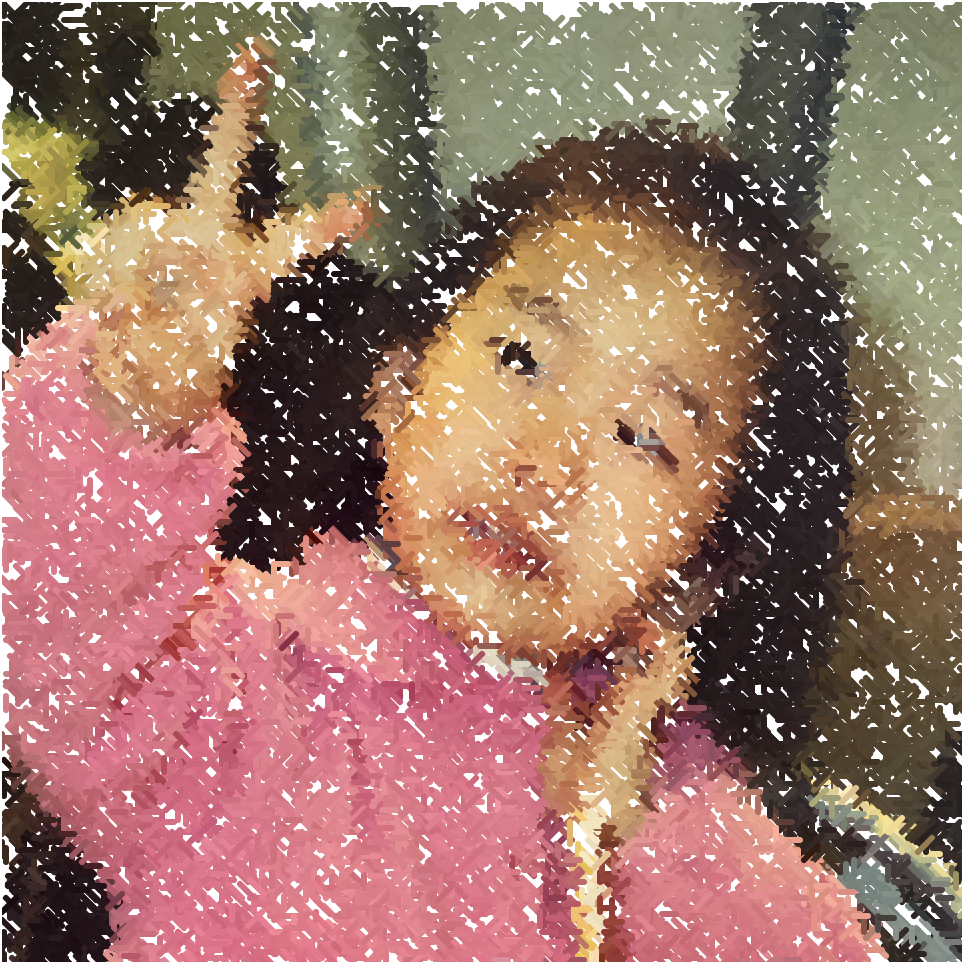
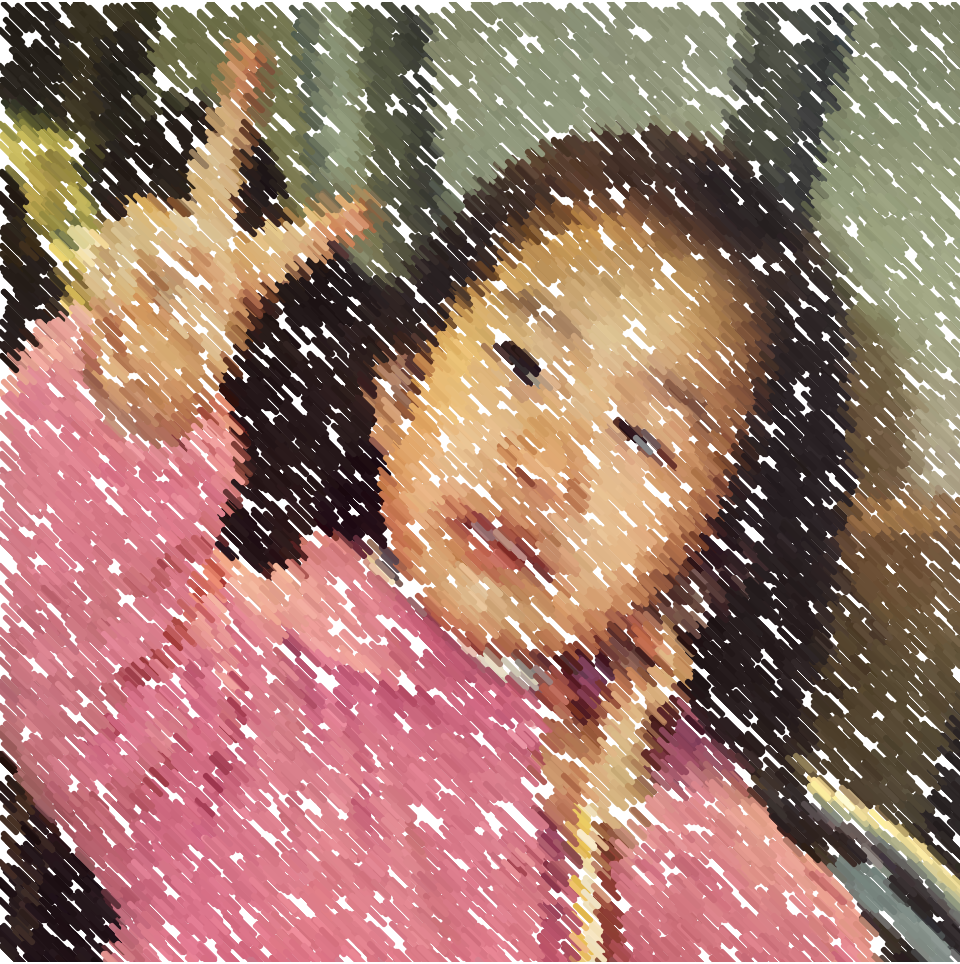
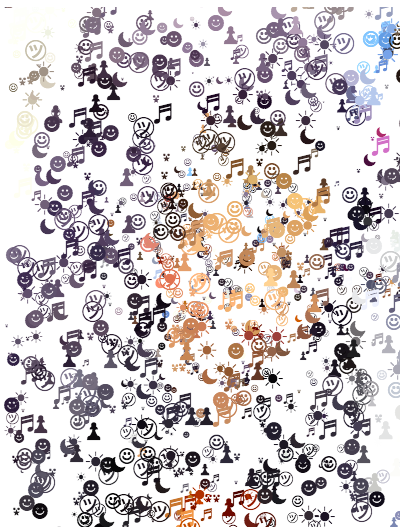
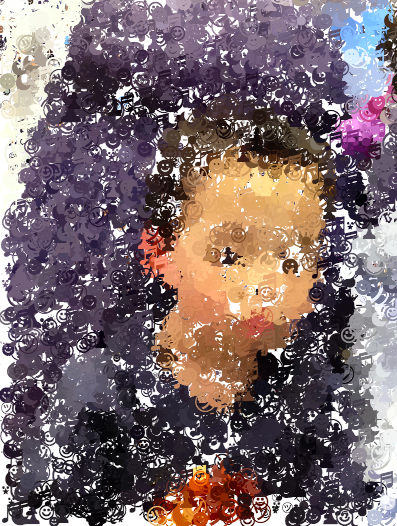
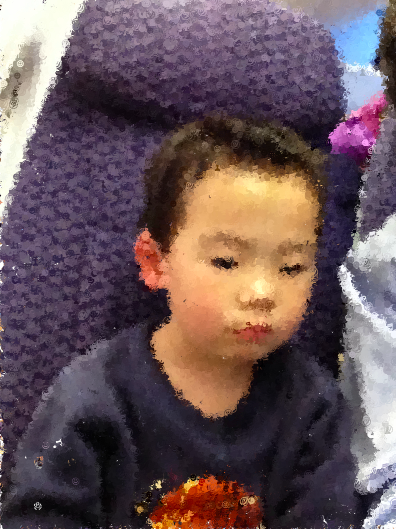
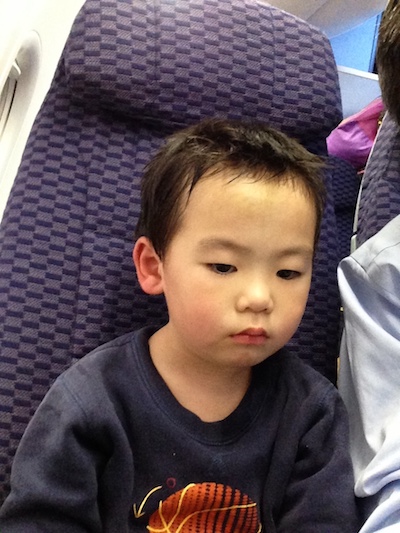
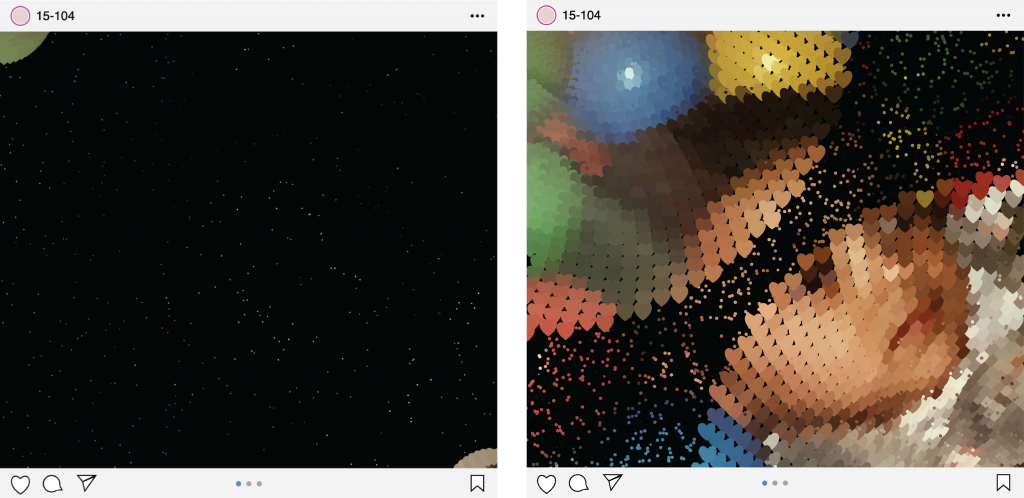
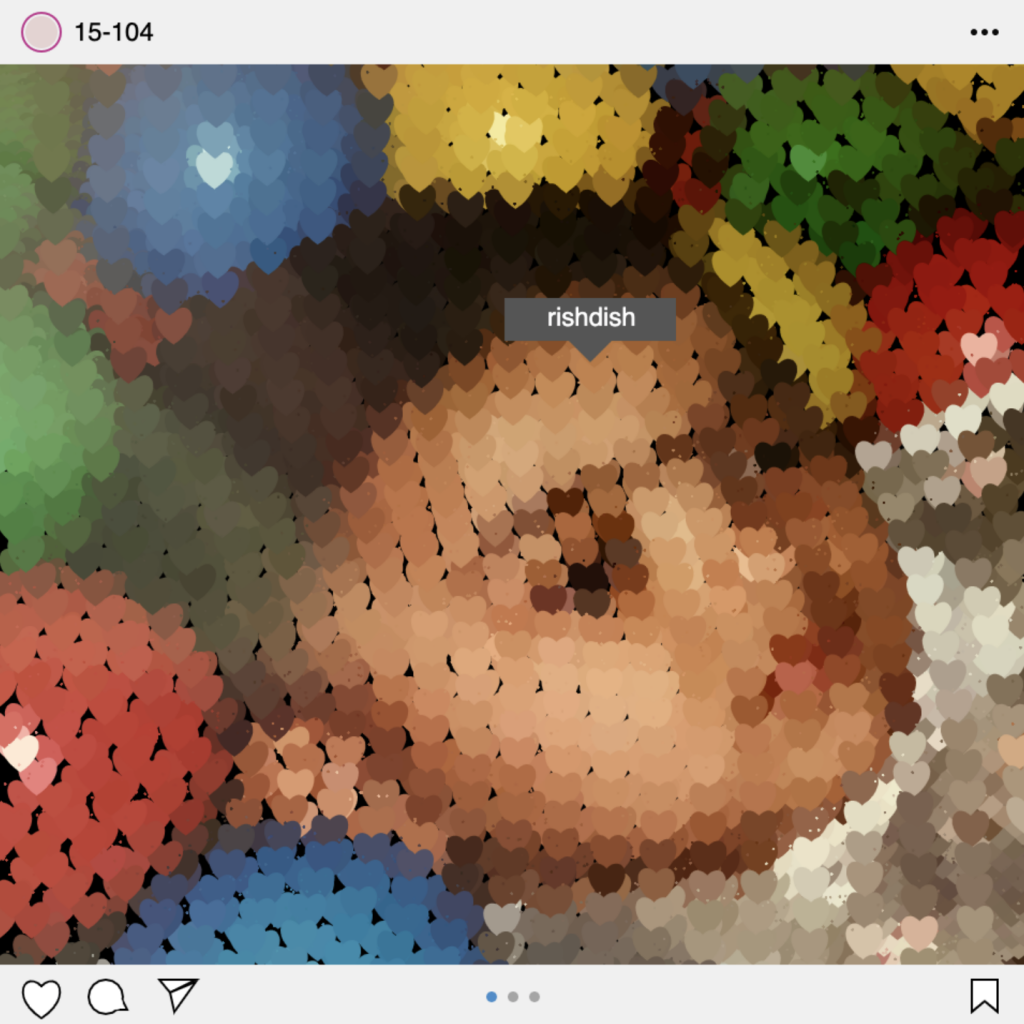
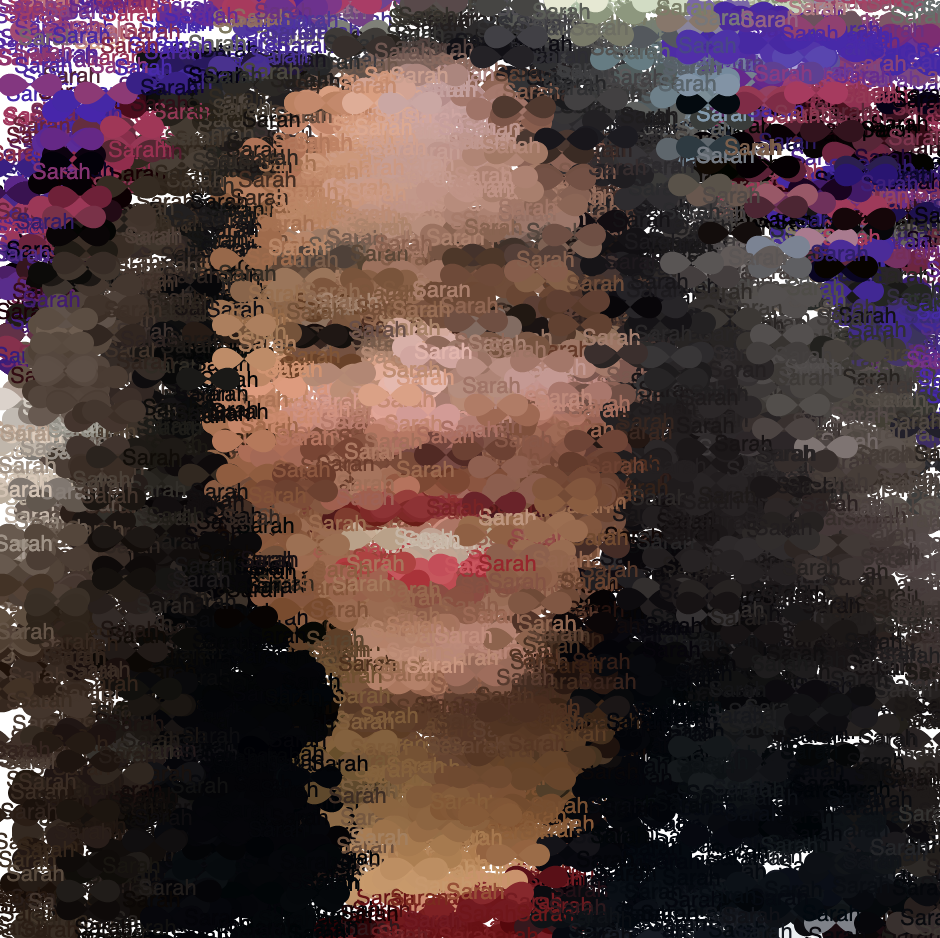
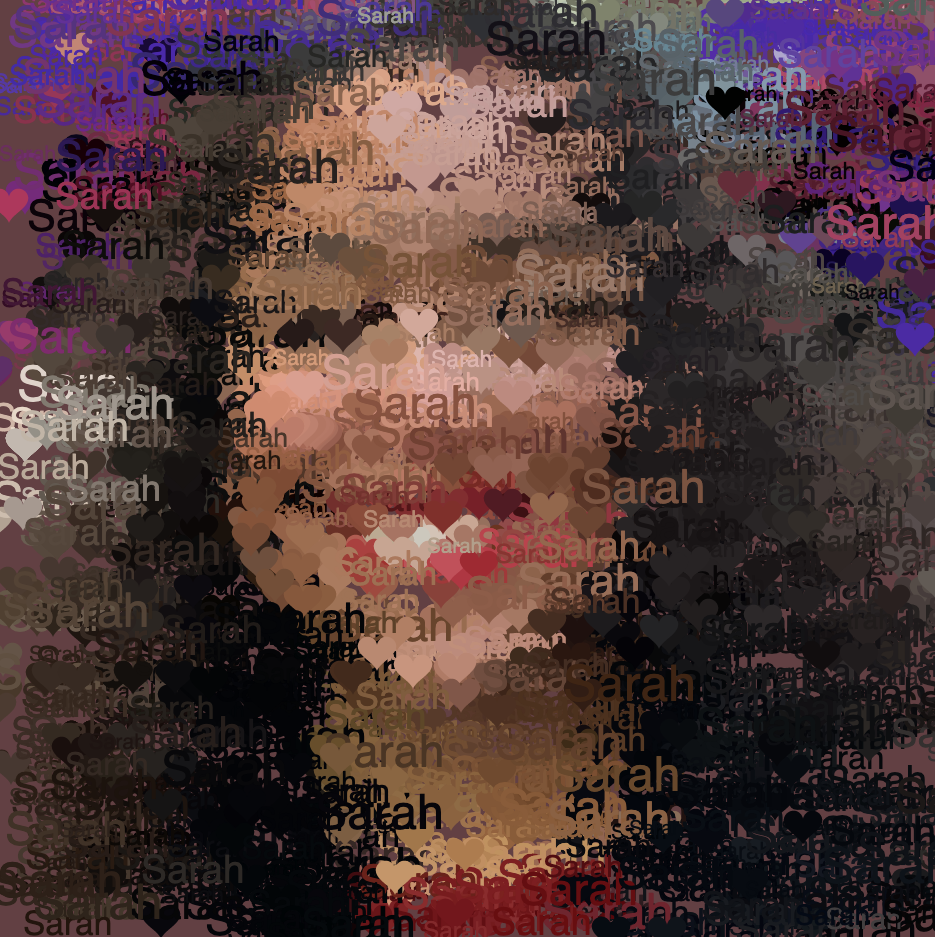
I used a photo of me as a baby for this. Once I had the two spirals of hearts running, I added the icons to make it look like an instagram post. When you click, the size of the points in the background increases. When the portrait is done running, an Instagram tag shows up where the mouse is with my childhood nickname.

Project 9: Portrait

I really wanted to implement a little bit of what we did two weeks ago, so I created a heart and infinity code, and used those as pixels. I have four different “portraits” each time the mouse is clicked. The first one randomly draws hearts and draws the text “This Is Me” with your cursor. The second one randomly draws the text “Sarah” and draws infinity signs with you cursor. The third one randomly draws infinity signs and draws the text “This Is Me” with your cursor. The fourth one randomly draws random sizes from 10 to 25 of the text “Sarah” and draws infinity signs with you cursor. Additionally, every click increases (to a certain number) sizes of all the pixels, and changes the transparency of the background and decreases (to a certain number), going back and forth between the two.

sketch.slslslDownload
// Sarah Luongo   
// sluongo
// sluongo@andrew.cmu.edu
// Project

// This code aims to draw a self-image with pixels.

var oI; // 'Original image'
var nP = 1; // 'New portrait'
var t = 210; // 'Transparency'
var tS = 10; // 'Text size'
var hS = .3; // 'Heart size'
var iS = 15; // 'Infinity size'
incT = 51; // Variable to increase size of transparency
incH = .1; // Variable to increase size of hearts
incIT = 1; // Variable to increase size of texts and infinity sign

// Loads image
function preload() {
    var ImageURL = "https://i.imgur.com/UJthwzP.jpg";
    oI = loadImage(ImageURL);
}

function setup() {
    createCanvas(480, 480);
    oI.resize(width, height); // Resizes original image
    background(59, 17, 21, t); // Redish
    oI.loadPixels();
    frameRate(60); // Rate pixels are drawn
    t = 0;
}

function draw() {
    // Generates random locations for the pixels within image size 
    var pX = floor(random(oI.width));
    var pY = floor(random(oI.height));
    var cP = oI.get(pX, pY); // 'Color picker' based on location of pixel
    var cM = oI.get(mouseX, mouseY); // Color selected based on mouse location
    noStroke();

    if (nP == 1) {
        // Draws heart pixels randomly
        fill(cP);
        heart(pX, pY);
        // Draws text pixels w/ cursor
        fill(cM);
        textSize(tS);
        text("This Is Me", mouseX, mouseY);
    } else if (nP == 2) {
        fill(cP);
        textSize(tS);
        text("Sarah", pX, pY);
        fill(cM);
        infinity(mouseX, mouseY);
    } else if (nP == 3) {
        fill(cP);
        infinity(pX, pY);
        fill(cM);
        textSize(tS);
        text("This Is Me", mouseX, mouseY);
    } else {
        fill(cP);
        textSize(random(10, 25));
        text("Sarah", pX, pY);
        fill(cM)
        heart(mouseX, mouseY);
    }	
}

// Heart Curve
// https://mathworld.wolfram.com/HeartCurve.html
function heart(pX, pY) {
    var da = .01; // How round the "curve" is
    // Creates the heart curve
    beginShape();
    for (var t = 0; t <= TWO_PI; t += da) {
        // The parametric equations found on the website commented above
        var x = (16*(pow(sin(t), 3))) * hS;
        var y = (13*cos(t)-5*cos(2*t)-2*cos(3*t)-cos(4*t)) * -hS;
        vertex(x+pX, y+pY);
    }
    endShape();
}

// Infinity Curve
// https://en.wikipedia.org/wiki/Lemniscate_of_Bernoulli
function infinity(pX, pY) {
    var da = .01;
    // Creates the infinity curve
    beginShape();
    for (var t = 0; t <= TWO_PI; t += da) {
        // The parametric equations found on the website commented above
        var x = (iS*cos(t))/(1+(pow(sin(t), 2)));
        var y = (iS*sin(t)*cos(t))/(1+(pow(sin(t), 2)));
        vertex(x+pX, y+pY);
    }
    endShape();
}

function mousePressed() {
    if (nP == 4) {
        clear();
        background(59, 17, 21, t);
        nP = 1;
    } else {
        clear();
        background(59, 17, 21, t);
        nP += 1;
    }
    // Increase size of each pixel symbol
    t += incT;
    tS += incIT;
    hS += incH;
    iS += incIT;
    // Decrease size after certain point
    if (t == 255 || tS == 30 || hS == 1.5 || iS == 30) {
        incT *= -1;
	incH *= -1;
	incIT *= -1;
    } if ( t == 1 || tS == 10 || hS == .3 || iS == 15) {
	incT *= -1;
	incH *= -1;
	incIT *= -1
    }
}
First portrait at 1 minute w/o drawing w/ cursor
After a minute using cursor
After 30 secs w/ cursor

LO -09

Looking at Zimmy’s post from week six, she wrote about Manolo Gamboa Naon and his piece “Mantel Rojo.”
The theme for the week was Randomness. What really drew meto the post was the image of the work. As Zimmy describes, there is no focal point making the viewer see the piece as a whole. I definitely agree that it is very intruging how the longer you look the more details become apparant. The random aspect of the piece is how the shapes are generated.
Zimmy does a great job explaining how the composition draws the attention of the viewer. To add to her discussion It is very cool how the pseudo-randomness created some small patterns only really noticable when looking at the details where the swirls create a path that the viewers eyes follow.

LO – 9

I chose Hayoon’s 7th Looking Outwards post to examine in greater detail. She highlighted the data visualization“We feel fine” project created by Jonathan Harris. Like Hayoon, I found the subject matter of emotion a really intriguing topic to visualize. I had just watched a lecture about the complexity and necessity of emotion as a consideration in design solutions earlier this semester; this made data visualization of this concept all more important in my eyes. I also took note of the extensive use of color to categorize information. Furthermore, I believe that the use of text and simple shapes was pretty ingenious at representing complex information, especially with a concept as abstract and conventionally-unquantifiable as emotion. It goes to show that smart design does not need to use the most groundbreaking techniques, but can instead solve the problem efficiently using what is available. I also thought it was a good design choice to incorporate photographs as a way to humanize and contextualize the data. In examining Hayoon’s interpretations of her chosen project, I was able to take a different approach to examining Harris’ insightful initiative.

I especially enjoyed Harris’ interpretation of mood swings and how the colors relate 2 data visualizations together.

LO-9

For this week’s LO, I decided to revisit my friend Sean’s LO from Week 3, in which he wrote about BLOOMS, a group of sculptural computer fabricated pieces by John Edmark that was created around 4 years ago.

Sean mostly covered all the basics of the project, but upon more research, I was surprised to find out that the forms of the pieces are actually each based on a different algorithm, such as the Fibonnaci sequence or the golden rectangle/angle. Additionally, while Sean described the process that Edmark uses to create videos pretty accurately, I was surprised to learn that the timing between each frame is created using progressive rotations of the golden ratio, also known as phi. This angle and shape is mostly commonly seen in sunflower centers and pinecone-like forms in nature. I found it interesting that everything from the form to the frame timing ties in together to create nature-like forms in the final product: some of the forms even look like pinecones or something that could be found in a cellular structure of something. 

LO – 9

I decided to look at Helen Cheng’s looking outwards from week 2. It was on Robert Hodgin’s ‘Traffic’ piece. Being a driver myself, I found this piece very interesting and agreed on many of the points Helen mentioned in her blog post. The simulation is busy, and the cars have an “aggressiveness” to them like humans do. I can’t tell you how many times I’ve been overwhelmed by cars running reds, blocking the intersection, etc. People don’t always make the smartest decisions on the road, and this simulation captures it pretty well. The thing I find the most interesting, however, is the attempt to make a computer act human. Even with the “aggressiveness” coded in, this project doesn’t make accidents happen and the traffic still flows more seamlessly than traffic in real life. I know it would be much more difficult to code and he wanted to keep things pretty simple, but it somewhat works in a way. What I mean by that is the whole idea of self-driving cars. Once self-driving cars are at their finest, and everyone is using them accidents should be minimal and traffic will probably look quite similar to this. It was very interesting to think about how code can be manipulated to show human flaws, and on the flip-side, give us insight into what automation has the potential for.

As always, here’s the link to Robert’s website:

And two videos of his simulation: