LO-07: Expression of Elements

Artist: Nicholas Felton
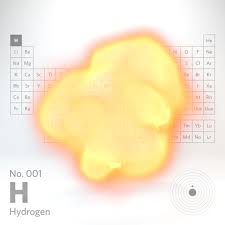
Piece: Elements
Date: 2017-Present

Felton with his piece “Elements” created a better experience for learning. In a concept like the periodic table, many elements are hard to visualize. Felton creates impressive 3D renderings to show what each element looks like in its natural state. Felton described the purpose of this piece is to practice techniques needed to show different states of matter. Additionally, with some elements only having slight differences between one another, the level of detail needed is a good way for him to practice micro-details in renderings. Felton’s artistic sensibilities are shown through the attention to detail and the interpretation of elements that are not easily visualized. The best example is hydrogen. Hydrogen is not an element seen by the human eye, but by utilizing computational tools, Felton was able to create an accurate depiction of the element. The piece also shows the position on the periodic table as well as the electron shells. The artwork not only is creative in its interpretations, but scientifically accurate. Creations like this are improving education and understanding of difficult concepts.

http://feltron.com/Elemental.html

Feltron: Elemental
Visual Representation of Hydrogen

Looking Outwards 07

Nicholas Feltron is an artist who uses code and computation to create his art. This piece I would like to talk about is on his website labeled BikeCycle. It shows a couple of different scenes that focus on the activity, popular routes, stations, bikes, and cyclist demographics within New York city. I admire this piece because I grew up being in the city weekly, it seems very cool to see my second home mapped out via bike schedules and routes. This piece was commissioned by the MoMA store. I am not sure how this dataset was collected and what algorithms were used in the making of this piece. This artist has a variety of computer generated informational art, as this seems to be his main artistic style.

http://feltron.com/BikeCycle.html

Looking Outwards 07: Information Visualization

Facebook Stories: Virality by Rachel Binx
https://rachelbinx.com/Facebook-Stories-Virality
jwesthei, Section B

This project is a play on the concept of going “viral” and how this can be visualized. Aesthetically very similar to the “Self-Dividing Line” project I reviewed last week, this one visualizes how one a piece of media (in this case three of the most shared images on Facebook) ends up being shared hundreds of thousands of times on a social media platform.

A screenshot of one of the videos from Rachel Binx’s “Facebook Stories: Virality” project (2013).

The pieces start as a single person and split off into branches as the media is shared. As the piece becomes shared and re-shared, the project visualizes the gender of the person sharing it as well as the relative age of the share as time progresses. The artist worked with Zach Watson to create the algorithm using the WebGL framework and animate this. I could not find a lot of information about the specifics of the algorithm used, but I would imagine it is similar to that of the “Self-Dividing Line,” where instead of randomly generated midpoints to split from, the time and number of branches come from actual data defining a shared media.

LO 07 – Information Visualization

The Rhythm of Food, a project lead by Moritz Stefaner and the Google News Lab, investigates seasonal patterns in food searches. By looking at Google search data and plotting over 130,000 data points, this team was able to create a radial “year clock” chart which reveals the seasonal trends for various food/drinks. For the visualiation, each year is represented by a different color, and the segmented block’s distance from the center represents the relative search interest. the project was built using ES2015, webpack, react, Material UI, and d3 v4. I particularly enjoy the evolution of the visualization, and how the team organically found their way to the seasonal trends. It can be a daunting task when attempting to investigate a complex cultural phenomenon, but when done well, it becomes easy to appreciate the simplicity of presentation.

Looking Outwards – 07

The project I chose is called Facebook Flowers by Stamen Design. Their work shows the activity of a Facebook post going viral. It takes on the form of a flower that blooms as the post gets reshared from person to person. Every new share creates a branch and reshares of that share show as an extension of the branch. I admire this piece because of the way it shows data while still creating an art piece in a way. I also really like how motion is used in this data visualization, which is not always included in other works. It is fascinating to watch how the data grows through this plant-like visualization.

Looking Outwards : 07

Conceived by Refik Anadol Studio “Melting Memories” offers new insights into the representational possibilities emerging from the intersection of advanced technology and contemporary art. A series of artworks are created by visualising different EEG(electroencephalogram) data collected. By representing the EEG data gives it a tactility that emphasises the materiality of memory. EEG data measures changes in brain wave activity and provides evidence of how the brain functions over time.

Anadol showcases his creative vision of “recollection” by translating the elusive process of memory retrieval into data collections. Melting Memories provides the viewer with revealing and contemplative works through the augmented data sculptures and light projections.

I find the way in which he broke down the various components of EEG data to produce these magnificent drawings which start to take on organic forms is fascinating. And how the title too relates back to the artists own experience with unexpected interconnections among seminal philosophical works, academic inquiries and artworks that take memory as their principal themes.

Looking Outwards – 07

Ben Fry’s piece called All Streets was created on April 24, 2008. It is compilation of 240 million segments of road compressed into the shape of the United States continent. Ben was joined by three teammates – Katy assembled high-resolution images for offset printing, James made sure that the prints’ densities were appropriate for the piece, and Chris helped write software. This software created tiles that could be combined into a high-quality, HD image.

All Streets by Ben Fry (April 24, 2008)

I admire this aspect of the project because compiling such an enormous amount of images into one is a feat, considering that most software has a hard time dealing with images more than 30,000 pixels wide. The software program that he developed is called Processing, an open source programming environment that allows for computational design and interactive media. His artistic sensibility in processing and visualizing data is clearly manifested in the final form of this piece. His interactions with informational data is transformed into piece that takes millions of individual road segments into one unified artwork.

A closer look at All Streets – roadless terrain creates the topography of the Appalachian Mountains

LO-07

Ben Fry is a leading member of Fathom, a team that creates programs and applications to visualize, analyze, and understand data of all sorts. They have a wide range of projects, such as COiN, which helps people read and understand contracts. The program breaks the document down into sections, provides definitions, and allows the reader to switch back and forth easily throughout the “living” document.
I like this project because everybody will have to sign multiple contracts and agreements in their lifetimes and most people will have questions as they are going through them. These would traditionally be directed to a lawyer, which can get expensive. This program provides a more even playing field for the average person, without needing to add the expense of a lawyer.
The algorithms that generated the work most likely focus on data analysis and key words that break the document into sections. While the creators do not have much artistic day in data, they were able to use creativity to determine how the agreements are presented in the program. Overall, this program has the potential to serve any adult who has access to a computer, making contracts less daunting overall.

COiN, a project by Fathom, founded in 2010

LO – 07 – Information Visualization

Fernanda Viegas, Wind Map, 2012. 

Fernanda Viegas’ “Wind Map”.

This project creates a real-time, or a “living portrait”, wind map of the United States during the winter months and uses the data to visualize an art piece in the process. The project uses motion of white lines over a black map of the U.S. to show the wind motions and heaviness by layering the white wind lines. 

Viegas notes that while it was an artistic endeavor originally, the map provides a variety of functions where people have used it for bird migration patterns, bicyclists, etc. Viegas uses data for this project from the National Digital Forecast Database and combines it with computational circulations that project the data in an abstracted, artistic way. The Wind Map uses “comet-like trails” to show the motion of the wind lines. The map is made entirely in HTML and JavaScript. 

Hurricane Sandy, October 30 Wind Map.

This project is successful in its multi-purpose presentation of wind data in the U.S. and its additional artistic purpose. Computationally creating the Wind Map creates a direct way to have updates to the data sets as the wind directions, intensity, etc. changes from day to day. This conveys accurate data for the day but also creates an art piece that is mesmerizing because of its constant movement. The Wind Map additionally impressively communicates the forecast data in a simplistic and easy to understand map consisting of two main elements; the base map and the wind lines.

Looking Outwards 7:

Nathalie Miebach combines her love of art, science, and data analysis to create interesting sculptures that reflect the primal forces of nature. She transforms data taken from massive storms and turns them into 3-dimensional sculptures. Meteorological data is taken and then transformed into sound, which is then arranged into a “musical score” built entirely of weather data. This score is then combined with the sounds of human experiences and interpretations of the weather, creating a juxtaposition of objective and subjective data. This musical composition is then turned into a sculpture that reflects both the empirical data, and nuanced human emotions of a storm.

I really appreciate the subjective, sensational effect the sculptures have. Some of them look like actual buildings being torn apart by the wind, and some look like the distortions and disturbances in the air as a storm rips through.

Nathalie Miebach's Sculptural Soundtracks for Storms – Brain Pickings
The chaos of a storm ripping through a city
Colorful Basket Weaving Sculptures by Nathalie Miebach Transform Weather  Data into Visual Art | Colossal
The volume and density of a hurricane