![[OLD FALL 2020] 15-104 • Introduction to Computing for Creative Practice](https://courses.ideate.cmu.edu/15-104/f2020/wp-content/uploads/2021/09/stop-banner.png)
//Robert Rice
//rdrice
//Section C

var x=[];       //bucket of x-coordinates for the vertices
var y=[];       //bucket of y-coordinates for the vertices
var a = 26.5;   //The scale of the curve
var n = 200;    //The curve's "resolution". How many vertexes are used to form the curves.
var q = 3;      //the number of petals

var rStart = 0;
var angle = 0;  //variable that contains the slow, global rotation
var dr = .1;    //speed of slow rotation

function setup() {
    createCanvas(480, 480);
    background(220);
    angleMode(DEGREES);  //me dum dum no like radians
}

function draw() {
    background(0);
    translate(width/2, height/2);   //sets center of the drawng to the center of the canvas
    stroke(255);
    strokeWeight(1);
    noFill();

    q = map(mouseY, 0, height, 3, 30, true);
    a = map(mouseX, 0, width, -26.5, 26.5, true);
    rStart = map(mouseY, 0, height, 0, 360);

    for (i= 0; i < n; i++) {    //calculates the base curve x and y-values
        let t = -10 + (20/n)*i  //calculates 't' values that are used to evaluate x and y components
        x[i] = 3*a*((t**2) - 3);
        y[i] = a*t*((t**2) - 3);
    }

    for (let i = 0; i < q; i+=1) {
        petal(0, 0, rStart+angle+i*(360/q));
    }

    angle = angle + dr  //drives the rotation of the drawing
}

function petal(v, w, r) {
    push();
    translate(v, w);
    rotate(r);

    beginShape()
    for (i=0; i < n; i++) {
        vertex(x[i], y[i]);
    }
    endShape();
    pop(); //forms a petal at v(x-coord) and w(y-coord) with rotation r based on the curve defined in line 25
}Category: Project-07-Curves
Project 07: Curves
For this assignment I began with the equation for the Quadratrix of Hippias, and scaled the equation based on the Y-Coordinate of the mouse. I also identified the limits of the formula and changed their visibility based on the X-Coordinate of the mouse.
sketchDownload
var t = 0;
var points = 200;
var eX = [];
var eY = [];
var a = 0;
var b = 0;
var r = 200;

function setup() {
    createCanvas(480, 480);
    background(0);

    stroke(255);
    strokeWeight(1);
    noFill();

    a = 15;
    b = mouseY;
}

function draw() {
  background(0);

  if (mouseY < 150 || mouseY > 330) {
    a = map(mouseY,0,height,-40,40);
  } else {a = 15}

  for (let i = 0; i < height; i += 1) {
    eY[i] = i;

    eX[i] = eY[i]*((1)/(tan((PI*eY[i])/(2*a))));

    line(eX[i]+240,eY[i]+240,eX[i+1]+240,eY[i+1]+240);
    line(eX[i]+240,-eY[i]+240,eX[i+1]+240,-eY[i+1]+240);

    if (abs((eX[i])-(eX[i+1])) > 400) {
      push();
      strokeWeight(2);
      stroke(map(mouseX,0,width,0,255),0,0);
      line(eX[i]+240,eY[i]+240,eX[i+1]+240,eY[i+1]+240);
      line(eX[i]+240,-eY[i]+240,eX[i+1]+240,-eY[i+1]+240)
      pop();
    }
  }
}
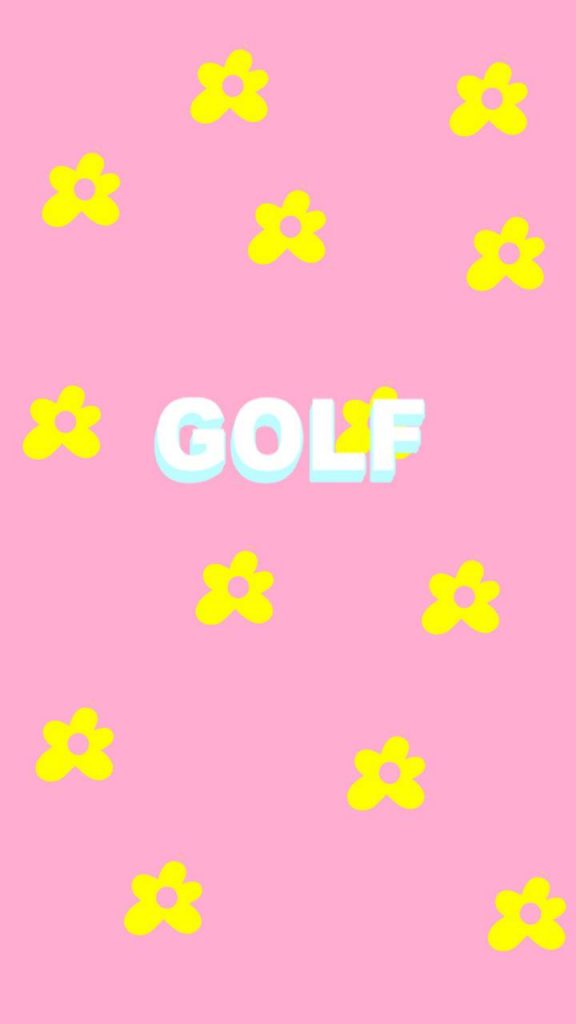
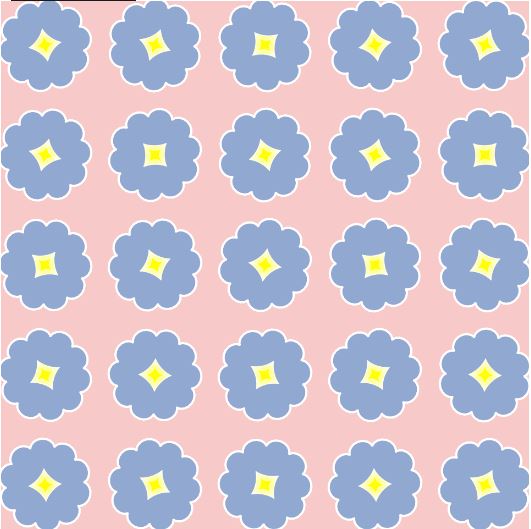
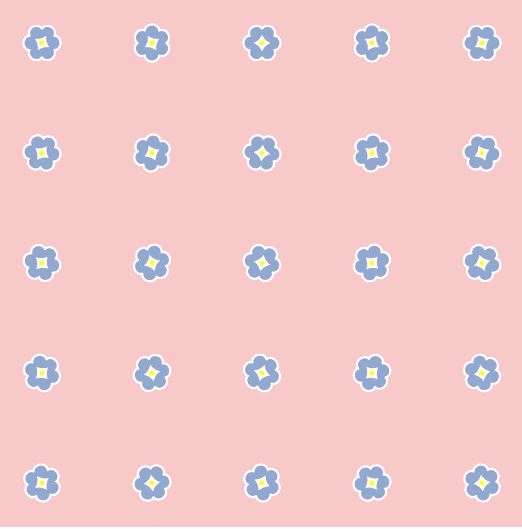
Project 7: Curves
For this project, I was really inspired by some of the curves and the fact that the hypocycloid resembled the outline of a flower! I wanted to create something that was a cross between something resembling Tyler the Creator’s ‘golf wang’ line and a bed of moving flowers in the wind.
I therefore came up with my final product, which has flowers with centers that move and rotate depending on the user’s mouse position:
sketchDownload
// Susie Kim
// susiek@andrew.cmu.edu
// Section A, 15-104
// Assignment 7

// set global variables
var angle = 0;

function setup() {
    createCanvas(480, 480);
    frameRate(15);
}

function draw() {
	background(247, 202, 201); // sets background to pink tone

    // create grid of flowers, starting at 40, 40. results in a 5x5 grid of flowers.
	for(var x = 40; x <= 480; x+= 100) {
		for(var y = 40; y <= 480; y+= 100) {
			push();
			translate(x, y);

			// have flowers rotate depending on mouse X pos
			rotate(radians(angle));
	        angle += mouseX;

	        // call upon flower functions to draw flower outer and center
	        drawHypocycloid();
	        drawAstroid();

	        pop();
		}
	}
}

// draw blue flower exterior
function drawHypocycloid() {
	// set local variables
	var a = int(map(mouseX, 0, width, 15, 40));
	var b = int(map(mouseY, 0, height, 8, 13));

	// set colors and strokes
	fill(145, 168, 209);
	strokeWeight(2);
	stroke(255);

	beginShape();

	// draw hypocycloids, with size increasing for mouse X and number of petals increasing with mouseY
	for (var i = 0; i < 250; i++) {
		var subAngle = map(i, 0, 110, 0, TWO_PI);
		var x = a*((b - 1)*cos(subAngle) + cos(subAngle) + cos((b - 1)*subAngle)) / b;
		var y = a*((b - 1)*sin(subAngle) + sin(subAngle) + sin((b - 1)*subAngle)) / b;
		vertex(x,y);
	}
	endShape();
}

// draw yellow center of the flowers
function drawAstroid() {
    // set colors and strokes
	fill(255, 255, 0);
	strokeWeight(.1);
	stroke(255);

	beginShape();

	// draw for each astroid, with size increasing with mouse X position
	for (var i = 0; i < 300; i++) {
		var subAngle = map(mouseX, 0, width, 7, 15); // changes size with X pos
		var x2 = subAngle*pow(cos(i), 5);
		var y2 = subAngle*pow(sin(i), 5);
		vertex(x2, y2);
	}
	endShape();
}
Project 07 Curves
curveDownload
function setup() {
    createCanvas(480, 480);
    background(220);
    text("p5.js vers 0.9.0 test.", 10, 15);
}

function drawAgnesiCurve() {
	var x; //x position of the curve
	var y; //y position of the curve
	var a = mouseX; //honestly not sure what a does
	stroke(max(mouseX, 255), max(mouseY, 255), 0);
	strokeWeight(4);
	beginShape();
	for (var i = 0; i < 65; i++) {
		var t = map(i, 0, 65, 0, TWO_PI);
		x = (2*a)*sin(t);
		y = a*(1-cos(2*t));
		vertex(x, y);
	}
	endShape();
}


function draw() {
	background(0, 0, min(mouseX, mouseY))
	for (var nLine = 0; nLine < 48; nLine++) {
		translate(width/2, 0);
		drawAgnesiCurve();
		translate(0, 10);
	}
}
Project 07 – (Curves) Futuristic Macaroni
Although a disappointingly small amount of code to show for it, this assignment was a huge challenge. Interpreting the math formulas in order to take intentional creative liberties required a lot of guess work and experimentation. I made many iterations of interactions involving different curves until I came across the epicycloid plane curve and figured I would try to work with it. This whole project for me was just about experimenting which in the end I found really rewarding, I was able to make an almost 3D feeling interactive shape with pretty streamlined code.
sketchDownload
// Assignment 07 - PROJECT
// Name: Jubbies Steinweh-Adler
// Email: jsteinwe@andrew.cmu.edu
// Class: Section D
var ns = 60; //rotation
var nm = 0.4; //sensitivity of wrarotation
var size = 3;
function setup(){
createCanvas(600,400);
}
function draw(){
background(0);
translate(width/2,height/2);
stroke(250, 230, 0);
strokeWeight(5);
fill(0);
var t = 3;
var a = map(mouseX, 0, width, 1, 7);
var b = map(mouseY, 0, height, 1, 100);
var offsetX = width/2 - mouseX;
var offsetY = height/2 - mouseY;
//DRAW SHAPES
for(let i = 0;i < 60; i++) {
circle(x1(t+i, a, b) + offsetX, y1(t+i, a, b) + offsetY, 7);
square(x1(t-i, a, b), y1(t-i, a, b), map(mouseY, 0, height, 0, 30), 3);
}
}
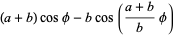
function x1(t, a, b) {
return (a + b) * cos(t/ns) - b * cos((a + b) /b * (t/nm));
}
function y1(t, a, b) {
return (a + b) * sin(t/ns) - b * sin((a + b)/b * (t/nm));
}
Notice how the columns in the spiral meld into a new column when the shape rotates beyond the rotation capacity! It’s fun to play with : ^)
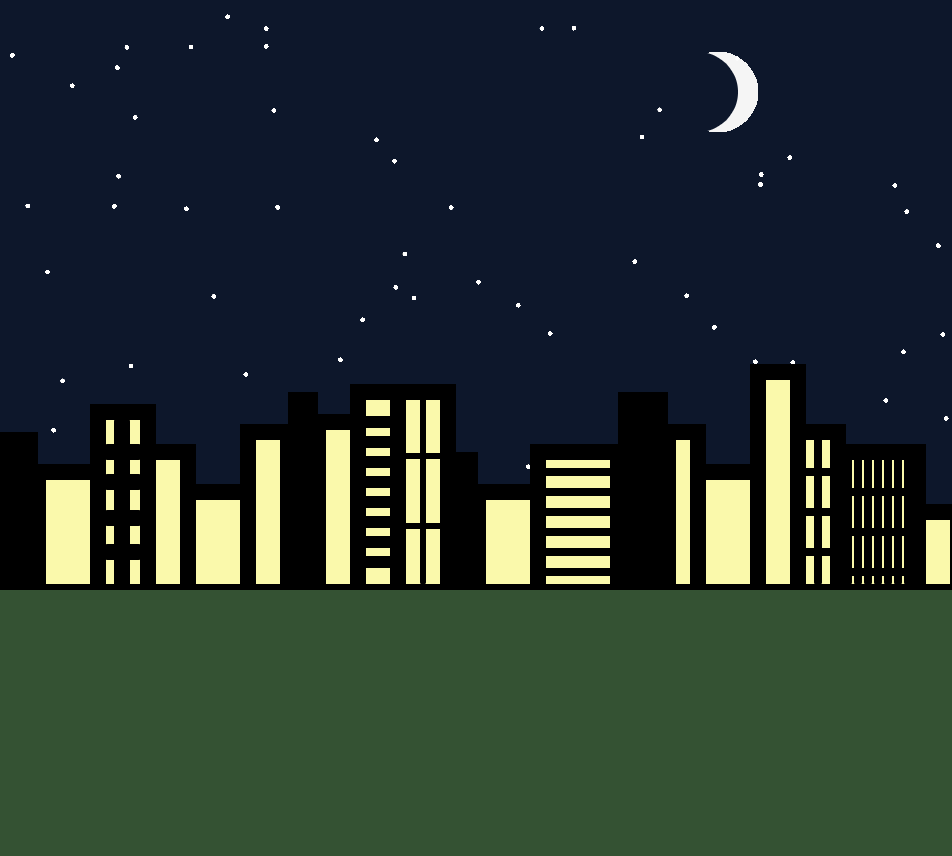
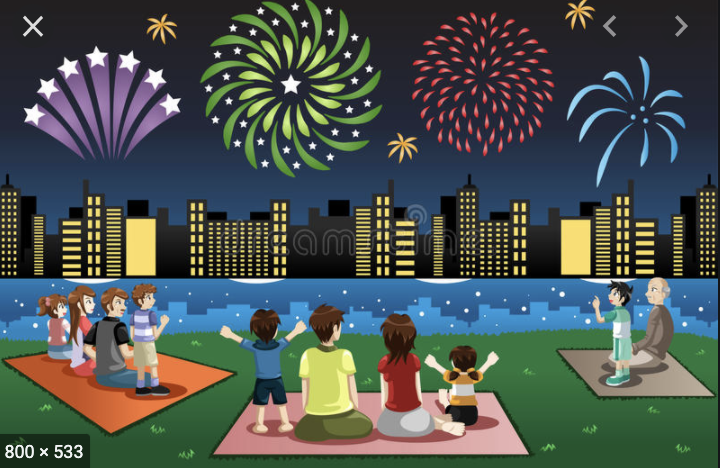
Project-07-Curves (Fireworks)
For my project, I wanted to incorporate these curves so that it served a purpose to the image. I did not want to simply create curves and just submit random shapes. I thought that the curve I wanted to use would suit the appearance of fireworks very well. It was difficult at first to figure out how to create these fireworks because I originally wanted them to burst and then disappear/fall down as real fireworks do. However, I decided to just have the fireworks growing and changing colors because I wanted the curves to constantly be seen. I based my project off of a cartoon image of a Fourth of July fireworks celebration, and that is why I put a person on a picnic blanket on the grass so that it would make more sense. I think the easiest part for me was making the city skyline and the person’s body because I have continuously layered shapes in all my projects. I think the most difficulty I had was creating the fireworks, while also making them different enough so that it actually seemed like real unpredictable fireworks. As mouseX or mouseY moves, colors of the fireworks can change, and the size and patterns move based on the mouse movement.
sketch
//Annie Kim
//anniekim@andrew.cmu.edu
//SectionB
//anniekim-07-project ~ CURVES ~

xStar = []; //array for stars
yStar = [];

function setup() {
    createCanvas(480, 440);
    background(10, 23, 45); //dark blue sky
    for (i = 0; i < 60; i ++) {
    	xStar[i] = random(0, 480); //randomly placing stars
    	yStar[i] = random(0, 240);
    }
    frameRate(10);
}
function draw() {
	//moon
    fill(245);
    noStroke();
    circle(360, 50, 40);
    fill(10, 23, 45);
    circle(350, 50, 40);

    var s = second(); //stars popping up every second
    for (i = 0; i < s; i ++) {
    	fill(255);
    	ellipse(xStar[i], yStar[i], 2, 2); //stars
    }
//orange OR yellow firework
    push();
    translate(250, 80);
    if (mouseX > 240) { //mouseX right half -> yellow
    	stroke(218, 218, 100);
    } else { //mouseX left half -> orange
    	stroke(218, 100, 100);
    }
	firework1();
	pop();
    //purple or pink firework
	push();
	translate(450, 45);
	if (mouseY < 240) { //mouseY top half -> pink
		stroke(135, 105, 170);
	} else { //mouseY bottom half -> purple
		stroke(105, 85, 255);
	}
	firework2();
	pop();
	//blue firework
	push();
	translate(30, 50);
	stroke(136, 194, 223);
	firework3();
	pop();
    //pink and red firework
	push();
	translate(200, 200);
	if (mouseX < 240) { //mouseX left half -> pink
		stroke(180, 70, 180);
	} else { //mouseX right half -> red
		stroke(255, 120, 150);;
	}
	firework4();
	pop();
	//green or dark green firework
	push();
	translate(440, 180);
	if (mouseX > 240) { //mouseX right half -> dark green
		stroke(155, 165, 130);
	} else {
		stroke(205, 255, 180);
	}
	firework5();
	pop();

	//~~~~~CITY~~~~~
	//buildings in black
	fill(0);
	noStroke();
	rect(0, 260, 480, 40); //base
	rect(0, 220, 20, 80);
	rect(145, 200, 15, 100);
	rect(225, 230, 15, 70);
	rect(310, 200, 25, 100);
	//city buildings FILLED BY YELLOW
	fill(250, 250, 160);
	stroke(0);
	strokeWeight(8);
	rect(20, 240, 30, 60);
	rect(50, 210, 25, 90);
	rect(75, 230, 20, 70);
	rect(95, 250, 30, 50);
	rect(125, 220, 20, 80);
	rect(160, 215, 20, 85);
	rect(180, 200, 20, 100);
	rect(200, 200, 25, 100);
	rect(240, 250, 30, 50);
	rect(270, 230, 40, 70);
	rect(335, 220, 15, 80);
	rect(350, 240, 30, 60);
	rect(380, 190, 20, 110);
	rect(400, 220, 20, 80);
	rect(420, 230, 40, 70);
	rect(460, 260, 20, 40);//rightmost building
    //START OF WINDOW MAKING(separated by building in code)
	strokeWeight(8);
	stroke(0);
	//building #1
	line(62, 215, 62, 300);
	line(55, 230, 70, 230);
	line(55, 245, 70, 245);
	line(55, 263, 70, 263);
	line(55, 280, 70, 280);
    //building #2
	strokeWeight(4);
	line(270, 240, 310, 240);
	line(270, 250, 310, 250);
	line(270, 260, 310, 260);
	line(270, 270, 310, 270);
	line(270, 280, 310, 280);
	line(270, 290, 310, 290);
    //building #3
	line(410, 220, 410, 295);
	line(400, 240, 420, 240);
	line(400, 260, 420, 260);
	line(400, 280, 420, 280);
    //building #4
    line(425, 230, 425, 295);
	line(430, 230, 430, 295);
	line(435, 230, 435, 295);
	line(440, 230, 440, 295);
	line(445, 230, 445, 295);
	line(450, 230, 450, 295);
	line(455, 230, 455, 295);
	line(420, 250, 460, 250);
	line(420, 270, 460, 270);
	line(420, 290, 460, 290);
    //building #5
    strokeWeight(6);
	line(180, 215, 200, 215);
	line(180, 225, 200, 225);
	line(180, 235, 200, 235);
	line(180, 245, 200, 245);
	line(180, 255, 200, 255);
	line(180, 265, 200, 265);
	line(180, 275, 200, 275);
	line(180, 285, 200, 285);
    //building #6
	strokeWeight(3);
	line(200, 232, 225, 232);
	line(200, 267, 225, 267);
	line(212.5, 200, 212.5, 295);
    //END OF WINDOW MAKING
	//grass
	fill(42, 83, 47);
	noStroke();
	rect(0, 299, 480, 141);

	//picnic blanket
    fill(220, 125, 145); //pink color
    stroke(185, 100, 100); //darker pink color outline
    quad(150, 340, 310, 340, 330, 400, 130, 400); //blanket
    //PERSON SITTING ON BLANKET
    //arms
    fill(230, 200, 170);
    noStroke();
    rect(170, 340, 8, 30);
    rect(212, 340, 8, 30);

    //pants
    fill(104, 104, 55);
    noStroke();
    ellipse(185, 380, 45, 25);
    ellipse(205, 380, 45, 25);
    //shirt
    fill(234, 234, 131);
    noStroke();
    rect(177.5, 313, 35, 57);
    ellipse(195, 369, 38, 9);
    rect(170, 320, 10, 20);
    rect(210, 320, 10, 20);
    //shoulders
    circle(177.5, 321, 15);
    circle(212.5, 321, 15);
    //sleeve lines
    stroke(200, 200, 100);
    strokeWeight(2);
    line(178, 327, 178, 340);
    line(212, 327, 212, 340);
    //neck
    fill(200, 170, 140);
    noStroke();
    rect(190, 305, 10, 8);
    //head shape
    fill(230, 200, 170);
    ellipse(195, 295, 23, 28);
    //hair
    fill(80, 45, 25);
    ellipse(195, 285, 25, 20);
    ellipse(191, 290, 20, 30);
    triangle(195, 288, 207, 288, 195, 303);
    //ear
    fill(230, 200, 170);
    stroke(200, 180, 140);
    strokeWeight(1);
    ellipse(200, 295, 4, 7);
}

function firework1() { //yellow-orange firework
	var x;
	var y;
	var a = map(mouseY, 0, height, 0, 20);
	var h = map(mouseY, 0, height, 0, 20);
	var b = a / 4;
	var angle = 360;
	beginShape();
	for (var i = 0; i < angle; i ++) {
		strokeWeight(0.2);
		noFill();
		var q = map(i, 0, 180, 0, TWO_PI);
		x = (a - b) * cos(q) + (h) * cos(((a + b)/ b) * q);
		y = (a - b) * sin(q) + (h) * sin(((a + b)/ b)* q);
		vertex(x, y);
	}
	endShape(CLOSE);
}

function firework2() { //purple-pink firework
	var x;
	var y;
	var a = map(mouseY, 0, height, 0, 35);
	var h = map(mouseY, 0, height, 0, 35);
	var b = a / 8;
	var angle = 360;
	beginShape();
	for (var i = 0; i < angle; i ++) {
		strokeWeight(0.2);
		noFill();
		var q = map(i, 0, 180, 0, TWO_PI);
		x = (a - b) * cos(q) + h * cos(((a + b)/ b) * q / 2);
		y = (a - b) * sin(q) + h * sin(((a + b) / b) * q / 2);
		vertex(x, y);
	}
	endShape(CLOSE);
}

function firework3() { //blue firework
	var x;
	var y;
	var a = map(mouseX, 0, 240, 0, 20);
	var h = map(mouseY, 0, 240, 0, 20);
	var b = a / 15;
	var angle = 360;
	beginShape();
	for (var i = 0; i < angle; i ++) {
		strokeWeight(0.08);
		noFill();
		var q = map(i, 0, 180, 0, TWO_PI);
		x = (a - b) * cos(q) + h * cos(((a + b)/ b) * q);
		y = (a - b) * sin(q) + h * sin(((a + b) / b) * q);
		vertex(x, y);
	}
	endShape(CLOSE);
}

function firework4() { //pink-red firework
	var x;
	var y;
	var a = map(mouseX, 0, 400, 0, 50);
	var h = map(mouseY, 0, 400, 0, 40);
	var b = a / 20;
	var angle = 360;
	beginShape();
	for (var i = 0; i < angle; i ++) {
		strokeWeight(0.2);
		noFill();
		var q = map(i, 0, 180, 0, TWO_PI);
		x = (a - b) * cos(q) + h * cos(((a + b)/ b) * q);
		y = (a - b) * sin(q) + h * sin(((a + b) / b) * q);
		vertex(x, y);
	}
	endShape(CLOSE);
}

function firework5() { //green-dark green firework
	var x;
	var y;
	var a = map(mouseX, 0, 240, 0, 18);
	var h = map(mouseX, 0, 240, 0, 18);
	var b = a / 7;
	var angle = 360;
	beginShape();
	for (var i = 0; i < angle; i ++) {
		strokeWeight(0.4);
		noFill();
		var q = map(i, 0, 180, 0, TWO_PI);
		x = (a - b) * cos(q) + h * cos(((a + b)/ b) * q);
		y = (a - b) * sin(q) + h * sin(((a + b) / b) * q);
		vertex(x, y);
	}
	endShape(CLOSE);
}
Project 07-Curves
sketch
var nPoints = 100;
function setup() {
    createCanvas(400, 400);
    frameRate(60);
}


function draw() {
    background(0);

    // draw the frame
    fill(0);
    noStroke();
    stroke(57,255,20);
    noFill();
    rect(0, 0, width-1, height-1);

    // draw the curve
    push();
    translate(width / 2, height / 2);
    for( var count = 1; count <= 9; count += 1){
      if(count <=3){
        drawButterflyCurve(-200 + count*100, 110);
      }else if(count <= 6){
        drawButterflyCurve(-200 + (count-3)*100, 0);
      }else if(count <= 9){
        drawButterflyCurve(-200 + (count - 6)*100, -110);


      }
    }
    pop();

}
function drawButterflyCurve(dx, dy){
  var x;
  var y;
  beginShape();
  for (var i = 0; i < nPoints; i++) {
        var t = map(i, 0, nPoints, 0, TWO_PI);
        x = 20*Math.sin(t) * [(Math.E)**(Math.cos(t)) - 2*Math.cos(mouseX/100 + 4*t) + (Math.sin(t/12))**5] - dx;
        y = -20*Math.cos(t) * [(Math.E)**(Math.cos(t)) - 2*Math.cos(mouseY/100 + 4*t) + (Math.sin(t/12))**5] - dy;
    vertex(x,y);

  }
  endShape(CLOSE);
}
Reading the project description, I was very intimidated by this week’s project due to all the complicated formulas and many options. I think I was drawn to the butterfly curve because of the shape and the complexity of it. I wanted to make a pattern out of these curves while it would turn based off the mouse’s position. Based on the mouse position, the curves would change and the lines would make different positions.
Project-07-Curves
For this project I explored the conchoid of de Sluze curve. I thought this curve was interesting because it reflects different curves across a vertical access depending on if the equation is multiplied by a positive or negative “a”. This reminded me of a galaxy being pinched and forming from space matter so I added a rocket and stars into the background. It also looks like a planet is forming from space matter. The colors change based on the mouse position, the sizes of the curves also change based on mouse position, and when you keep your mouse pressed you can make the right half of the curve (changed “a” value).
graanak-07
//Graana Khan
//Section B
// 07 - Project - Curve Composition

var p = 500; //number of points
var x;
var y;
var a;

function setup() {
    createCanvas(480, 480);
    background(0);
}

function draw() {

//drawing the conchoid curve
	push();
	translate(width/2, height/2);
	scale(25);
	conchoid();
	pop();

//adding the stars in the background
	stars(50, 50);
	stars(230, 350);
	stars(400, 400);
	stars(380, 100);
	stars(200, 150);
	stars(460, 240);
	stars(70, 430);
	stars(100, 270);
	stars(300, 300);

//rocket in corner
	x = 70;
	y = 400;
	rocket();

}

//function for the conchoid of de Sluze
function conchoid(){
	beginShape();
	stroke(mouseX-200, mouseY-100, 200); //color changes on mouse position
	strokeWeight(0.01);
	noFill();

	//creating loop for the curves
	for(var i =0; i < p; i++){
		var t = map(i, 0, p, 0, 2*PI);

		if(mouseIsPressed){  //a values switch from positive to negative if mouse is pressed
			a = mouseX/100;
		} else {
			a = -1*(mouseX/50);
		}

		//equations are from https://mathworld.wolfram.com/ConchoidofdeSluze.html
		x = ((1/cos(t)) + (a*cos(t)))* cos(t);
		y = ((1/cos(t)) + (a*cos(t)))* sin(t);
		vertex(x,y);
	}
	endShape();
}

//function for making the stars
function stars(x,y){
	stroke(255);
	line(x, y-5, x, y+5);
	line(x-5, y, x+5, y);
}

//rocket in the corner
function rocket(){
	push();
	translate(x,y);
	rotate(radians(45));
	noStroke();
	fill(255);
	rect(0, 0, 14, 28, 2);
	triangle(0, 0, 7, -13, 14, 0);
	triangle(0, 8, 0, 16, -4, 16);
	triangle(14, 8, 14, 16, 18, 16);
	stroke(255, 0, 0);
	line(2, 30, 2, 40);
	line(11, 30, 11, 42);
	stroke(244, 128, 11);
	line(5, 30, 5, 45);
	stroke(244, 238, 11);
	line(8, 30, 8, 37);
	noStroke();
	fill(0);
	circle(7, 10, 8);
	pop();
}
Project 07 : Curves
petal
//Rachel Kim
//15-104(Section C)
//rachelki@andrew.cmu.edu
//Project 07


//global variables
var numPoints = 800;

function setup() {
    createCanvas(480, 480);
}

function draw() {

    background(200); //dusty pink bkgrd color


    for (var x = 40; x <= 480; x += 80) {	//number of "modules" (grid)
        for (var y = 40; y <= 480; y += 80) {
            push();
            translate(x, y);
            EpicycloidPedal();
            pop();
        }
    }

    for (var x = 80; x <= 460; x += 80) {	//number of "modules" (grid)
        for (var y = 80; y <= 460; y += 80) {
            push();
            translate(x, y);
            HypocycloidPedal();
            pop();
        }
    }
}


function HypocycloidPedal() {

    //radius
    var a = map(mouseX, 0, 480, 0, 120);
    var b = map(mouseX, 0, 480, 0, 60);

    strokeWeight(mouseY/100, mouseX/350); //change in stroke thickness
    stroke(158, 188, 254); //blue color
    noFill();

    //moduleShape
    beginShape();
    for (var i=0; i<numPoints; i++) {
        var angle = map(i, 0, 180, 0, TWO_PI);
        var n = 8; //number of pedals

        //equations from mathworld
        x = a * (((n-1) * cos(angle)) + (cos((n-1) * angle)) / n);
        y = a * (((n-1) * sin(angle)) - (sin((n-1) * angle)) / n);

        vertex(x, y);
    }
    endShape();
}


function EpicycloidPedal() {

    //radius
    var a = map(mouseX, 0, 480, 0, 160);
    var b = map(mouseX, 0, 480, 0, 80);


    strokeWeight(mouseX/80, mouseY/200); //change in stroke thickness
    stroke(255, 242, 147); //yellow color
    noFill();

    //module shape
    beginShape();
    for (var i=0; i<numPoints; i++) {
        var angle = map(i, 0, 100, 0, TWO_PI);

        //equations from mathworld
        x = ((1/2) * (a+(2*b))) * (cos(angle) - cos(((a+b)*angle) / b));
        y = ((1/2) * (a+(2*b))) * (sin(angle) - sin(((a+b)*angle) / b));

        vertex(x, y);
    }
    endShape();

}
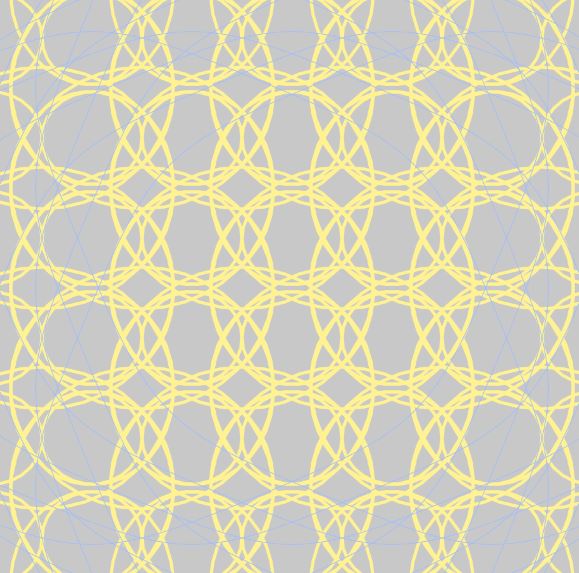
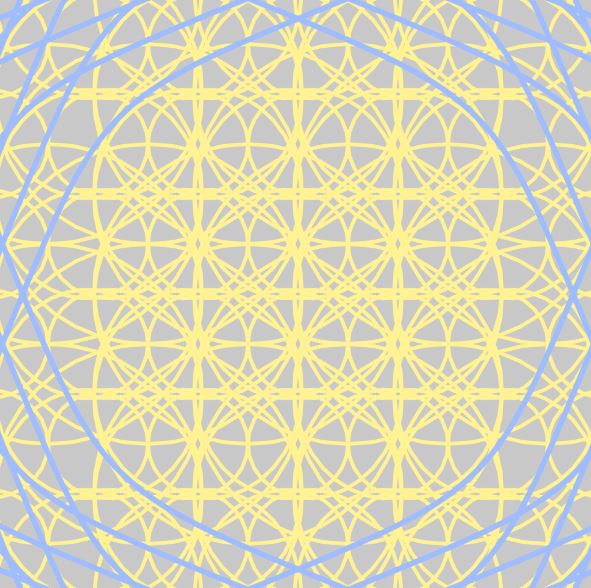
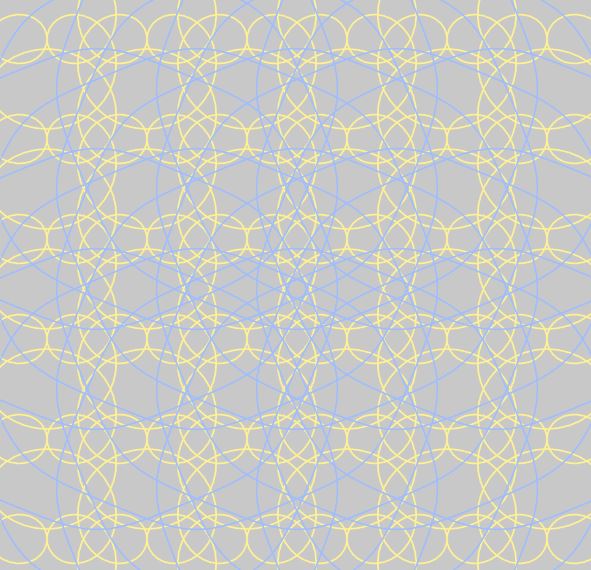
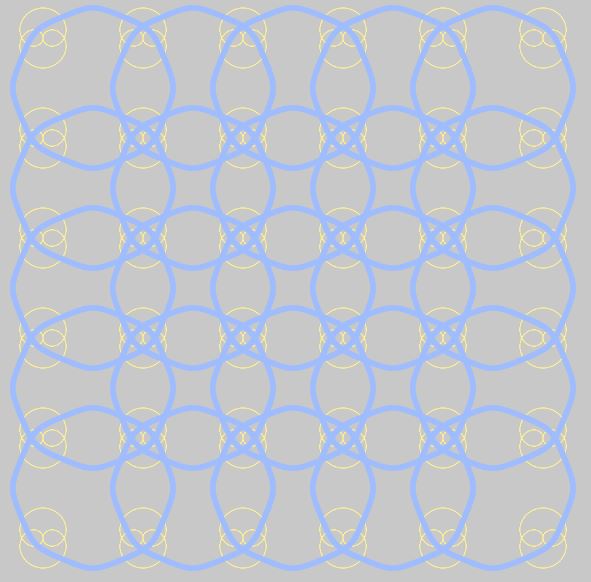
After browsing through the Mathworld curves site, I wanted to explore the possibilities of the Hypocycloid pedal curve and the Epicycloid pedal curve under the roulettes category. Using different functions, I tried showing the different shapes each curve had the ability to make, through the manipulation of its radius and x and y coordinates. Above, there are screenshots of the different visuals depending on where the mouse is placed on the screen. I did not want to manipulate any change in the colors, because I want the user to focus on the different geometries.
Project 7: Curves
I was really drawn to the rounded curves of the Cardioid and wanted to see how much I could alter this shape based on my mouse’s position. Based on your mouse’s position on the canvas, the Cardioid will change in shape and color.
curves
var nPoints = 100;
var CARDIOID = 0;
var curveMode = CARDIOID;

function setup() {
    createCanvas(480, 480);
    noStroke();
    frameRate(20);
    pinkColor = color(255, 179, 184);
    paleGreen = color(236, 255, 214);
    paleBlue = color(224, 222, 255);
    yellowColor = color(254, 255, 222);
}

function draw() {
    //change color of background depending on MouseY
    let changeBG = map(mouseY, 0, height, 0, 1);
    var changeColor = lerpColor(paleGreen, paleBlue, changeBG);
    background(changeColor);

    //drawing the cardioid
    push();
    rotate(-(PI/2.0));
    translate(-width/4.0, height/2);
    switch (curveMode) {
        case CARDIOID:
            drawCardioidCurve();
            break;
    }
    pop();
}

function drawCardioidCurve() {
    //Cardioid: https://mathworld.wolfram.com/Cardioid.html
    //x = a cos t(1 - cos t)
    //y = a sing t(1 - cos t)

    var x;
    var y;
    var a = 150.0;
    var stifleMouse = constrain(mouseX/2.5, 0, width);

    //changing cardioid color
    let changeShape = map(mouseY, 0, height, 0, 1);
    var shapeColor = lerpColor(pinkColor, yellowColor, changeShape);
    fill(shapeColor);

    //cardioid shape
    beginShape();
    for (var i = 0; i < nPoints; i++) {
        var t = map(i, stifleMouse, nPoints, 0, TWO_PI);
        x = a * cos(t) * (1 - cos(t));
        y = a * sin(t) * (1 - cos(t));
        vertex(x, y);
    }
    endShape(CLOSE);
}